sensor network application domains. The success of those applications is determined by the quality of the collected data. Thus, it is crucial to carefully analyze ...
Data Quality and Failures Characterization of Sensing Data in Environmental Applications Kewei Sha, Guoxing Zhan, Safwan Al-Omari, Tim Calappi, Weisong Shi and Carol Miller Wayne State University {kewei,dw1911,somari,tcalappi,weisong,cjmiller}@wayne.edu
Abstract Environmental monitoring is one of the most important sensor network application domains. The success of those applications is determined by the quality of the collected data. Thus, it is crucial to carefully analyze the collected sensing data, which not only helps us understand the features of monitored field, but also unveil any limitations and opportunities that should be considered in future sensor system design. In this paper, we take an initial step and analyze one-month sensing data collected from a real-world water system surveillance application, focusing on the data similarity, data abnormality and failure patterns. Our major findings include: (1) Information similarity, including pattern similarity and numerical similarity, is very common, which provides a good opportunity to trade off energy efficiency and data quality; (2) Spatial and multi-modality correlation analysis provide a way to evaluate data integrity and to detect conflicting data that usually indicates appearances of sensor malfunction or interesting events; and (3) External harsh environmental conditions may be the most important factor on inflicting failures in environmental applications. Communication failures, mainly caused by lacking of synchronization, contribute the largest portion among all failure types.
1
Introduction
As new fabrication and integration technologies reduce the cost and size of wireless micro-sensors, we are witnessing another revolution that facilitates the observation and control of our physical world [3, 12], just as networking technologies have changed the way individuals and organizations exchange information. Environmental monitoring, targeting at discovering and understanding the environmental laws and changes, is one of the most important sensor network application domains. With the increasing number of deployments of sensor systems, in which the main function is to collect interesting data at the sink, it is becoming crucial to carefully ana-
lyze the large amount of collected data. However, this problem is neglected in previous research, which mainly focuses on energy efficient, reliable sensor systems design and optimization. Although data quality management attracts more and more attention in the last two years [10, 15], proposing novel data quality management mechanisms is still an important and interesting research topic. We argue that sensor system optimization and data quality management are closely related to the characteristics of collected data, in other words, sensor system optimization and data quality management should take data characteristics into consideration. Thus, in this paper, we take an initial step to characterize the data quality and failures using a set of one-month data collected by a real-world water system surveillance application. The data set consists of water level, precipitation, and gauge voltage measurements from 13 gauges located around Lake Winnebago, St. Clair River and Detroit River in January 2008. Our data analysis focuses on two aspects: quality oriented data analysis and failure pattern analysis. In quality oriented data analysis, we intend to discover two types of data, namely similarity data and abnormal data, whereas, in failure pattern analysis, we try to classify the common failure type and record failure time. The significance of our discovery is two-fold. On one hand, it helps us understand the laws and changes in the monitored field. On the other hand, it unveils the limitations in the current sensor system design, and provides us with a strong ground upon which we can base our future WSN systems design. Our study reveals several interesting facts. First, information similarity, including pattern similarity and numerical similarity, is very common, which provides a good opportunity to trade off energy efficiency and data quality. Second, different parameters exhibit different data characteristics, which suggests that adaptive protocols using variable sampling rates can bring in significant improvements. Third, spatial correlation analysis and multi-modality correlation analysis provide a way to evaluate data integrity and to detect conflicting data that usually indicates appearances of sensor malfunction or interesting events. Fourth, abnor-
mal data may appear all the time, and continuous appearance of abnormal data usually suggests a failure or an interesting event. Finally, external harsh environmental conditions may be the most important factor on inflicting failures in environmental applications. Communication failures, mainly caused by lack of synchronization, contribute the largest portion among all failure types. The rest of the paper is organized as follows. A brief background of the targeting application and data is described in Section 2. We conduct quality oriented data analysis in Section 3, followed by failure pattern analysis in Section 4. Finally, related work and conclusion are listed in Section 5 and Section 6 respectively.
2
G1
G2
G3
G4
Figure 2. St. Clair River and Detroit River
Background
not. High baud rate transmitters send data every hour. Data is then sent from the satellite to a central location in Wallops Island in Virginia, where the data samples are collected and arranged in files for later download through a regular ftp service. We conducted our analysis directly using the un-decoded files. This raw data set has not been subject to any quality control procedure, and thus provide a good opportunity to study failures happening in sensor network. Water level and precipitation are sampled once every hour, whereas voltage is sampled once every hour or every two hours. Water level is measured against the IGLD Datum 1985, which works as the base to measure current water level. So negative water level means it is below the local IGLD Datum 1985, though that does not happen often. Precipitation data is supposed to be constantly increasing (except when the gauge resets as part of its normal operation). To figure out how much precipitation fell over a one-hour period, the difference between consecutive samples are calculated and reported. The measurements for voltage and precipitation are in volts and inches respectively. Water level is reported in meters, centimeters and feet. For convenience, we converted the readings for water level in meters.
The United States Army Corps of Engineers (USACE) in Detroit District, has 22 data collection platforms commonly referred to as sensor nodes or gauges, deployed around the St. Clair and Detroit rivers in southeast Michigan as well as the Lake Winnebago watershed southwest of Green Bay, Wisconsin. One month data in January 2008 from 13 of the 22 gauges were made available for this study. Each sensor node collects battery voltage, water level and precipitation except the Dunn Paper gauge (G1) which collects battery voltage, air temperature and water temperature. However, precipitation data for the St. Clair/Detroit river system is not used in this work, because that “data” in the raw files is simply an artifact of the gauge programming. For convenience, we name each sensor node as G1, where ‘G’ stands for “gauge.” The gauge locations of G1, G2 and G3 are on the St. Clair River, G4 is located on the Detroit River, and G5 through G13 are spread around the Lake Winnebago watershed. Gauges G5 through G13 are shown in Figure 1, and the other remaining gauges are shown in Figure 2. It is worth mentioning that G8 and G10 suffered many failures throughout the period of study. Therefore, any data analysis on G8 or G10 will mostly look like “weird” or at least different from the other gauges.
3
G6 G10 G11
G12
G9
Quality-Oriented Sensing Data Analysis
In this section, we focus on quality-oriented sensing data analysis. How to define data quality is still an open problem. Here, We define high quality data as the data that contains the most information from the monitored field. To understand the quality of the collected data, we try to discover the spatial and temporal relationship among those data; specifically, we are mostly interested in detecting two types of data, redundant data and abnormal data. Usually, redundant data, which we name as similarity, will not affect the overall quality of the collected data when it is removed. Contrary to redundant data, abnormal data, which largely affects the data quality, should be examined more carefully, because it usually denotes sensor failures, malicious attacks or interesting events.
G13
G7
G5 G8
Figure 1. Lake Winnebago Watershed Data samples are sent from each gauge to the GOES satellite, once every hour or every four hours, depending on whether the station has a high baud rate transmitter or 2
3.1
Time Series Analysis for Individual Parameter
V Pattern
For each individual parameter, we define two types of similarity, the pattern similarity and the numerical similarity. Here, we define a pattern as the continuous reappearance of the same value sensed by one sensor, and the number of continuous reappearance is called pattern length. Note that a pattern must have a minimum length of 2. Thus, each pattern is a two tuple < key, length >. For example, if the sensor reads a series of 4, 4, 4, 5, 5, 4, 5, we detect the patterns as < 4, 3 > and < 5, 2 >, and the number of appearance of each pattern is 1. We use the pattern reappearance ratio, which is the ratio of the pattern data in the whole data, to measure the pattern similarity among the data. The numerical similarity records the number of reappearance of the same numerical value. For example, if a sensor reads a series of 4, 4, 4, 5, 5, 4, 5, we get numerical similarity as 4 times of appearance of value 4 and 3 times of appearance of value 5. Similarly, the numerical similarity ratio is used to evaluate the value similarity, which is defined as the ratio of the reappeared sensor readings in all sensor readings. 3.1.1 Pattern Similarity We detect all patterns for all monitoring parameters in 13 gauges. Here, we pick up gauge G5 as a typical example to show the patterns we detected as well as reappearance times of the pattern, which is shown in Figure 3. From the figure, we do find specific patterns in the collected data, and the number of total patterns is small for all three parameters. Water level of gauge G5 has the largest number of patterns, which is 33, whereas, precipitation has the smallest number of patterns, which is 19. Some patterns have very large pattern length. For example, the largest pattern length for water level and for precipitation are 77 and 139 respectively. This indicates that water level and precipitation values stay constant for a long period of time at the area where G5 located. The number of appearances of each pattern is mostly small, especially for patterns with large length. This is because we set up endurance interval as [0.00, 0.00], thus, very small difference between two keys, such as 14.66 and 14.67, are distinguish. Here endurance interval is an interval within which the difference between two readings can be ignored, for example, if the endurance interval is [−0.02, 0.02], 14.67 and 14.66 can be regarded as the same. Because of unavoidable system error in measurement and applications lowered requirements on accuracy, it is reasonable to set up an endurance interval for each monitoring parameter. Another reason is that we define different patterns even when they have the same key value but different lengths. Figure 4 shows the pattern reappearance ratio, where “-” means there is no available data. In the figure, we find that voltage has the smallest pattern reappearance ratio, which suggests that the changes of the voltage are very frequent.
Appearances 1 1 1 2 1 2 2 3 1 1 1 1 1 3 1 1 2 3 2 1 1 1 2 1 1 2 1 2 2 1 1 1
W Pattern
Appearances 1 1 2 1 2 1 1 2 2 4 2 2 1 3 2 4 1 1 1 1 1 1 1 1 1 1 1 1 1 1 1 1 1
P Pattern
Appearances 1 1 1 1 1 1 1 1 1 1 1 1 1 1 1 1 1 1 1
Figure 3. Detected patterns and the number of appearance in gauge G5.
This is also because we distinguished the pattern keys in extremely fine granularity; however, even in such a fine granularity, both patterns in water level and precipitation show a large ratio of pattern similarity. For example, the smallest pattern reappearance ratio is 0.43 in G3, and the largest pattern reappearance ratio is 0.94 in G12. While precipitation shows the largest pattern similarity, which can be seen not only from the least number of patterns in Figure 3, but also from the fact that it has all pattern reappearance ratio larger than 0.77; actually, most pattern reappearance ratio of precipitation is about 0.99 for all gauges. We can expect precipitation to stay stable at most time. It may change suddenly, however, after this sudden change, it goes back to normal and stabilizes for a long period of time. Voltage has the most varying pattern reappearance ratios, which ranges from 0.04 to 0.96, showing that the performance of the power supply is really independent and highly dynamic. The goal of the sensor network applications is to collect meaningful data, thus, most of those applications can endure a certain level of data inaccuracy, which will not affect our discovery of the rules and events in the monitoring field. We reexamine the pattern reappearance ratio after we lower the accuracy requirements on the collected data and set up different endurance intervals for three parameters. The resulted pattern reappearance ratio is depicted in Figure 5, where the three numbers under the title are the en3
Gauge ID
G1 G2 G3 G4 G5 G6 G7 G8 G9 G10 G11 G12 G13
Voltage Pattern Reappearance Ratio 0.07 0.85 0.78 0.38 0.50 0.17 0.96 0.23 0.04 0.10 0.87 0.05
Water Level Pattern Reappearance Ratio 0.64 0.43 0.57 0.88 0.84 0.69 0.87 0.44 0.83 0.94 0.88
terms of variable endurance interval, as shown in Figure 6, where the x-axis is the length of the pattern and the y-axis is the CDF of the pattern length. From the figure, we find that most patterns have short patten length. For example, when the endurance interval is set to be [0.00, 0.00], 90% of voltage patterns have length less than 10, and about 70% of water level patterns and about 60% of precipitation patterns have length less than 10. However, different parameters have different pattern lengths. In the figure, we can see that voltage, which has almost all pattern length less than 20, has more short length patterns than water level and precipitation, while precipitation has the longest length among the three parameters, where about 30% of the precipitation pattern has length longer than 20. This observation shows that precipitation is stable at most of the time, but the reading of the voltage has high dynamics. By increasing the endurance interval, more patterns have longer length appear. For example, when water level endurance interval is increased to [−0.04, 0.04], more than 30% of the patterns have length between 140 to 180.
Precipitation Pattern Reappearance Ratio 0.92 0.89 0.93 0.89 0.77 0.90 0.91 0.89
Figure 4. Pattern reappearance ratio with zero endurance interval.
durance intervals, which are mostly 10% of possible largest changes, i.e., we allow voltage to endure 0.2 volts changes, water level to endure 0.04 meter changes, and precipitation to endure 0.04 inch changes. Note that different units are used for water level and precipitation, i.e., meter for water level and inch for precipitation, which we keep the original units as in the raw data. Gauge ID
G1 G2 G3 G4 G5 G6 G7 G8 G9 G10 G11 G12 G13
Voltage Pattern Reappearance Ratio [-0.1, 0.1] 0.59 1.00 1.00 0.96 0.88 0.98 1.00 1.00 0.64 0.78 1.00 0.80
Water Level Pattern Reappearance Ratio [-0.02, 0.02] 0.85 0.74 0.78 0.99 0.94 0.99 0.94 0.72 0.93 0.99 0.95
3.1.2 Numerical Similarity Having studied pattern similarity, we move on to check the numerical similarity. Numerical similarity focuses on the numerical value reappearance of the sensing data, which differs from pattern similarity in that numerical similarity does not intend to detect any pattern. For the numerical similarity, we identify the number of appearance for each individual value. Figure 7 shows the numerical distribution of the collected data, where the x-axis is the numerical value of the sensing reading and the y-axis denotes the number of appearance of the corresponding numerical value. Note that we pick up the data collected by gauge G5 as an example. In the figure, we find that those three parameters exhibit totally different distributions. The reading of the voltage and water level are very close to normal distribution with µ = 14.22, σ = 0.38 and µ = 0.7, sigma = 0.02 respectively. The voltage readings are more centralized to value 14.7, while water level readings are more broadly distributed from 0.68 to 0.72 and centralized at 0.71. The reading of precipitation shows no obvious distribution. It spreads from about 1.25 to 2.55. Some precipitation values such as 1.29 and 2.51, appear much more times than others, which means no rain or snow falls for a long time after the precipitation value is read, while other precipitation readings only appear several times, which mainly depicts some transitional states during a continuous rain or snow falling. Like the pattern similarity ratio, numerical reappearance ratio is used to evaluate the numerical similarity. Figure 8 presents the numerical reappearance ratio of the sensing data at all gauges. We can see that all parameters exhibit very high reappearance ratio. Compared to pattern reappearance ratio, numerical reappearance ratio is much larger for voltage, fairly larger for water level, and com-
Precipitation Pattern Reappearance Ratio [-0.02, 0.02] 0.95 0.92 0.95 0.92 0.79 0.94 0.94 0.94
Figure 5. Pattern reappearance ratio with increased endure intervals.
Comparing Figure 5 to Figure 4, we can find that almost all pattern reappearance ratios increased by increasing the endurance interval, especially for those with small reappearance ratio in Figure 4. After we increase the endurance interval, we can see that 50% of the voltage data pattern reappearance ratio is larger than 0.95, while water level and precipitation pattern reappearance ratio do not change too much compared to that in voltage; however, most of them are still larger than those in Figure 4. From both figures, we can see that there is a big pattern reappearance ratio. In our definition, pattern length means the number of continuous appearance of the same sensor reading. Thus, we try to figure out the distribution of the pattern length in 4
1
0.9
0.8
[0.00,0.00] [-0.02,0.02] [-0.04,0.04] [-0.06,0.06] [-0.08,0.08] [-0.10,0.10]
0.7
0.6
0.5
0.4
0.3
0.2
0.8
0.7
0.5
0.4
0.3
0.2
0.1
0
0
20
40
60
80
100
120
[0.00,0.00] [-0.02,0.02] [-0.04,0.04] [-0.06,0.06] [-0.08,0.08] [-0.10,0.10]
0.6
0.1
0
Empirical Culmulative Probability
1
0.9
Empirical Culmulative Probability
Empirical Culmulative Probability
1
0.9
140
0.8
0.7
[0.00,0.00] [-0.02,0.02] [-0.04,0.04] [-0.06,0.06] [-0.08,0.08] [-0.10,0.10]
0.6
0.5
0.4
0.3
0.2
0.1
0
50
100
150
200
250
300
0
350
0
20
40
Water Level Pattern Length
Voltage Pattern Length
(a)
60
80
100
120
140
160
180
200
Precipitation Pattern Length
(b)
(c)
Figure 6. CDF of pattern length: (a) Voltage, (b) water level, (c) precipitation.
100
160
160
140
140
120
120
60
100
100
50
80
80
60
60
40
40
10
20
20
0
0
90 80 70
40 30 20
13.4
13.6
13.8
14
14.2
14.4
14.6
14.8
15
0
0.66
0.67
0.68
0.69
0.7
0.71
0.72
0.73
0.74
(a)
0
(b)
0.5
1
1.5
2
2.5
3
(c)
Figure 7. The number of appearances for each numerical values: (a) Voltage, (b) water level, (c) precipitation. Gauge ID
G1 G2 G3 G4 G5 G6 G7 G8 G9 G10 G11 G12 G13
Voltage Numerical Reappearance Ratio 0.84 0.99 0.97 0.91 0.82 0.94 0.99 0.97 0.77 0.82 0.99 0.89
Water Level Numerical Reappearance Ratio 0.64 0.43 0.57 0.88 0.84 0.69 0.87 0.44 0.83 0.94 0.88
Gauge ID
Precipitation Numerical Reappearance Ratio 0.92 0.89 0.93 0.89 0.77 0.90 0.91 0.89
G1 G2 G3 G4 G5 G6 G7 G8 G9 G10 G11 G12 G13
Figure 8. Numerical reappearance ratio with endurance
Voltage Numerical Reappearance Ratio [-0.1, 0.1] 0.95 0.99 0.99 0.97 0.94 0.98 1.00 0.99 0.89 0.92 1.00 0.95
Water Level Numerical Reappearance Ratio [-0.02, 0.02] 0.97 0.94 0.95 0.99 0.98 1.00 0.96 0.93 0.96 0.99 0.97
Precipitation Numerical Reappearance Ratio [-0.02, 0.02] 0.95 0.93 0.95 0.93 0.90 0.94 0.95 0.94
Figure 9. Numerical reappearance ratio with increased
interval [0.00, 0.00].
endurance intervals.
parable for precipitation. For example, the voltage pattern reappearance ratio in G1, G10 and G11 is less than 10%, while the voltage numerical pattern reappearance is close to 80%. The large difference implies that although the numerical readings of the voltage have a large similarity, they fluctuate very frequently and there are no obvious patterns in voltage readings. The two reappearance ratios of precipitation do not differ too much, which suggests that reappearance patterns play an important role in precipitation. Similar to what we have done in the pattern similarity analysis, we increase the endurance interval to a certain
level. Here, we set the endurance interval to the same value as we did in the pattern similarity analysis. As a result, most numerical appearance ratios are increased by increasing the endurance interval; however, the increasing rate is not as big as the one in pattern similarity analysis. From Figure 9, we really find that the numerical redundancy is very high in all three types of sensing data. For instance, after we increase the endurance interval, the numerical reappearance ratio is mostly over 90%. We also try to mine the pattern of the data change in terms of the time series. We calculate the coeffi-
5
0.4
ciency in the time series with different time periods such as 24 hours, 48 hours and so on, however, we find that all the coefficiencies are very low, thus, we believe that there is no strong clues showing the periodically reappearance pattern in data changes. 3.1.3 Abnormal Data Detection Abnormal data may result from sensor malfunction, data loss during the communication, faked data inserted by malicious nodes, or the appearance of an interesting event. We try to detect abnormal data based on the presented numerical value of the data. Basically, two types of abnormal data can be detected. One is the out-of-range data, and the other is dramatic changing data.
0.3
Hourly Change
0.2
Upper Limit
0.1
0 Average change -0.1
Lower Limit -0.2
-0.3
0
100
200
300
400
500
600
700
Time (in hours)
Figure 11. Limit control of G3’s hourly water level changes.
Gauge ID Parameter Position Value G6 Water Level Reading # 45 62.79 G10 Voltage Reading #47 1.00 G10 Voltage Reading #119 1.00 G10 Voltage Reading #126 1.00 G10 Voltage Reading #127 1.00 G10 Voltage Reading #323 1.00
G2 G3 G4 G5 G6 G7 G9 G10 G11 G12 G13 2.17% 1.55% 2.95% 0.00% 0.31% 0.16% 0.00% 1.40% 0.16% 6.06% 1.86%
Figure 12. Out-of-Limit ratio for hourly water level changes.
Figure 10. Detected out-of-range readings. Figure 10 shows the appearance of the out-of-range data, which is the data out of the possible valid range defined by the domain scientists. Based on the figure, we figure out that most sensing data are within the normal range. We find outof-range data only at two gauges, G6 and G10, and G6 only has one invalid reading. Considering the failure patterns to be discussed in Section 4, we find that G10 has a maximum number of failures as well. So, we believe there are some relations between the probability of abnormal readings and the probability of failures. Figure 11 explains hourly water level changes in gauge G3, where we find that their distributions are close to normal distribution based on normal probability plot, which is a graphical technique for assessing whether or not a data set is approximately normally distributed. For such data, 3-sigma limits is a common practice to base the control limit, i.e., whenever a data point falls out of 3 times the standard deviation from its average value, it is assumed that the process is probably out of control. In the figure, two horizontal lines depict the upper and lower 3-sigma limits. We find that only several points are out of the two limits, which means domain scientists do not need to check the cause of water level changes at most time. The similar patterns are detected in all gauges as shown in Figure 12, where most gauges have water level changes within 3-sigma limits. Investigation is deserved when out-of-limit changes are detected to find the cause of the abnormality. 3.1.4 Implications Learned from above similarity and abnormal analysis, we argue that we need to revisit system protocol design by integrating the intrinsic features of the monitoring parameters.
First, we can take advantage of the large amount of data similarity. Because data similarity is common, it is not necessary to transfer all the collected data to the gateway. Quality-assured local data processing, aggregation and compression algorithms are necessary to remove redundant data and reduce overall data volume but keep the quality of the collected data at a satisfactory level. By enduring a certain level of data inaccuracy, we can reduce the total amount of collected data up to 90% according to the pattern and numerical reappearance ratios. In addition, strong patterns are helpful to estimate the future data and detect abnormal data. Second, we can use different data sampling rates for different monitoring parameters. For example, we discover that the changes in voltage is much more frequent than those in precipitation. Thus, we need to increase the sampling rate to sense voltage data more frequently, whereas, decrease the sampling rate for precipitation. Furthermore, in the sensor readings for precipitation, some of them reappear a large amount of times, while others only appear once. Usually, the readings that only appear once or twice imply a high dynamic environment. Therefore, it is better to increase sampling rate so that we can detect the details in changes. Third, there may be a lot of abnormal data existing in the sensor reading. Basically, they can be classified to two categories. One type is transitional, which disappears very quickly. We can mostly ignore this type of data without affecting overall data quality by replacing it with a reasonable value. The other type is continuous, which typically lasts a longer period of time. This type of abnormal data usually implies malicious data or interesting events. When continuous abnormal data is detected, more attention should be paid to them at the early stage. For example, more data should 6
Water Level G2 G3 G4 G5 G2 1 0.924 0.174 0.344 G3 0.924 1 0.306 0.428 G4 0.174 0.306 1 0.486 G5 0.344 0.428 0.486 1 Water Level G2 G3 G4 G5 G6 G7 G6 0.083 0.254 0.413 0.159 G2 1 0.924 0.174 0.344 0.083 0.314 0.3770.4280.35 G3G7 0.924 0.314 1 0.306 0.2540.916 0.377 G4G9 0.174 0.64 0.306 0.601 1 0.486 0.4130.699 0.35 0.35 G5 0.344 0.428 0.486 1 0.159 0.916 G11 0.471 0.505 0.54 0.888 G6 0.083 0.254 0.413 0.159 1 0.113 G12 0.314 0.513 0.5250.916 0.436 G7 0.377 0.35 0.1130.875 1 G13 0.64 0.569 0.5910.699 0.528 G9 0.601 0.35 -0.1 0.555 0.659
be sampled and reported to the gateway as fast as possible. Finally, various data sampling rates may result in different amount of data traffic. Samplings for different parameters and detected abnormal data may have different priorities in their delivery to the gateway. A well designed data collection protocol is necessary to achieve this goal.
G11 G12 G13
Endurance Interval Confliction ration Endurance Interval 3.2 Gage ID and Spatial Confliction ration Sensing G5 Multi-Modality (0.00, 0.00) 0.0612 (0.00, 0.01) 0.0408 G6 0.0263 ((0.00, 0.01) 0.0236 ((0.00, 0.00) , ) , ) Data Analysis G7 (0.00, 0.00) 0.1778 (0.00, 0.01) 0.1111
0.471 0.505 0.54 0.888 0.002 0.832 0.825 1 0.909 0.627 0.513 0.525 0.436 0.875 -0.01 0.848 0.835 0.909 1 0.652 0.569 0.591 0.528 0.555 0.32 0.474 0.7 0.627 0.652 1
Precipitation G5 G6 G7 G9 G11 G12 G13
[0.00, 0.00] [‐0.01, 0.01]
0.5
G11 0.471 0.505 0.54 0.888 0.002 0.832 0.825 1 0.909 0.627
Figure 14. Spatial correlation of water level.
(0.00, 0.00) 0.0139 (0.00, 0.01) 0 InG9 we analyze relationship 0.0679 between G10this subsection, (0.00, 0.00) 0.4786the (0.00, 0.01) 0.0476 (0.00, 0.01) 0.0476 two G11 types (0.00, 0.00) of sensing data, water level and precipitation. G12 (0.00, 0.00) 0 (0.00, 0.01) 0 Moreover, we try to explore the spatial relationship at difG13 (0.00, 0.00) 0.0145 (0.00, 0.01) 0.0145 ferent locations. 0.6
G6 G7 G9 0.083 0.314 0.64 0.254 0.377 0.601 0.413 0.35 0.35 0.159 0.916 0.699 G9 G12 G13 1 G11 0.113 -0.1 0.64 0.471 0.513 0.569 0.113 1 0.601 0.505 0.5250.659 0.591 0.35 0.436 0.528 -0.1 0.54 0.659 1 0.699 0.888 0.875 0.555 0.002 0.832 0.825 -0.1 0.002 -0.01 0.32 -0.010.832 0.848 0.659 0.8480.835 0.474 0.32 0.474 1 0.825 0.835 0.7 0.7
0.4
G5 1 0.977 0.996 0.995 0.985 0.996 0.996
G6 0.977 1 0.959 0.99 0.996 0.967 0.968
G7 0.996 0.959 1 0.983 0.969 0.999 0.998
G9 0.995 0.99 0.983 1 0.992 0.988 0.988
G11 0.985 0.996 0.969 0.992 1 0.975 0.975
G12 0.996 0.967 0.999 0.988 0.975 1 0.999
G13 0.996 0.968 0.998 0.988 0.975 0.999 1
0.3
Figure 15. Spatial correlation of precipitation.
0.2
sensors at different locations in this application, we do not expect spatial correlation among voltage readings at the different gauges, which is validated by the collected data. The calculated co-efficiency value between any two gauges is less than 0.54 and 99% of them is less than 0.32. However, we do find some spatial correlation for both water level and precipitation based on the data sensed from various gauges. The results are depicted in Figure 14 and 15 respectively. In the figure for precipitation, we only have data for listed gauges. We can see that all gauges with precipitation data have very large co-efficiency value because they are all located at Lake Winnebago, which means that the weather in that area is pretty uniform. When there is a rain fall at the location of one of the gauges, it is most probably raining at the locations of the other gauges as well. Water level also exhibits the similar pattern. In Figure 14, gauges located closely usually have high co-efficiency values, which results in similarity in water level changes, while gauges located far away usually have no obvious similarity in terms of water level changes. For instance, gauges can be grouped into several small groups with similar water level changes based on the calculated large co-efficiency values. Thus, gauge G2 and G3 are within one group with co-efficiency value larger than 92%. We can see that both of them are located in St. Clair River. G4 is the only gauge in Detroit River, so it has no high co-efficiency with any other gauges. Moreover, gauge G5, G7, G11, and G12 show high similarity because they are located closely. Thus, we believe that geographical similarity exists in the sensed data for water level and precipitation. Implication Multi-modality and spatial sensing data analysis helps us to find the correlation between different parameters and geological correlation of the same parameter. Therefore, data collected by the correlated sensors can be used as a reference to calibrate the sensing data. For
0.1 0 G5
G6
G7
G9
G10
G11
G12
G13
Figure 13. Conflict ratio of water level and precipitation. Although water level can be affected by many factors, including moisture when it starts raining, rainfall intensity, and even temperature and slope of the land, we believe that there is a relationship between water level and precipitation. Mostly when precipitation increases, water level should also increase. We count the ratio of the conflict, which is defined as the appearance when precipitation increases but water level decreases, to verify this relationship. Figure 13 records the conflict ratio between water level and precipitation. In the figure, the x-axis depicts the gauge ID, and the y-axis shows the conflict ratio. The dark blue bar and the gray bar denote the conflict ratio with endurance interval [0.00, 0.00] and [−0.01, 0.01] independently. From the figure we observe that in most cases the conflict ratio is less than 6%, which verifies that water level is closely related to precipitation; however, there are two gauges with conflicts larger than 10%, i.e., G7 has conflict ratio of 18% and G10 has conflict ratio of 48%. After a carefully examination, we figure out that G10’s high conflict ratio is related with lots of failures it has. While G7’s high conflict ratio may be caused by other reasons, because when precipitation increases only a little, other factors, such as moisture and temperature, may play major roles to determine water level. This is verified by the fact that when we increase the endurance interval a little, the conflict ratio decreases very fast, and it eventually disappears when we set endurance interval to [−0.01, 0.01] for water level and [−0.02, 0.02] for precipitation. We analyze spatial correlation for all of the three parameters. Because there are no direct communications among 7
G12 0.513 0.525 0.436 0.875 -0.01 0.848 0.835 0.909 1 0.652
G13 0.569 0.591 0.528 0.555 0.32 0.474 0.7 0.627 0.652 1
4.2
example, an increase in precipitation mostly results in an increase in water level. When there are some conflicts between them, we need to take a close look and figure out the reason of the conflict. Furthermore, we can take advantage of similarity in different parameters or sensors located in different locations. Quality-assured aggregation can be applied in this scenario to reduce the volume of sensing data. Thus, multi-modality models and spatial models are very useful in quality-assured data collection protocol design.
4
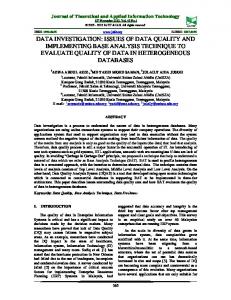
To understand the relative importance of these failure types, we draw their relative occurrence in the raw data traces for all locations combined in Figure 17(a) and the total downtime due to the particular failure type in Figure 17(b). Figure 17(a) gives an idea of how frequent a particular failure type is, whereas, Figure 17(b) clarifies how severe that failure is, in other words, how long it takes to recover from the failure. Comm-T1 2%
Failure Analysis
Comm-T3 2%
In this section we study the failure patterns of the sensor system including communication related failures and sensing hardware related failures. First, we present a few important definitions. TTF denotes Time To Failure and represents the time between two consecutive failures. Mean TTF (MTTF) is a measure of the system reliability. TTR denotes Time to Repair that is the time it takes the system to recover from a failure. A system that exhibits a small Mean TTR (MTTR) typically maintains high availability. Total time: represents the total system lifetime including functioning as well as failing periods. Uptime: the total time a system is in the functioning mode, in contrast, Downtime is the total time, in which the system is un-available. The following two equations illustrate the relationship between these values: Total time number of failures Downtime = MTTR · number of failures MTTF =
4.1
Failure Analysis by Type
Comm-T4 2% H/W-T2 4%
H/W-T1 34%
Comm-T2 56%
(a)
Comm-T3 3%
Comm-T1 Comm-T4 1% 5% H/W-T2 1%
Comm-T2 47% H/W-T1 43%
(b)
Figure 17. Understanding relative importance of different failure types. (a) shows their relative frequency (b) shows their contribution to system total downtime.
In Figure 17(a), we observe that 56% of the total number of failures are of type Comm-T2 communication failure, all other communication related failures (i.e., Comm-T1, Comm-T3, and Comm-T4) collectively account for only 6% of the total number of failures. Comm-T2 as well as Comm-T4 are directly related to the lack of time synchronization between the gauge station and the satellite unit, thus, the lack of time synchronization constitutes 58% of the total number of failures. Failure to report measurements by the sensor hardware on time (i.e., H/W-T1 failure) accounts for 34% of the total number of failures, in contrast, reporting corrupted data (i.e., H/W-T2 failure) accounts for only 4%. This observation suggests that fail-stop failures are more common in the real world environmental applications. Figure 17(b) allows us to observe the importance of the different failure types from a different perspective, in particular, how long it takes to recover from a particular failure type. For example, Although Comm-T4 and Comm-T1 failure types account for the same percentage of the total number of failures (i.e., 2% as shown in Figure 17(a)), it seems that recovering from a Comm-T4 failure takes more time compared to recovering from a Comm-T1 failure, which allows us to conclude that Comm-T4 failures are more important than Comm-T1 failures, in other words, Comm-T4 failures contribute 5% to the system total downtime, whereas, Comm-T1 contributes only 1% as shown in Figure 17(b). We also, observe that sensing hardware failures (i.e., H/WT1 and H/W-T2 failures) account for 44% of the total system downtime. We observe in Figure 17 that we have two equally impor-
(1) (2)
Methodology
For each sensing parameter (i.e., Water level or Precipitation), we organize the readings as a discrete time series and locate missing or corrupted readings. Each missing or corrupted reading is considered a failure. For each time series, we record the Number of Failures, TTFs, and TTRs for each individual failure type independently. In our investigation of the raw data traces, we discovered several failure types. Some of these failures are related to communication failures, while others are pertinent to the sensing hardware itself. Figure 16 lists all the failure types we encountered in the raw data along with a simple description for each one of them. The first four failures in the figure (i.e., Comm-T1 to Comm-T4) are communication failures between the gauge station and the satellite unit. The last two failures (i.e., H/W-T1 and H/W-T2) are sensing hardware malfunctioning. H/W-T1 represents a fail-stop failure, where the sensor simply fails to report a reading on time, whereas, in H/W-T2, the sensor reports a corrupted reading (i.e., unreadable values). 8
Failure Type
Message in the raw traces
Comm-T1
"ADDRESS ERROR CORRECTED"
Comm-T2
"MISSING SCHEDULED DCP MESSAGE"
Comm-T3
"MESSAGE RECEIVED ON WRONG CHANNEL"
Comm-T4
"MESSAGE OVERLAPPING ASSIGNED TIME WINDOW"
H/W-T1
Blank
H/W-T2
Corrupted reading
Description Unknown reasons. We could not reach technical people who could provide explanation. Communication failure due to lack of time synchronization between the gauge station and the satellite unit. The message was not received on the channel that has been assigned to that particular gauge station. Communication failure due to lack of time synchronization between the gauge station and the satellite unit. Sensor failure, no reading was reported by the sensor on time. This represents a fail-stop sensor failure Sensor failure, the data format is corrupted, unreadable reading
Figure 16. Failure types and their description. tant major failure types, communication related failures and sensing hardware failures. Based on these findings and after consultation with field experts, we decide to merge these failure categories and abstract them into two failure classes: communication failures and sensing hardware failures in the rest of this section.
4.3
ular importance in remotely deployed environmental monitoring sensor applications. Sensor hardware failures are also a major source of failures in these applications, we found that fail-stop failure is the most common failure pattern in this category. We further observed that different sensor hardware exhibit different failure characteristics, in particular, different repair times. Finally, we found that external environmental factors, perhaps, are the most important factor on inflicting failures in environmental applications. This makes deployment-based failures particularly important, in which failures are independent of aging. Since our data set spans only a short period of time (one month), it is hard to draw any conclusions about the effect of aging on failures, however, by the camera-ready time, we will have access to 3 more months worth of data, this will allow us to provide more analysis regarding usage-based failures and aging.
Failure Analysis by Location
In this subsection, we study failure characteristics at different locations, which allows us to understand the effect of the environment on inflicting failures on the system. At each location, we record the Number of failures and MTTR for each failure type and draw them in Figure 18(a) and Figure 18(b) respectively. Note that MTTF is directly proportional to the Number of failures (refer to Equation 1), therefore, including MTTF offers no insight in our analysis. Figure 18 allows us to observe that gauge G10 experience much more failures compared to the other gauges, because of the hostile environment surrounded G10. This suggests that the external environment plays a significant role in the failure frequency and pattern of the system. We also observe in Figure 18(a) that the environmental impact is uniform in inflicting different failure types. For example, Figure 18(a) shows that gauge G10 suffered around 26 communication failures, 26 water level sensor failure, and 28 precipitation sensor failures, whereas, Gauge G3 experienced 1 water level sensor failure, 1 precipitation sensor failure, and 0 communication failures. In Figure 18(b), we observe that different failure types need different recovery time. For example, at gauge G10 in Figure 18(b), precipitation sensor failure takes more time on average to recover from a failure compared to water level sensor failure. Surprisingly, communication failures exhibit much longer repair time.
4.4
5
Related Work
The work presented in this paper is inspired by many previous work in WSNs, although, to our knowledge, it is the first work on detailed data quality and failures characterization of sensing data in WSNs. Next, we will list the most relevant previous efforts. SenseWeb [14] has provided a venue for people to publish their data, but we have not seen any analysis yet. Our next step will use more data set from SenseWeb. Data aggregation is an important way to reduce the volume of the collected data. A few data aggregation approaches have been proposed. These approaches make use of cluster based structures [6] or tree based structures [2, 5, 7, 11, 18]. Tang and Xu propose to differentiate the precisions of data collected from different sensor nodes to balance their energy consumption [16]. Adaptive sampling has been proposed to match sampling rate to the properties of environment, sensor networks and data stream. Jain and Chang propose an adaptive sampling approach called backcasting [8]. Gedik and Liu proposed a similar way of data collection, selective sampling [4]. Al-
Summary and Implications
Based on our findings, we believe that the lack of time synchronization is a major source of communication failures, this makes time synchronization algorithms of partic9
Communication Failure
Sensing Failure for Water Level
Communication Failure
Sensing Failure for Precipitation
MTTR (in hours)
30
# of Failures
25 20 15 10 5 0
G2 G2
G3
G4
G5
G6
G7
G8
G9
G10
G11
G12
Sensing Failure for Water Level
Sensing Failure for Precipitation
18 16 14 12 10 8 6 4 2 0 G3
G4
G13
G5
G6
G7
G8
G9
G10
G11
G12
G13
Gauge ID
Gauge ID
(a)
(b)
Figure 18. Understanding effect of external environment on inflicting failures. (a) effect of environment on failure frequency (b) effect of environment on MTTR.
though many approaches have been proposed to reduce energy while maintaining data quality, there exists rare study on the pattern of raw data collected by sensor nodes in the real world. In addition, most studies adopt the way of simulation, whereas, our quality-oriented sensing data analysis gives a chance to take a fresh look at how the data behaves. Failure pattern is another important issue for WSNs. There have been a few efforts that focus on understanding failure patterns of computer hardware components, in particular hard disks [9, 13]. Our work employs similar techniques and investigates a different type of system that is deployed in an open environment, therefore, we believe that its failure behavior is totaly different from classical computer systems. To the best of our knowledge, there is no prior work that specifically studies and analyzes real sensor failure traces so that our work is a leading exploration step in this direction. Most existing work on WSN reliability assumes exponential lifetime distribution of sensor nodes [1, 17], and here we take a second look of such assumption by investigating real sensor system failure traces. Although the current data set spans a short period of time and does not permit us to draw strong conclusions regarding lifetime distributions, we believe that our work brings new insights in understanding sensor device failure patterns.
References
6
[12] G. Pottie and W. Kaiser. Wireless integrated network sensors. Communications of the ACM, 43(5):51–58, May 2000.
[1] S. Al-Omari and W. Shi. Availability modeling and analysis of autonomous in-door wsns. In Proceedings of IEEE MASS’07, September 2007. [2] M. Ding, X. Cheng, and G. Xue. Aggregation tree construction in sensor networks. In Proceedings of the 58th IEEE Vehicular Technology Conference’03, October 2003. [3] D. Estrin, D. Culler, K. Pister, and G. Sukhatme. Connecting the physical world with pervasive networks. IEEE Pervasive Computing, 1(1):59–69, 2002. [4] B. Gedik and L. Liu. Energy-aware data collection in sensor networks: A localized selective sampling approach. Technical report, Georgia Institute of Technology, 2005. [5] A. Goel and D. Estrin. Simultaneous optimization for concave costs: Single sink aggregation or single source buy-at-bulk. In Proceedings of the 14th Annual ACM-SIAM Symposium on Discrete Algorithms’03, 2003. [6] W. Heinzelman, A. Chandrakasan, and H. Balakrishnan. An applicationspecific protocol architecture for wireless microsensor networks. IEEE Transactions on Wireless Communications, 1(4):660–670, October 2002. [7] C. Intanagonwiwat, D. Estrin, R. Govindan, and J. Heidemann. Impact of network density on data aggregation in wireless sensor networks. In Proceedings of IEEE ICDCS’02, July 2002. [8] A. Jain and E. Chang. Adaptive sampling for sensor networks. In Proceedings of the First Workshop on Data Management for Sensor Networks(DMSN’04), August 2004. [9] W. Jiang, C. Hu, Y. Zhou, and A. Kanevsky. Are disks the dominant contributor for storage failures? a comprehensive study of storage subsystem failure characteristics. In Proceedings of USENIX FAST’08, January 2008. [10] M. Li, D. Ganesan, and P. Shenoy. PRESTO: Feedback-driven data management in sensor networks. In Proc. of the NSDI’06, May 2006. [11] H. Luo, J. Luo, and Y. Liu. Energy efficient routing with adaptive data fusion in sensor networks. In Proceedings of the Third ACM/SIGMOBILEe Workshop on Foundations of Mobile Computing’05, August 2005.
Conclusion
[13] B. Schroeder and G. Gibson. Disk failures in the real world: What does an mttf of 1,000,000 hours mean to you? In Proceedings of USENIX FAST’07, February 2007.
In this work, we use real sensor data sets collected by 13 sensor nodes to study and analyze data quality properties as well as failure patterns. We found that data redundancy is very high in the water level and precipitation data sets. This provides us with an opportunity to design more aggressive energy-efficient data collection protocols. We also found that the lack of time synchronization is a major source of communication failures in the system, which suggests that we should pay more attention to time synchronization protocols in remotely deployed WSN environmental applications. In our future work, we will focus on designing energy-efficient sensor networks with high-quality data taking advantage of what we have learned here about information redundancy, similarity between data series, and abnormal data detection.
[14] SenseWeb. Microsoft research.http://research.microsoft.com/nec/senseweb/ [15] K. Sha and W. Shi. Consistency-driven data quality management in wireless sensor networks. Technical Report MIST-TR-2007-001, Wayne State University, January 2007. [16] X. Tang and J. Xu. Extending network lifetime for precision-constrained data aggregation in wireless sensor networks. In Proc. of INFOCOM’06, April 2006. [17] S. Yu, A. Yang, and Y. Zhang. Dada: A 2-dimensional adaptive node schedule to provide smooth sensor network services against random failures. In Workshop on Information Fusion and Dissemination in Wireless Sensor Networks, 2005. [18] W. Zhang and G. Cao. Optimizing tree reconfiguration for mobile target tracking in sensor networks. In Proceedings of INFOCOM’04, March 2004.
10