Data Reduction in Support Vector Machines by a Kernelized Ionic Interaction Model
Technical Report
Department of Computer Science and Engineering University of Minnesota 4-192 EECS Building 200 Union Street SE Minneapolis, MN 55455-0159 USA
TR 03-038 Data Reduction in Support Vector Machines by a Kernelized Ionic Interaction Model Hyunsoo Kim and Haesun Park
September 22, 2003
Data Reduction in Support Vector Machines by a Kernelized Ionic Interaction Model Hyunsoo Kim and Haesun Park∗ Department of Computer Science and Engineering, University of Minnesota, 200 Union Street S.E., 4-192 EE/CS Building, Minneapolis, MN 55455, U.S.A. September 19, 2003 Keywords: Data Reduction, Support Vector Machines, Ionic Interaction Model (IoI), Kernelized IB2 (KIB2), KIB2-IoI, Kernel Parameter Optimization
Abstract A major drawback of support vector machines is that the computational complexity for finding an optimal solution scales as O(n3 ), where n is the number of training data points. In this paper, we introduce a novel ionic interaction model for data reduction in support vector machines. It is applied to select data points and exclude outliers in the kernel feature space and produce a data reduction algorithm with computational complexity of about n3 /4 floating point operations. The instance-based learning algorithm has been successfully applied for data reduction in high dimensional feature spaces obtained by kernel functions. We also present a data reduction method based on the kernelized instance based algorithm. We test the performances of our new methods which illustrate that the computation time can be significantly reduced without any significant decrease in the prediction accuracy.
∗ This work was supported in part by the National Science Foundation grants CCR-0204109 and ACI-0305543. Any opinions, findings and conclusions or recommendations expressed in this material are those of the authors and do not necessarily reflect the views of the National Science Foundation (NSF). corresponding author: Prof. Haesun Park, E-mail:
[email protected], Phone : 612-625-0041
1 Introduction When handling a large amount of data in machine learning, it is important to reduce the computation complexity and memory requirement without degrading the prediction accuracy. There have been several approaches proposed to overcome the computational difficulty and memory problems. Recently, for support vector machines (SVMs) [8, 29, 30], incremental learning has been proposed in order to handle huge data [27]. This repeats training a subset of the entire training data set and use the support vectors found in the previous step and chunking [5] and merging these with what is found in iterative training. Syes, et al. [28] selected a small subset of examples from the training set based on several selection strategies including the instance based IB2 selection method [1] and random sampling. They claim that the random sampling selection strategy is the most robust among the strategies they considered in terms of model independence i.e., with random sampling, training was successful with a wide range of different classifiers, such as multi-layer perceptron, nearest neighbor, C4.5, and SVMs. However, random selection method can sometimes cause a catastrophic decrease in accuracy. Minimal support vector machines (MSVM) [12] remove redundant data and finds a minimal set of support vectors, which is based on linear programming instead of the standard quadratic programming formulation by representing the margin in terms of the 1-norm. The successive linearization algorithm leads to a locally minimal
Case 1 Case 2 Case 3
αi = 0 0 < αi < C αi = C
yi f (xi ) ≥ 1 yi f (xi ) = 1 yi f (xi ) ≤ 1
ξi ≥ 0 ξi = 0 ξi > 0
xi not a support vector and unstable xi a support vector and stable xi a support vector and very stable
Table 1: KKT conditions and stability of the corresponding data points number of support vectors. Then, the MSVM generates a linear separating hyperplane by using the minimum number of support vectors. The reduced support vector machines (RSVM), which uses a reduced size kernel, was also introduced [20]. There are also other results based on low-rank approximation of the kernel Gram matrix for reducing computational complexity of kernel-based machine learning methods [31, 11, 26]. In this paper, we propose three new methods for predicting support vectors for reducing computational complexity in SVMs. The first is based on an Ionic Interaction (IoI) model that utilizes concepts from Electrostatics for a binary decision. The second is a kernelized instance based (KIB2) method. The instance-based algorithm (IB2) [1] was applied to select points in the input space [28], and was further developed it into a kernelizedIB2, where IB2 is applied in the high dimensional feature space based on the kernel. The third is a hybrid KIB2-IoI method where IoI is used as a complementary method to select data points in addition to the data points selected by KIB2. The test results show that with our methods, computational complexity in SVMs can be reduced substantially without significant decrease in prediction accuracy. 2 Ionic Interaction (IoI) Model and Data Reduction Methods The support vectors are the critical points near the boundary between the two classes, which determine an optimal separating hyperplane in SVM methods. Removing any training points that are not support vectors will have no effect on the hyperplane found [6]. If we can predict the support vectors before the training process, the computing time and the memory usage of SVMs will be reduced to an optimal separating hyperplane can be found by training a relatively smaller number of selected points instead of all of the given training points. For this purpose, we propose an ionic interaction (IoI) model for selecting the data points that are the candidates for the support vectors. The points in the (+) class and those in the (-) class are considered as plus ion (⊕, p-experon) and minus ion (⊖, n-experon), respectively, using a concept from Physics.
These names were chosen since the data points can be considered as experience particles in a high dimensional parameter space of a human decision model based on experiences. The experience particles in the metaphysical space interact with each other like ions in the real physical space. The ions with the same sign repulse each other, and the repulsion makes them unstable. The ions with opposite sign attract each other, and the attraction makes them stable. The training data points which are adjacent to the boundary between the two classes tend to be stabilized by attraction between plus ions (⊕) and minus ions (⊖). The sample points which are far from the boundary are relatively unstable due to repulsion between adjacent ions with the same sign. The number of predicted sample points can be controlled by choosing a threshold of instability. Our data reduction method is derived based on the L1 norm soft margin SVM which we first review briefly now. The decision rule for binary classification given by sign(f (x)) with (2.1)
f (x) = wT x + b
is obtained from a 1-norm soft margin support vector machine (SVM). For the training data (xi , yi ) with yi ∈ {−1, +1} for 1 ≤ i ≤ n, f (x) is obtained by solving an optimization problem n
min w,ξ,b
s.t.
X 1 T w w+C ξi 2 i=1 £ ¤ yi wT xi + b ≥ 1 − ξi , ξi ≥ 0, i = 1, · · · , n
where ξ = (ξ1 , ξ2 , · · · , ξn )T is a vector of slack variables, and C is a parameter that controls the trade-off between a large margin to the separating hyperplane and small training error. Consider a nonlinear feature mapping φ(x) that maps the input data to a feature space (possibly an infinite dimensional space) where the mapped data may have a linearly separable structure. Without knowing the feature mapping φ(x) or the feature space explicitly, we can work on the feature space through a kernel function, as long as the problem formulation depends only on the inner products between data points in the feature space and not on the data points themselves. The linear SVMs
Algorithm 1 : IoI (Selective Data Point Support Vector Machines by IoI model) Given m data points xi , 1 ≤ i ≤ m, a kernel function K with kernel parameters, a desired selection percentage (ρ), and data selection threshold value (Φt ), this algorithm finds a total approximate support vectors set (ASV = ASVp ∪ ASVn , |ASV | ≤ IN T (m ∗ ρ/100)) using the ionic interaction (IoI) model, where ASVp and ASVn are the approximate support vectors sets of the positive class and negative class, respectively. 1. calculate potential energy for all data points xi , 1 ≤ i ≤ m, by Φ(i) =
X δ(i, j) , rij
j∈Si
where Si is the set of index j for all opposite sign ions to ith ion, δ(i, j) is always -1 since ith ion and jth ion 2 have opposite sign here, and rij = kφ(xi ) − φ(xj )k2 = K(xi , xi ) + K(xj , xj ) - 2K(xi , xj ). 2. for each class do (a) sort all data points for a class by potential energy in ascending order. represent the sorted data points as xk for 1 ≤ k ≤ l. (b) ASVc ← {x1 } (c) for k = 2 to l if |Φ(k) − Φ(k − 1)| > Φt then ASVc ← ASVc ∪ {xk } else xk is not a support vector candidate (d) choose data points which have lower potential energy to select given selection percentage (ρ) of l data points for a class. (|ASVc | ≤ IN T (l ∗ ρ/100)). 3. ASV = ASVp ∪ ASVn
can be extended to nonlinear SVMs by introducing the These conditions can be rewritten as kernel function. The dual formulation with a kernel Case 1: yi f (xi ) ≥ 1, if αi = 0 function K is max α
s.t.
n X
i=1 n X
αi −
n 1 X αi αj yi yj K(xi , xj ) 2 i,j=1
αi yi = 0, 0 ≤ αi ≤ C, i = 1, . . . , n
i=1
where αi , 1 ≤ i ≤ n, denotes the optimal solution for the formulation. Then the decision rule is given by sign(f (x)) with
Case 2: yi f (xi ) = 1, if 0 < αi < C Case 3:
yi f (xi ) ≤ 1, if αi = C
The second and third cases occur when ξi = 0 and ξi > 0 respectively. The slack variable can have a non-zero value only when αi = C. If αi = 0 (Case 1), then xi is not a support vector. If 0 < αi < C (Case 2), then xi is the support vector with ξi = 0. If αi = C (Case 3), then xi is the support vector with ξi > 0.
Now, we would like to eliminate data points that are not support vectors by dropping unstable ions which have f (x) = (2.2) yj αj K(x, xj ) + b, relatively higher potential energy. In Case 2, the ions j=1 face the ions with the opposite sign over the separating where b is chosen so that yi f (xi ) = 1 for all i with hyperplane, so they are relatively stable. In Case 3, the 0 < αi < C. According to the Karush-Kuhn-Tucker ions are soaked into the opposite ionic pool, so they are (KKT) conditions, optimal solutions α and (w, b) satisfy very stable and will not be eliminated when unstable ions are dropped. In Case 1, the ions are surrounded αi [yi (K(w, xi ) + b) − 1 + ξi ] = 0 and by many with the same sign, so they are eliminated by ξi (αi − C) = 0, i = 1, . . . , n. the dropping process since they are relatively unstable. n X
In Table 1, we summarize the information for the three cases based on which ones are used to design our Ionic Interaction model. After choosing training points which are considered as approximate support vectors by the Ionic Interaction model, the separating hyperplane can be obtained by any variation of support vector machines. The approximate support vectors depend on the kernel type and kernel parameters. They are optimized to maximize prediction correctness of the test set for the iterative process. 3 Computation of Potential Energy and Data Reduction Algorithms The Coulomb potential energy between the ith and jth ions is qi qj V (i, j) = (3.3) D · rij
The distance rij between two data points in the feature space can be calculated by (3.7)
2 rij
= =
kφ(xi ) − φ(xj )k2 K(xi , xi ) + K(xj , xj ) − 2K(xi , xj ),
assuming that the kernel K which gives the inner products between the data points mapped by the feature mapping φ K(xi , xj ) = φT (xi )φ(xj ) is given. This process requires about n2 /2 floating point operations (flops) [13] to obtain all pairwise distances rij between any two data points for i > j. Note that rij = 0 when i = j and rij = rji when i < j. When using the radial basis function (RBF) kernel K(xi , xj ) = exp(−γkxi − xj k2 ),
where qi and qj are the charges of the ions, rij is the Euthe distance between any two data points in the feature clidean distance between the ith ion and the jth ion, and space becomes even more simple to compute as D is a dielectric constant. Assuming the homogeneous dielectric medium with D = 1, the potential energy be- (3.8) 2 rij = 2 − 2K(xi , xj ) tween the ith ion and other ions can be defined as
(3.4)
Φo (i) =
n X qi qj j6=i
rij
where n is the total number of ions. The analogous potential energy between the ith data point and the rest which have been mapped to a higher dimensional feature space by a feature mapping φ(x) is (3.5)
Φ(i) =
X
j∈Si
δ(i, j) kφ(xi ) − φ(xj )k
since K(xi , xi ) = 1 and K(xj , xj ) = 1. We can avoid any redundant calculations by storing the value of each computed value δ(i, j)/(kφ(xi ) − φ(xj )k). After calculating all pairwise distances, the potential energies for all ions can be calculated with computational complexity of about n3 /4 flops assuming the number of positive and negative ions are about the same. This is a cheaper process compared to solving a quadratic programming problem for which the complexity is over O(n3 ) for data reduction. In addition, various ways to approximate the potential energy can be applied.
In order to determine the local environment of the ith ion, we may consider only opposite sign ions within an adjustable parameter the ‘cutoff radius’, Rc , from the ith ion. Significant performance improvement can be achieved by taking advantage of range searching with kdtrees [3, 2] to find all other points within the cut-off radius Rc of the specific point. If the potential energy Φ(i) is assuming the absolute charge of the ions is 1. In our less than the threshold potential value Φs , then the ith ion model, δ(i, j) is always -1 since Si in Eqn. (3.5) involves is considered an approximate support vector since the ith only the ions with the opposite sign of the ith ion. Only ion is relatively stable compared to others. The reasonable the attraction is considered to select the points near the range of Φs values can be found by numerical experiments class boundary even though the ith ion may be surrounded considering various data sets. by many same sign ions. Considering all other points in It is possible to approximate the potential energy by calculating the potential energy of the ith ion does not work well for finding the points near the class boundary counting the number of points with the opposite sign since an ion can be surrounded by ions of the same sign within the cut-off radius. The approximate potential energy for the ith data point is so that it has high potential energy. where Si is the set of index j of the ions with the opposite sign, and ½ +1, sign(qi ) = sign(qj ) (3.6) δ(i, j) = −1, otherwise
Algorithm 2 : KIB2 (Selective Data Point Support Vector Machines by kernelized IB2) (3.9) Given m data points xi , 1 ≤ i ≤ m, and a kernel j∈Si function K with kernel parameters, this algorithm finds where Si is the set of index j such that 0 < rij ≤ Rc an approximate support vector set (ASV) from the input with the opposite sign of the ith ion, and η is a constant data points using the IB2 algorithm [1]. The distances for scaling the approximate potential to the order of the between two data points x and y in the feature space exact potential energy Φ(i). Since δ(i, j) is always -1, the can be computed by r(x, y)2 = kφ(x) − φ(y)k2 = value of the summation in Eqn. 3.9 can be easily obtained K(x, x) + K(y, y) − 2K(x, y), where K is a kernel by counting the number of opposite sign ions within the function and φ(·) is its corresponding mapping function cutoff radius. This process can be efficiently performed that maps input data to a feature space. by the range-counting algorithm [14]. ASV ← Ø The potential energy calculation step can be approxfor each x ∈ Input Data Set do imated by considering only nearest-neighbors within the cut-off radius or simplified potential energy. However, we 1. for each y ∈ ASV do calculated all potential energies considering only opposite Sim[y] ← 2K(x, y) − K(x, x) − K(y, y) sign ions to a selected desired percentage among given 2. ymax ← some y ∈ ASV with maximal Sim[y] training data points in this paper. In this case, we do not have to optimize the cut-off radius (Rc ) and threshold po3. if class(x) = class(ymax ) tential (Φs ). The threshold potential can automatically be then classification ← correct found when the percentage of selection is given. In Algoelse rithm 1, IoI represents a selection method to choose data points which have lower potential based on the IoI model. (a) classification ← incorrect When selecting data according to potential energy, (b) ASV ← ASV ∪ {x} we did not choose a data point for which potential energy is too similar to that of the previous selected data point even though it has low enough potential energy to be chosen. We need only one representative point among many points that face a very similar environment for data data points from the larger class and adding data points to reduction. In our experiments, we accept the data point the smaller class. We chose the latter in order to prevent only when the difference of potential energy between the information loss from the lager class, as well as to add data point and the previous selected data point is greater information to the smaller class. We added data points than the data selection threshold value (Φt ). We found that have lower potential energy which had not already that the data selection threshold value with a range of been included in the smaller class. IoIBX is a balanced 0.01 ≤ Φt ≤ 2.0 shows good performance for data re- selection excluding expected outliers. Using the IoI duction results through numerical experiments, though it model, we can expect that data points that have potential depends on the scattering structure of data points. The IoI energy substantially lower than others, i.e. surrounded by algorithm chooses data points that have a more different many ions with opposite sign, are outliers. This is one of environment than a higher data selection threshold value. the advantages of the IoI model. The percentage of chosen data points can be smaller than Our second approach is based on the boundary huntthe percentage of desired selection due to a large Φt value. ing algorithm, IB2 [1]. The approximate support vecIf the difference of the magnitude orders between differ- tors are found by IB2 instead of the ionic interaction (IoI) ent features is too large, e.g. Cleveland Heart data set [4], model in the feature space (See Algorithm 2). Although it an appropriate Φt value can be within the different range. has been observed that the selected data points in the input We avoid this problem by normalization of feature values space by IB2 can hardly represent the support vectors that for the Cleveland Heart data set. yield high prediction accuracy [28], we found that IB2 1 X δ(i, j), Φa (i) = η
IoIB is a balanced selection around the percentage of data points required to balance the number of training points of binary classes. There are two ways to balance the data points for positive and negative classes: removing
preforms well in the feature space obtained implicitly by a kernel, where the data points are assumed to be linearly separable. This approach is summarized in Algorithm 2 as kernelized IB2: KIB2.
200
200
180
180
160
160
140
140
120
120
100
100
80
80
60
60
40
40
20
20
0
0
20
40
60
80
100
120
140
160
180
200
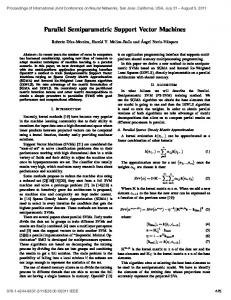
Figure 1: Classification of the original checker data set by SVM with RBF kernel. Ten-fold cross validated accuracy for the checker data set was 96.1%. The actual decision boundary was drawn in solid line. Support vectors are shown in star points.
Though the performance of KIB2 was good, it could not select additional data points that are able to improve the testing correctness since it only selected a predetermined number of data points. The ionic interaction model gave a rule to append data points to the selected data point by KIB2. The KIB2-IoI method is a combinational approach using the IoI model to append data points after obtaining candidate support vectors by KIB2 in order to generate a more accurate optimal separating hyperplane with a minimal number of selected points among the input data. The performance of all introduced algorithms depends on the input kernel parameter set. We have to optimize the kernel parameters in order to achieve better data reduction performance producing higher prediction accuracy in the classification problem by trying various parameter sets. When training data is unbalanced, an accuracy maximizing classifier tends to classify data points as a class that has much greater number of points. For dealing with this probable situation, we used different penalty parameters (C+ and C− ) in the SVM formulation [22]:
max αi
n X i=1
αi −
n 1 X αi αj yi yj K(xi , xj ) 2 i,j=1
0
0
20
40
60
80
100
120
140
160
180
200
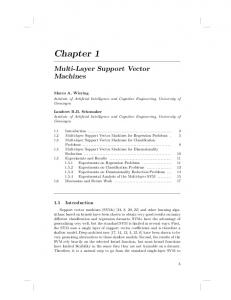
Figure 2: Classification of the selected points of checker data set by kernelized IB2 (KIB2). The prediction accuracy of test fold with this decision boundary was 96.0%. The decision boundary was drawn in solid line. Support vectors are shown in star points.
s.t.
n X
αi y i = 0
i=1
0 ≤ αi ≤ C+ , if yi = 1 0 ≤ αi ≤ C− , if yi = −1. We used a common heuristic in choosing C+ and C− to satisfy the ratio, C+ # of data points in the negative class = , C− # of data points in the positive class for the initial guess of the appropriate weighting parameters. We optimized the weighting parameters to obtain a better classifier that has low generalization error by trying several ratios from the initial guess. 4 Visualization of the Input Data In order to visualize data points in the input space, we need to project high-dimensional data to a 3 or 2dimensional space. Several widely accepted linear dimensionality reduction methods can be used for this purpose. The principal component analysis (PCA) [16] finds linear projections of great variance, by computing the eigenvectors of the data covariance matrix cooresponding to the largest eigenvalues. The multidimensional scaling (MDS)
(a)
(b)
100 6
6
4
4
(c)
120
700
90 600
100
0
−2
−2
−4
−4
−6
80 60
−6
4
500
70
50
60
4 2
5
2
5
0
40
0 0
0
−2 y
40
−2 −4
−5
x
y
−4
−5
30
the number of support vectors
0
time (sec)
2
accuracy
2
z
z
80
400
300
200
x
20 20
100
Figure 3: Data distribution of Pima Indians data set (left) 10 and selected data points (right) by applying IB2 boundary hunting algorithm in the mapped high dimensional feature 0 0 0 0 50 100 0 50 100 0 50 100 space by kernel. The 8 features in the input space were selection percentage selection percentage selection percentage reduced to 3 dimensional space by LLE to draw the structure of the data points. Figure 4: (a) Ten-fold cross validated accuracy (b) Computing time to obtain ten-fold cross validation accuracy. (c) The number of support vectors. All results were drawn [7] finds projections which minimize the stress of vio- against the percentage of selected data points on the UC lating metric pairwise distances between examples. The Irvine 8124 × 22 Mushroom data set. The solid, dashed, linear discriminant analysis (LDA) [10] finds a projec- and dashdot lines were the results of IoI for the selection tion which minimizes the within-cluster scatter and max- threshold values Φt of 0.1, 0.01, and 0.0, respectively. The imizes between-cluster scatter. These methods perform circle points were the results of KIB2. The star, square, well for the linearly separable cases and have been gen- and x-mark points were the results of KIB2-IoI with 10% eralized to handle nonlinear cases by using Mercer ker- additional data point for the selection threshold values Φt nels [25, 21, 23]. However, these kernel based dimen- of 0.1, 0.01, and 0.0, respectively. sion reduction methods are suitable for visualization of the the kernel feature space instead of the input space. We used nonlinear dimensionality reduction from locally linear embedding (LLE) to visualize the input space [24, 9]. broke the training data into 10 subsets. A classifier is The LLE discovers a compact representations of high- trained on the union of 9 of the subsets, and evaluated dimensional data by finding lower dimensional vectors on the 10th subset. The process is repeated 10 times, usthat best match reconstruction weights computed by k- ing each of the subsets as the validation subset once. The neighbors of each example. In Figure 3, this was used to results were combined from the validation subsets to obdraw the distribution of the Pima Indian data set and the tain an overall estimate of the effectiveness of the training procedure. This cross validation was also used to choose selected points by KIB2 in three-dimensional space. a parameter setting by making a cross-validated estimate of effectiveness at several values of the parameter. 5 Results and Discussion All our results were run on a 600MHz Pentium II The numerical results in Table 2 were achieved on UC with 500 megabytes of memory. We used the Gaussian Irvine test problems [4]: Ionosphere, BUPA Liver, Pima RBF kernel in all our experiments using SVMlight [15]. Liver, Cleveland Heart, Tic-Tac-Toe, and Mushroom In Table 2, only 50% of data points were selected for each to compare variations of the ionic interaction model- algorithm in order to compare them, though more accurate based data selection algorithm in terms of ten-fold cross- results can be obtained by selecting more data points. validation testing correctness. In cross-validation, we The IoIB algorithm generally showed good performance
Data set points × features Cleveland Heart 297 × 13 BUPA Liver 345 × 6 Ionosphere 351 × 34 Pima Indians 768 × 8 Tic-Tac-Toe 958 × 9 Mushroom 8124 × 22
Full data time(sec), (SV† ) 85.18% 1.69, (115.6) 74.79% 6.80, (201.6) 94.58% 3.16, (69.3) 76.95% 9.86, (395.7) 98.23% 50.50, (425.1) 100.0% 106.15, (628.1)
IoI time(sec) 83.18% 0.80 73.62% 0.99 94.31% 1.52 72.79% 6.63 93.84% 18.67 99.51% 6.85
IoIB time(sec) 83.51% 0.85 70.66% 1.97 94.88% 1.82 74.99% 4.62 96.56% 24.24 99.51% 6.79
IoIBX time(sec) 83.16% 0.92 71.31% 1.01 94.28% 1.35 74.60% 4.54 96.35% 24.14 99.43% 6.81
Table 2: Ten-fold cross-validation testing correctness (%) on UC Irvine test problems: Ionosphere, BUPA Liver, Pima Liver, Cleverland Heart, Tic-Tac-Toe, and Mushroom. Execution times is computing time to obtain ten-fold cross validation accuracy. SV† represents the average number of support vectors for ten-folds. IoI: results with the desired data selection percentage 50% of the data points that have lower potential by IoI model. IoIB: results with balanced selection around 50% of data points. IoIBX: results with balanced selection excluding expected outliers. compared to IoI. This means that balancing the data points in the selected data points is also helpful to obtain a more generalized optimal separating hyperplane. The number of points that will be excluded for IoIBX can be fixed or optimized for specific supervised machine learning problems. In this experiment, we excluded 2 points that have the lowest potential energy. However, we could not obtain good results by IoIBX. We think that this is due to the fact that the data sets that we used do not contain serious outliers.
algorithm to find a smaller number of data points without any significant decrease in the prediction accuracy. When the parameter is 0.0, the jumping selection function based on the potential energy difference between current data point and previous chosen data point is off. A too small Φt value generates a poor representation error (i.e. the chosen data points may contain redundant data points and miss meaningful data points in spite of a higher potential energy), while a too large Φt value has the IoI data selector choosing too few of the data points.
Table 3 shows the ten-fold cross validation accuracy and computing time to train and test for ten folds to compare the optimal ionic interaction (IoI) model-based algorithm, the kernelized instance based (KIB2) algorithm, and the hybrid (KIB2-IoI) algorithm. The number of 50% data points are approximately similar to the number of support vectors that was found after training with the full number of data points, except the Ionosphere and Mushroom data sets. For the Mushroom data set, the percentage of the points predicted as support vectors is mush less than 50% though the desired selection percentage was 50% in the IoI algorithm. This was possible through setting the data selection threshold parameter (Φt ) to 0.1. This means that the data set contains many data points that have similar information. By selecting representatives from each group that have a similar ionic environment, we achieved data reduction using the IoI model. Figure 4 shows that an appropriate data selection threshold value enables the IoI
The ionic interaction model-based methods tend to need more data points than KIB2 to obtain a similar level of accuracy. This tendency can be seen in Figure 4 again. Therefore, the computing time of KIB2 is generally much smaller than that of IoI. KIB2 only needs about 0.6% of the data points to produce 96.61% testing correctness for the Mushroom data set. However, IoI is a more general tool if we want to obtain better prediction accuracy than KIB2 since it can be used for balancing selected data points and exclusion of outliers. For IoI, the accuracy slowly decreased until 50% selection, while the computing time dramatically decreased and the number of support vectors decreased only a small amount as shown in Figure 4. The number of support vectors of KIB2 is much smaller than that of IoI. Generally speaking, we can say that KIB2 can select more compact data points that can be meaningful support vectors. However, we observed that the IB2-based data selector performed poorly due to
Data set points × features Cleveland Heart 297 × 13 BUPA Liver 345 × 6 Ionosphere 351 × 34 Pima Indians 768 × 8 Tic-Tac-Toe 958 × 9 Mushroom 8124 × 22
Full data set time(sec), (SV† ) 85.18% 1.69, (115.6) 74.79% 6.80, (201.6) 94.58% 3.16, (69.3) 76.95% 9.85, (395.7) 98.23% 50.50, (425.1) 100.0% 106.15, (628.1)
IoI time(sec), (ASV‡ ) 83.18% 0.80, (128.5) 73.62% 0.99, (159.5) 94.31% 1.52, (161.8) 72.79% 6.63, (300.1) 93.84% 18.67, (435.8) 99.51% 6.85, (797.4)
KIB2 time(sec), (ASV‡ ) 82.83% 0.97, (82.7) 71.28% 1.45, (139.7) 92.26% 0.72, (55.7) 73.95% 2.63, (235.1) 77.86% 1.71, (180.2) 96.61% 1.96, (52.9)
KIB2-IoI time(sec), (ASV‡ ) 80.48% 1.23, (108.7) 72.72% 1.83, (170.7) 94.59% 0.97, (88.4) 75.38% 4.67, (329.1) 91.54% 14.28, (296.2) 99.53% 6.34, (730.0)
Table 3: Ten-fold cross-validation testing correctness (%) on UC Irvine test problems: Ionosphere, BUPA Liver, Pima Liver, Cleverland Heart, Tic-Tac-Toe, and Mushroom. The execution times are the computed time to obtain ten-fold cross validation accuracy. SV† represents the average number of support vectors for ten-folds. ASV‡ represents the average number of data points predicted as support vectors. IoI: results with the desired selection percentage 50% of the data points which have lower potential energy by IoI model. KIB2: results with the selected data points by KIB2. KIB2-IoI: results with the data points of selected data points by KIB2 and 10% additional data points by IoI model. the characteristics of the IB2 boundary hunting algorithm when the data points are too unbalanced. The Tic-Tac-Toe UC Irvine test problem has the size of one class only about 53% of the size of the other class. For this problem, the balanced data selectors such as IoIB and IoIBX showed better performance than that of KIB2.
are input values of KIB2 algorithm for reduction of training data points, we can find a parameter set to maximize the cross-validation rate. This is one of the major achievements in this paper.
When we treat a huge number of data points in kernel-based supervised machine learning, it is very time consuming to search for the optimal kernel parameters. The newly introduced KIB2 data selector is a novel efficient method to find the optimal kernel parameters, or at least rough ranges of the parameters. After obtaining cross-validation rates for different parameter sets which
in the material world may be present in the metaphysical world as well. While some classification problems, for example, text categorization [17], suffers from a large number of features, many Bioinformatics problems, for example, protein secondary structure prediction [19] and solvent accessibility prediction [18], suffer from a large number of data points. They also suffer from a large
The Ionic Interaction model (IoI)-based data selector is a new method to exclude outliers. In other methWe also tested the checker data set [20] to see how ods, kernel-based machine learning algorithms can be prewell KIB2 works on a data set containing 2 dimensional vented from finding a good generalized separating boundfeatures, which easily allows drawing of the data points ary. The hybrid KIB2-IoI data selector is a more reliand decision boundary. In Figure 1, the actual decision able data reduction method compared to the KIB2-based boundary was drawn in the input space. The ten-fold cross approach, especially for unbalanced data. However, we validated accuracy for the checker data set was 96.1%. would like to point out that KIB2 is still a comparable The support vectors are shown in star points. After data selector when the data are well balanced. applying KIB2 in the mapped kernel feature space, we In this paper, we applied the ionic interaction concept could obtain a relatively small number of data points. The of Physics to the data reduction problem by considering decision boundary was drawn in the input space by these data points of positive and negative classes as p-experons selected data points. The testing accuracy was 96.0%. and n-experons, respectively, i.e. experience particles in The results of KIB2-IoI exhibited good performance in the metaphysical space of a human decision model based terms of the testing correctness as well as ashort learning on experiences. We would suppose that the principle of and testing times (See Table 3 and Figure 4). the negative and the positive, i.e. the cosmic dual forces,
number of outliers. The IoI or KIB2-IoI data selector can be applied to those problems to generate a more accurate optimal separating hyperplane that has lower generalization error and overfitting.
[16] [17]
Acknowledgements We would like to thank Dr. D. W. Aha for his kind help and Dr. Dennis DeCoste for valuable comments on kernelized locally-linear embeddings.
[18]
References
[19]
[1] D. W. Aha, D. Kibler, and M. Albert. Instance-based learning algorithms. Machine Learning, 6:37–66, 1991. [2] J. L. Bentley. Multidimensional divide-and-conquer. Communications of the ACM, 23(4):214–229, 1980. [3] J. L. Bentley and J. H. Friedman. Data structures for range searching. Computing Surveys, 111(4):398–409, 1979. [4] C. L. Blake and C. J. Merz. UCI repository of machine learning databases, 1998. [5] P. S. Bradley and O. L. Mangasarian. Massive data discrimination via linear support vector machines. Optimization Methods and Software, 13:1–10, 2000. [6] C. J. C. Burges. A tutorial on support vector machines for pattern recognition. Data Mining and Knowledge Discovery, 2:121–167, 1998. [7] T. F. Cox and M. A. A. Cox. Multidimensional Scaling. Chapman & Hall, London, 1994. [8] N. Cristianini and J. Shawe-Taylor. Support Vecor Machines and other kernel-based learning methods. University Press, Cambridge, 2000. [9] D. DeCoste. Visualizing Mercer kernel feature spaces via kernelized locally-linear embeddings. In The 8th International Conference on Neural Information Processing (ICONIP2001), Nov. 2001. [10] R. O. Duda, P. E. Hart, and D. G. Stork. Pattern Classification. Wiley-interscience, New York, 2001. [11] S. Fine and K. Scheinberg. Efficient SVM training using low-rank kernel representation, 2000. Research Report RC 21911, IBM T.J.Watson Research Center. [12] G. Fung and O. L. Mangasarian. Data selection for support vector machine classification. In Proceedings KDD2000: Knowledge Discovery and Data Mining, pages 64–70, Boston, MA, 2000. [13] G. H. Golub and C. F. Van Loan. Matrix Computations, third edition. Johns Hopkins University Press, Baltimore, 1996. [14] A. G. Gray and A. W. Moore. ‘N-body’ problems in statistical learning. In Advances in Neural Information Processing Systems (NIPS), pages 521–527, 2000. [15] T. Joachims. Making large-scale SVM learning practical. In B. Sch¨olkopf, C. Burges, and A. Smola, editors,
[20]
[21]
[22]
[23]
[24]
[25]
[26]
[27]
[28]
[29] [30]
Advances in Kernel Methods - Support Vector Learning, pages 41–56, Cambridge, 1999. MIT-Press. I. T. Jolliffe. Principal Component Analysis. SpringerVerlag, New York, 1986. H. Kim, P. Howland, and H. Park. Text classification using support vector machines with dimension reduction. In M. W. Berry and W. M. Pottenger, editors, Proceedings of the Workshop on Text Mining SIAM Third International Conference on Data Mining (SDM03), pages 48–59, 2003. H. Kim and H. Park. Prediction of protein relative solvent accessibility with support vector machines and long-range interaction 3D local descriptor, 2003. Proteins: Struct. Funct. Genet., to appear. H. Kim and H. Park. Protein secondary structure prediction based on an improved support vector machines approach, 2003. Protein Eng., to appear. Y. J. Lee and O. L. Mangasarian. RSVM: Reduced support vector machines. In Proceedings of the First SIAM International Conference on Data Mining, Chicago, 2001. SIAM. S. Mika, G. R¨atsch, J. Weston, B. Sch¨olkopf, and K. R. M¨uller. Fisher discriminant analysis with kernels. In Y. H. Hu, J. Larsen, E. Wilson, and S. Douglas, editors, Neural Networks for Signal Processing IX, pages 41–48. IEEE, 1999. E. Osuna, R. Freund, and F. Girosi. Support vector machines: Training and applications. Technical Report AI Memo 1602, MIT A.I. Lab, 1997. C. Park and H. Park. Kernel discriminant analysis based on the generalized singular value decomposition. Technical Report 03-017, Department of Computer Science and Engineering, University of Minnesota, 2003. S. T. Roweis and L. K. Saul. Nonlinear dimensionality reduction by locally linear embedding. Science, 290:2323– 2326, 2000. B. Sch¨olkopf, A. Smola, and K. R. M¨uller. Nonlinear component analysis as a kernel eigenvalue problem. Neural Computation, 10(5):1299–1319, 1998. A. Smola and B. Sch¨olkopf. Sparse greedy matrix approximation for machine learning. In Proc. 17th International Conf. on Machine Learning, pages 911–918. Morgan Kaufmann, San Francisco, CA, 2000. N. A. Syed, H. Liu, and K. K. Sung. Incremental learning with support vector machines. In Proceedings of the Workshop on Support Vector Machines at the International Joint Conference on Articial Intelligence (IJCAI99), Stockholm, Sweden, 1999. N. A. Syed, H. Liu, and K. K. Sung. A study of support vectors on model independent example selection. In Proceedings of the Fifth ACM Conference on Knowledge Discovery and Data Mining, pages 272–276, 1999. V. Vapnik. The Nature of Statistical Learning Theory. Springer-Verlag, New York, 1995. V. Vapnik. Statistical Learning Theory. John Wiley & Sons, New York, 1998.
[31] C. K. I. Williams and M. Seeger. Using the Nystr¨om method to speed up kernel machines. In T. K. Leen, T. G. Dietterich, and V. Tresp, editors, Neural Information Processing Systems 13. MIT Press, 2001.