redundant from the perspective of monitoring the server e.g.. Dedicated, ..... Notifications. Dispatcher. SMS,. Mail. Data Aggregation and. Summarization classes.
Data Tagging Architecture for System Monitoring in Dynamic Environments Bharat Krishnamurthy, Anindya Neogi, Bikram Sengupta, Raghavendra Singh IBM India Research Lab, 4 Block C, ISID, Vasant Kunj, New Delhi 110070, India {bharat.kris, anindya_neogi, bsengupt, raghavsi}@in.ibm.com
Abstract—Large enterprise systems need continuous monitoring at infrastructure, application and business levels to detect and prevent problem situations. Traditionally, automated monitoring solutions are programmed once at setup based on a set of welldefined monitoring objectives and handed over to the operations team. Such solutions have underlying data models that are often complex and semantically rich but in stable environments, this complexity is generally hidden from the operations team, who only need to make minor configuration changes (e.g. setting thresholds) as and when required. However, the situation is now rapidly changing with enterprise data centers being subject to continuous transformations as new software, hardware and process components get deployed or updated. This puts an immense burden on monitoring activity because not only thousands of different parameters need to get monitored but the addition and modification of service level objectives (SLOs) may happen continuously. We describe a monitoring system architecture which simplifies the task of authoring and managing SLOs in such dynamic and heterogeneous environments. At the heart of our approach is a lightweight and extensible data model that is derived from more complex configuration models, so as to only expose data relevant for monitoring to the operations team. Simple string-tags derived from this model are then used to label SLOs and associated data streams. The approach localizes programming to the data-sensor layer and makes authoring simpler than the specification of objects in an alternate richer but complex object-oriented representation. We also describe a tag-driven real-time visualization tool that can organize data streams using their accompanying tags and ease user navigation through large volumes of monitoring data. Keywords- Monitoring; Information Modeling; Management; Visualization
System
I. INTRODUCTION ENTERPRISE systems consisting of servers, storage, databases, networking equipment, applications etc. are hosted at one or more data centers. Monitoring of such data centers is done either on-site or from a remote command center. Monitoring various parameters of the entire IT system is the key to efficient management of a data center environment. The monitoring system collects raw data and processes it to generate basic events or aggregated data that is consumed by different management applications. Though each IT component is often packaged with open monitoring interfaces and tools, e.g., a database server or a network element will
have published APIs for querying its performance metrics and/or some associated console for viewing and operating on the data, a monitoring system is required to integrate and process the data collected from heterogeneous sources; in the absence of which, administrators need to watch individual consoles, integrate the data manually and process it to generate alerts or perform some analysis. A monitoring objective is a specification that defines how to collect a data stream, process it, and generate a type of event or an aggregated data stream. Monitoring objectives are also referred to as “Service Level Objectives” (SLO) while a “Service Level Agreement” (SLA) is viewed as a possible composition of multiple SLOs. However, all SLOs need not participate in SLA evaluation as SLOs may be created purely for internal monitoring. Given a set of well-defined monitoring objectives, a monitoring system is typically configured or programmed once at setup before handing it over to the operations team. Minor configuration changes, such as thresholds, alert recipients etc. may be done by the operations team. However in dynamic environments resulting from corporate acquisitions, mergers, strategic outsourcing of IT service management etc., monitoring objectives cannot be frozen at setup but need to be specified on a continuous basis as new applications or hardware are deployed, or updates and transformations are made. It has been our experience that in many service-provider environments, operations personnel lack sufficient knowledge and skills to use or extend complex data modeling standards, such as Common Information Modeling (CIM) [10], and as such, find it difficult to properly categorize monitoring objectives using an intricate web of classes and associations. For example, an operations personnel wanting to measure the utilization of a new disk partition created during operations, can write the script to measure the utilization. But, typically she does not know how to integrate the data in the monitoring system or configure some existing alert generation logic, because that requires a deeper understanding of the existing data models and standards. For this reason, it is necessary to design an alternate data model representation that substantially eases the definition and management of SLOs in dynamic data center environments. In this paper, we report on the design and implementation of a SLO authoring and monitoring system which has been built around such a data model representation. The system is called
978-1-4244-2066-7/08/$25.00 ©2008 IEEE Authorized licensed use limited to: National Taiwan University. Downloaded on May 03,2010 at 10:58:03 UTC from IEEE Xplore. Restrictions apply.
395
Model Driven Monitoring System (MDMS). MDMS is actually deployed at two large data centers and used by the operations staff as their primary monitoring tool. Our data model has two parts, the structured part that uses standard system configuration and monitoring specifications, to allow standard processing to be automatically performed on the monitoring data. The second part is the unstructured part that allows any additional “information” not represented by the structured part to be modeled statically or at runtime. The structured and unstructured parts are both represented by strings and the overall representation of our data model is thus a simple concatenation of these annotation strings or tags. This allows easy authoring of SLOs. Let us take the example where an operations team member wants to measure the utilization of a disk. In this case, the structured data types taken from higher-level CIM classes may be SystemResource, ComputerSystem etc. Each of these types, also called meta-data, provides meaning and context to the measured data, e.g., they identify the system component and the machine that the data is being collected from. At some point the operations personnel decides to monitor a specific disk partition’s utilization and wants to also record the partition names along with the utilization values. If the partition type is not present in the pre-created structured data model, then in our model it can be supplied as an unstructured free text and the partition name could be generated at run-time using the monitoring script or program. The goal is to balance the benefits (e.g. uniform interpretation) of well-defined taxonomies like CIM with the ease of use that free text descriptions offer. Our approach has been motivated by the observation that a dynamic data center environment, where the infrastructure keeps evolving and the operations team has limited understanding of complex taxonomies, displays many of the general characteristics (e.g. unstable entities, amateur users) of domains where pure ontological classifications do not work well [14]. While the focus of MDMS is on simplifying SLO authoring and basic data collection/aggregation, our model allows higher-level modules to be easily plugged into the system to consume the data and perform various analytics. One such higher level module that is described in this paper is the visualization component of the MDMS system. The “dashboard” provides an integrated console to view all measured data and events. The data types are used to customize the views and organize the data in a hierarchical manner, e.g., the user can group the data by server, within each server by metric, and within each metric by partition name and so on. Note that while MDMS is able to understand and interpret structured tags, it relies on the higher layer analysis modules, which are often written by experts, to apply text analysis techniques to interpret unstructured tag semantics. Accordingly, we are implementing text analysis algorithms in the dashboard to interpret the unstructured tags. The rest of the paper is organized as follows. Section 2 details the data tagging scheme and the tag representation. Related products and research work are discussed in Section 3. Section 4 describes the overall system architecture built
around data tagging. Section 5 discusses an MDMS deployment case study. Section 6 shows how a tag-driven visualization tool simplifies data navigation in large repositories. Section 7 concludes the paper with a summary and discussion of future work. II. DATA MODEL AND REPRESENTATION In this section we describe how a data model is created, represented, and used in the MDMS system. Our choice of data model and representation were guided by practical considerations such as the dynamic nature of data center environments where MDMS was to be deployed and ease-ofuse by the operations systems personnel. A. Complexity in dynamic environments We first explored the possibility of implementing our monitoring solution on top of a CIM data model. CIM (Common Information Model), developed by the DMTF Working Group [10], provides a common definition for a wide range of managed elements (including systems, networks, applications and services) enabling exchange of semantically rich management information between systems in a vendorneutral manner. CIM is based on a hierarchical, objectoriented format designed to track and depict complex interdependencies and associations between different managed elements. Several vendors are now enabling support for CIM in their management solutions. In stable environments, a CIM repository containing a complete model of the infrastructure may be set up at the onset. A monitoring solution, designed to interface with this repository, may then be programmed to handle a set of welldefined monitoring objectives, before being handed over to the operations team. Subsequently, minor configuration changes may be done by the operations personnel, and as long as the underlying infrastructure remains stable, the complexity of authoring new objectives may be hidden from the operations team through appropriate interfaces to the CIM infrastructure repository. However, in dynamic environments undergoing transformation, infrastructure evolves rapidly along with the addition and modification of monitoring objectives. Faced with the task of prototyping a systems management solution for such environments, we noted that operations personnel in general lacked sufficient knowledge and skills to use or extend complex data models like CIM. Consequently, as infrastructure evolved, there was a substantial barrier in keeping the CIM data model up-to-date and in authoring new SLOs based on this model. What was needed then was a monitoring solution that was lightweight, intuitive to program and fast to deploy, and that could be readily used by the operations team till the environment stabilized and more heavy-duty management solutions could be introduced. These requirements motivated the trade-offs we made in moving from a rich object-oriented approach like CIM with detailed infrastructure classes and associations, to an alternate lightweight semantics using simpler classes and implicit 396
Authorized licensed use limited to: National Taiwan University. Downloaded on May 03,2010 at 10:58:03 UTC from IEEE Xplore. Restrictions apply.
associations in the form of string tags. We explain this approach below. B. A simplified data model In a specific engagement, the customer supplied the system configuration data and monitoring requirements as relational databases, spreadsheets and semi-structured text files. In the first step, we examined this infrastructure data (manually) to determine the corresponding CIM classes. We are building a tool that semi-automates this process by searching for typical class instances in the input data, and can lead to significant reduction in the human effort required in determining the CIM class instances. Description of the tool, however, is beyond the scope of this paper. While CIM classes represent domainindependent semantics, part of the data model may be created for a specific domain. For example, in a Telecom engagement, concepts common to the Telco domain in terms of specific applications, metrics or infrastructure setups are modeled as the domain-specific part of the monitoring data model. Once the data model is defined, SLOs need to be configured to satisfy the monitoring requirements and the semantics of collected data or generated events needs to be associated by a human. For example, a system administrator has to configure a data sensor to collect some specific kind of monitoring data stream and describe what the data means. The CIM classes identified in the previous step may be used for this purpose, but with some simplifications. First, many of these classes contain an extensive set of attributes that are useful for capturing detailed configuration information about the corresponding system entities, but are often redundant from the perspective of monitoring these entities. For example, a very typical monitoring requirement in a data center is to periodically check the availability of a server. In this case, the server name (say, “server1”) and the metric name (“availability”) constitute necessary and sufficient descriptors of the monitoring result (available/unavailable) generated by a probe trying to ping the server. There are CIM classes corresponding to metric and server (CIM_BaseMetricDefinition and CIM_ComputerSystem), which have name attributes. However, there are also several other attributes that are redundant from the perspective of monitoring the server e.g. Dedicated, ResetCapability etc. of CIM_ComputerSystem, which we leave out. Second, a managed element may be distinguished not only by its own attributes, but also by its associations. For example, to refer to a process proc1, we may not only want to use its name, but also the server it is running on. To reduce the burden of defining and maintaining these associations, we allow users to simply include as many attributes across different classes as they feel is necessary to fully describe the monitoring context. These attribute values captured in the form of string tags are then concatenated to generate the entire semantic context of the SLO measurement. As an example, let us assume that the user wants to monitor the disk utilization on a server to throw alerts when the
utilization exceeds a certain threshold. Say, the tag values specified by the user for the collected data are utilization, disk, and server1, which are instances of types BaseMetricDefinition, SystemResource, and ComputerSystem, respectively. The individual tags associated with a monitoring specification are concatenated to provide a concise string representation of the data semantics. For example, the set of tags in the above example are concatenated to form the string: ‘20 for 30 minutes, notify John Kifer”. Note that if, instead of queue size, the objective was to monitor availability of a process, then a one-dimensional (time-based) escalation matrix would have been generated. An objective enters into a problem phase, identified by a unique problem identifier associated with the event, when it first enters the escalation matrix, i.e. one of the bad states. Alerts are generated at matrix entry and exit and, also whenever transitions are made from one cell to another. Logical contact groups keep getting added, or deleted, to the set of logical notification groups for an event as transitions are made to higher escalation, or lower escalation, levels respectively. Finally, when the objective makes a transition out of the escalation matrix, i.e. into ‘good’ state, the problem identifier is closed and the existing set of logical notification groups is contacted and contacts in this group are alerted of the closing of event. Configuring sensors: The authoring tool greatly eases the task of configuring sensors for an objective. The tool presents the existing sensor classes to the user, and once a selection has been made, it can query the corresponding provider and collector classes using reflection, and present templates to the user to configure the sensor. Once an objective has been configured using the authoring tool as described above, the system will automatically pick up the objective, instantiate a sensor for it, configure the event generation and notification capabilities of the server for this objective, and set up topics on the publish-subscribe cluster using which the sensor and the server can communicate.
400 Authorized licensed use limited to: National Taiwan University. Downloaded on May 03,2010 at 10:58:03 UTC from IEEE Xplore. Restrictions apply.
V. MDMS DEPLOYMENT We have successfully deployed MDMS at a very large data center undergoing rapid transformation. A second deployment is in progress at the time of this writing. The system has been in operation at the first data center for over 12 months. The objectives have been configured by low skilled operations staff using the MDMS authoring tool and a pre-created tag dictionary. Occasionally tag types and tag strings have been contributed in the dictionary when existing ones have been found insufficient. Analysis of the SLO tag values in the first deployment reveals 18 types of metrics, 45 applications and 500+ servers. As would be expected in monitoring engagements, availability of machines is the most common property that is monitored (around 21% of SLOs), while utilization and latency related metrics are also very common. However, the contexts of these monitored metrics, represented by rest of the tags such as application or server, vary widely. The distribution of SLOs by application context is quite skewed, with only 6 of the 45 applications accounting for 52% of the SLOs. The SLO distribution across servers is, however, more even, with the top 7 servers accounting for only 9% of the SLOs. The tag types and values used in a MDMS deployment thus provide a useful index into the overall span of the monitoring activity as well as the relative importance of individual infrastructure elements from the service level perspective. Tags also help to slice and dice the data along various dimensions to generate informative views as shown in Section VI on tag-driven visualization. However, organized views may not suffice given the large volume of event notifications. One needs sufficient labor cost to handle even 1600 events per day. In Section VII we also describe ongoing analysis on tagged events to reduce the large volume of events to a smaller number of problem situations. Experiments: The following overhead related experiments were performed in an actual data center deployment of the MDMS system. The MDMS Server is hosted on an IBM p 9113-550 with 16GB of RAM and 4 CPUs running at 1.6 GHz each. At the time of the measurements close to 1500 SLOs were configured to monitor around 500 servers. The average CPU utilization for the server component, consisting of 3 Java processes each handling around 500 SLOs, was found to be 6.14% and the memory utilization was 4.95%. The agent measured was configured to handle 235 objectives. The average utilization of this agent was 0.9% of CPU and 1% of the available memory. The utilization measurements do not include the actual running of the code that performs the data sensing and processing activity at the agent but the overheads of agent itself to support the operation of the configured sensors. The system at this stage generated over 1600 automated event notifications besides collecting over 500,000 data samples per day. VI. TAG DRIVEN VISUALIZATION In this section we describe the MDMS dashboard and show how it utilizes the tags described previously to systematically organize and present the monitoring data. The tags corresponding to a data item attach meaning to the data;
different elements of the tag provide different contexts in which the data was measured. Users of the dashboard can use the contexts to group data and customize their views.
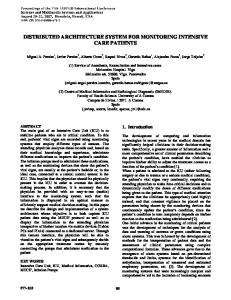
Figure 5: Dashboard tag hierarchy selection
Fig. 5 shows the default view of the dashboard application. The default view allows the user to select meta-data that the data should be grouped by. Selection of multiple meta-data leads to nested grouping in the specified order. In the example shown in Fig. 5 the user has selected the meta-data, LOB, service, location, application, server, and metric, in that order of nested grouping. The actual tag instances are CreditCards for LOB, Billing for service, and EMEA, AP, US for location. The applications being monitored are PrintBill and Rating, while jupiter, neptune, ganga, etc. are servers. Finally qsize/db, availability/process, utilization/cpu are instances of metric. In the example, the metric data is grouped by server, then applications, locations, services and finally line of business. Once the meta-data has been selected and ordered, the default view presents the corresponding tags in a hierarchy, or tree. This is called a context hierarchy. Different selections and ordering of the meta-data tags would result in different context hierarchies. Reorganization of the context hierarchy to get different views of the data can be done in real-time using the tags associated with the data. The dashboard can also present the data in a tabular manner by mapping the above tree to a nested spreadsheet structure, which is a more comfortable option for many operations people. In the dashboard, data is associated with each level of the hierarchy. While the leaf data is always the measured data, i.e., data from the monitoring system; the data at a higher “node” in the tree could be measured data or aggregated data. In the example, of Fig. 5, the data at the node jupiter could be an aggregation of the metric data corresponding to the measurements of availability/process, availability/connectivity, qsize/db, utilization/cpu and qsize/os. The user could supply aggregation functions, or there could be built-in 401
Authorized licensed use limited to: National Taiwan University. Downloaded on May 03,2010 at 10:58:03 UTC from IEEE Xplore. Restrictions apply.
functions that could aggregate by doing simple operations like union, intersection, addition etc. The dashboard can interpret the type and use inbuilt intelligence to decide the aggregation operations, e.g., the dashboard would do a union of the five data streams in the above example. Currently, the tag-driven real-time dashboard is available on vanilla Java as well as Tivoli Business Systems Manager (TBSM) platforms [17]. Let us take a few examples to explain the use case scenarios of the dashboard. In a data center environment different users have different roles and thus need different views on the data being collected, e.g., a business executive would be interested in the performance of her line of business, while a data center operator would be interested in the minute operational details of a server. In the dashboard, the business executive can select the LOB tag at the root of the context hierarchy and would get a summary of the performance of all applications and infrastructure in her line of business. In contrast, a data center operator managing servers would group data by the server tag and hence view all metrics associated with the servers. A data center operator responsible for storage across the entire operation will group by a storage metric and hence in one screen, view the storage across all servers and be alerted to any events in the storage. As stated earlier, given the type of the data the dashboard can chose from among a set of inbuilt aggregation functions. For example, for the metric utilization/storage, the dashboard would aggregate across all servers by finding the average storage usage utilization over all servers. Though the above discussion has focused on selecting structured meta-data to customize views, the idea can be extended to the unstructured tags also. We are currently developing an algorithm to interpret the unstructured information and infer meta-data. These inferred meta-data can be used then to group data much like as described previously. The important feature of our unstructured data is that it is accompanied by structured data that not only constraints the “similarity matching” that can be done on it, but also provides an “index” into a system management ontology which can be then be used for interpreting the unstructured data. This can be done using modifications of standard unstructured information management algorithms [13]. VII. CONCLUSION AND FUTURE WORK In this paper we described a monitoring system that uses a hybrid data model consisting of structured and unstructured parts to describe the semantics of monitoring data and events. The representation of data semantics is in terms of string tags. The benefit of using the tagging architecture is that the authoring of specifications becomes simpler and more intuitive for operations people who are less skilled in complex object-oriented data models. We also described a sample visualization application that uses the string tags to organize real-time views of the data. We plan to build tag-based reusable monitoring ontologies for various domains through actual MDMS deployments. This will further ease the programming of a monitoring solution and thus reduce the deployment time in a new environment.
We are also exploring both online and offline analysis of tagged events for better event management and notification in MDMS. On the one hand, pre-defined rules defined on tags may be used to filter and/or correlate events in real-time, based on known relationship between tag values. On the other hand, offline analysis of event tags can be used to learn relationships. The core problem is to create topology preserving maps from the high dimensional tag space to 2 or 3 dimensions and reveal relationships between various events. This can be used to improve event visualization and notification about high level problem situations. REFERENCES [1] [2] [3] [4] [5] [6] [7] [8] [9] [10] [11] [12]
[13] [14] [15]
[16] [17] [18] [19]
Network Monitoring Tools. http://www.slac.stanford.edu/xorg/nmtf/nmtf-tools.html#app Website Monitoring. http://www.webmetrics.com/ Performance and Availability Monitoring http://www.mercury.com/us/products/business-availability-center/enduser-management/ Tools for Database, Application and Windows Management. http://www.quest.com/foglight/ Business Intelligence from Business Objects. http://www.businessobjects.com/ Business Intelligence and Performance Management Software Solutions from Cognos. http://www.cognos.com/ HP OpenView, http://h20229.www2.hp.com/ IBM Tivoli, http://www-306.ibm.com/software/tivoli/ Enterprise Systems Management Solutions from CA. http://www3.ca.com/solutions/Solution.aspx?ID=315 DMTF – Common Information Model (CIM). http://www.dmtf.org/standards/cim/ OWL Web Ontology Language. W3 Recommendation, 2004. http://www.w3.org/TR/owl-features/ Folksonomies – Cooperative Classification and Communication Through Shared Metadata. A. Mathes, University of Illinois UrbanaChampaign, 2004. http://www.adammathes.com/academic/computermediated-communication/folksonomies.html Unstructured Information Management Architecture. http://www.research.ibm.com/UIMA/ Ontology is Overrated: Categories, Links and Tags. C. Shirky, 2005. http://www.shirky.com/writings/ontology_overrated.html Knowledge Base Maintenance Using Knowledge Gap Analysis. S. Spangler and J. Kreulen. Proceedings of 7th ACM SIGKDD International Conference on Knowledge Discovery and Data Mining, pp 462-466, 2001 Mining Log Files for Data-Driven System Management. W. Peng, T. Li and S. Ma. ACM SIGKDD Explorations Newsletter, Volume 7, Issue 1, pp 44-51, June, 2005 TBSM, http://www-306.ibm.com/software/tivoli/products/bus-sys-mgr/ Reflections on Java Reflection http://www.onjava.com/pub/a/onjava/2007/03/15/reflections-on-javareflection.html Extending the Common Information Model for Incorporating Semantics and Ontology-Based Reasoning in the Specification of Security Policies. G. Martinez Perez, F. J. Garcia Clement et al. , Proceedings of the 12th Workshop of the HP OpenView University Association, 2005
402 Authorized licensed use limited to: National Taiwan University. Downloaded on May 03,2010 at 10:58:03 UTC from IEEE Xplore. Restrictions apply.