I. J. Computer Network and Information Security, 2015, 11, 20-36 Published Online October 2015 in MECS (http://www.mecs-press.org/) DOI: 10.5815/ijcnis.2015.11.03
Data Traffic Modeling During Global Cyberattacks Volodymyr Mosorov Department of Computer Science in Economics, University of Lodz, Poland Email:
[email protected]
Andrzej Kosowski Institute of Applied Computer Science, Lodz University of Technology, Lodz, Poland Email:
[email protected]
Roman Kolodiy Department of Telecommunications, Lviv Polytechnic National University, Lviv, Ukraine Email:
[email protected]
Zenoviy Kharkhalis Department of Telecommunications, Lviv Polytechnic National University, Lviv, Ukraine Email:
[email protected]
Abstract—The article analyses the possibilities and techniques of modeling global cyber-attacks on an internetwork of small countries. The authors study the Distributed Denial of Service (DDoS) attack against Estonian internetwork, which took place in 2007, in an open-source Nessi2 simulator environment, as DDoS appears to be the most common type of informational attack on resources used todeay. Such a modeling can be replicated with a certain degree of accuracy because the most of powerful attacks have been relatively welldocumented. The article covers the most lifelike attack scenarios accomplished by sophisticated modeling of underlying traffic cases. Conclusions drawn from the simulation show that even large-scale DDoS attacks can be successfully modeled using limited resources only. Future research directions, motivated by the research, underlying this article, are highlighted at the end.
emergence will proceed undoubtedly, requiring new counteraction methods development. Main types of attacks are relatively well studied. However, various approaches to attacks classification are of interest. In [1] attacks are classified by the protocols by means of which they are performed. The following attacks are outlined: SYN flood, TCP reset, ICMP flood, UDP flood, DNS request, CGI request, Mail bomb, ARP storm and algorithmic complexity attacks.
Index Terms—Denial-of-Service attack, network simulator, data traffic, attack modelling, attack scenarios.
I. INTRODUCTION Today there are many different types of Denial-ofService attacks, each of which uses a certain feature of network topology or software vulnerability. For instance, attacks can be performed by sending a huge amount of data packets (SYN, UDP, ICMP flood), intermediate nodes exploitation (Smurf, Fraggle), sending very long packets (Ping of Death), incorrect packets (Land) or a very big quantity of labor consuming request. It is worth noticing recent rapid development of these directions and appearance of new types of attacks. The most significant of the latest tendencies are Quality Reduction Attacks and Low Rated Attacks, and the process of new attack types Copyright © 2015 MECS
Fig.1. Denial-of-Service Attacks Classification. Prolexic Technologies
An attacks classification by execution technique was proposed in Prolexic Technologies whitepaper (Fig. 1). Three types of attacks were outlined: Targeted attacks (protocol drawbacks, application vulnerabilities are used); Consumption attacks (system resources consumption); Exploitative attacks (code errors and vulnerabilities are used);
I.J. Computer Network and Information Security, 2015, 11, 20-36
Data Traffic Modeling During Global Cyberattacks
Because the impact of a DoS attack is usually amplified if more than one machine participates in the attack, performing the most powerful attacks might require using a large number of hosts. An attack employing multiple machines simultaneously is referred to as a distributed denial-of-service attack or a DDoS. DDoS is a powerful mechanism not only because more participating machines can generate more attack traffic, but also because an entire collection of attackers, sometimes on multiple networks, is much harder to take down or cut off from a victim’s perspective. Firstly, they appear to have the biggest infrastructural requirements and require coordinated, simultaneous effort to be effective on the scale desired to impact the majority of a victim country, territory or corporation. Such
21
requirements can only be met with significant resources, often associated with powerful organizations and governments. Secondly, in the most notable cyberattacks of the 2013 year – the Spamhaus attacks, the NASDAQ attacks and the Prolexic attacks – DDoS was the primary asset. Thirdly, in these attacks DDoS has proven to be very powerful and debilitating for the victim. These three reasons provide solid grounds to believe that a strategic, large-scale DDoS attack on core network elements will be the tool of choice in at least some of the future military cyber conflicts. The work [2] was dedicated to Distributed Denial-ofService attacks classification research. A scheme representing a brief over watch of the topics presented in the work is shown on fig. 2.
Fig.2. Denial-of-Service Attacks Classification
Because of the impact of DDoS attacks on both institutions and individuals using internetworks, some of the most powerful attacks have been relatively welldocumented and attack techniques can be replicated with a certain degree of accuracy. This allows for both analyzing the process of a successful attack and designing methods of defense and prevention. Constructing a private network with a purpose of performing DDoS attacks or operating every single machine participating in the attack manually requires significant resources and manpower. This is why all wellknown DDoS attacks originated from a set of compromised hosts, property of often unaware institutions. Remote control over such hosts can be obtained with malware such as worms or Trojan horses. A collection of compromised hosts under a common command and control is referred to as a botnet (roBOT NETwork [3]). Using botnets, the attack perpetrators can avoid the cost of machines, bandwidth and administration required to perform a DDoS attack, by simply using someone else’s infrastructure and resources (Fig. 3). Largest known botnets consisted of multiple millions of compromised hosts for instance Mariposa botnet. Building or otherwise obtaining a botnet has become one of the essential stages for preparing a successful DDoS. There is a multitude of methods of performing a DDoS attack and there are different immediate goals that such an attack can serve, ranging from temporary disabling access to a website up to permanently damaging network Copyright © 2015 MECS
infrastructure and hosts. One thing in common is that DDoS attacks employ large numbers of hosts. The aim of this article is to thoroughly analyze the possibilities and techniques of performing strategic cyberattacks on an network infrastructure of small countries.
Fig.3. Classic Distributed Denial of Service. Command And Control Server Issues Instructions To Compromised Host Network (Botnet) Which Then Flood Selected Victims With Traffic. Varying Thickness of Arrows Representing the Attack Traffic, Symbolizes Different Amount of Attack Traffic Generated By Each Compromised Host [4, 5]
II. STAGES OF A STRATEGIC DDOS ATTACKS On principle, a DDoS attack can be launched just by manually executing a repetitive echo command on at least
I.J. Computer Network and Information Security, 2015, 11, 20-36
22
Data Traffic Modeling During Global Cyberattacks
two different systems as long as they share a victim. This basic form of cyberattack can be performed by untrained users and has actually been successfully employed during both Georgia (2008) and Estonia (2007) incidents. Obviously, such an attack requires nearly no preparation at all, but is also resource-intensive, with O(n) type complexity in terms of required number of hosts. Moreover, a slow-rate ping flood originating from a small number of IP addresses is easy to repel with ingress filtering once the condition is recognized. These are the two reasons why a victim network of a strategic DDoS serviced continuously by professional security staff requires a different approach. To perform a strategic DDoS attack with high success probability, a planning phase is required. Although recent attacks on Estonia and Georgia were somewhat chaotic in nature, they both employed previously obtained attack resources and were, to some degree, coordinated. They did, however, exhibit several characteristics of grassroots movements. Assuming that an organization is planning a DDoS attack, it cannot rely on spontaneous society support and needs to implement a model different to Estonia and Georgia attacks, directing the attack during the two key phases: attack preparation and attack execution. Flood attacks are going to be the focus of this article. The reason for this is that application level attacks and DDoS attacks aimed at corrupting configuration, while viable tools for service denial, are based on exploits. The nature of these exploits determines how the attack is received, and are therefore a proper subject of analysis. Analyzing a DDoS attack in its purest form needs to be performed with flood attacks. A. Attack preparation Engineering a DDoS attack is, for the most part, not very different from preparing any other type of cyberattack. The target’s infrastructure is first analyzed (“footprinted”) and its weak spots identified. To perform a DDoS attack aimed at resource exhaustion, numerous hosts are required. If the attack is to be synchronized, with all hosts flooding simultaneously, a common command and control is preferable. Synchronization can be achieved manually. For example, during Georgia and Estonia attacks, some of the operations were scheduled for a particular date and time, which was then published on numerous community websites and other social communication platforms, such as IRC. This approach, however, requires a very large number of operators if the attack is to generate an overwhelming wave of traffic. It is important for DDoS attacks to instantly activate as many traffic generators as possible. Victim’s network management personnel, including the NSP, will commence with the countermeasures as soon as the attack pattern is identified. An initial wave that is not strong enough to ensure a service denial condition, but significant enough to alert the administrators might prevent the attack from succeeding at all or, at least, visibly reduce its impact. Thus, manual synchronization Copyright © 2015 MECS
of a DDoS attack on a well-protected, high-bandwidth network block, will require expensive human resources. Unless host hardware and network connection is already present, they require further investment. These two facts contribute to the common notion of using botnets in large DDoS attacks. Botnets solve both problems faced when manually coordinating every node participating in the attack. First of all, a single command and control allows for perfect, effortless synchronization of attack waves and fast adjustments to possible countermeasures. Secondly, it is usually assumed that a botnet, or a network of zombie computers, consists mainly of computers overtaken without the knowledge and against the will of its primary users. As long as these computers are corrupted through the network, it is safe to assume that any zombie is capable of sending traffic to future prospective victims. This means that both hardware and network connection are already provided to botnet commanders, which requires far less resources than constructing an entire attack network. Botnets have been used in all major DDoS attacks of the classic kind, i.e. similar to Stacheldraht or Trinoo. Apart from the aforementioned benefits, botnets offer a level of anonymity, being an intermediate layer between the attacker and the victim, impeding actual source tracking. Even more importantly, well-distributed botnets provide hosts assigned to IP addresses in different blocks of the address pool. This is an essential quality, as blocking traffic from a certain IP range is one of the most common and effective forms of response to a flood attack. Zombies residing in different blocks of the IP pool are much more difficult to filter out. In conclusion, using botnets, especially if their zombies are placed in different IP networks, is extremely advantageous: Botnets allow for perfect attack synchronization and fast response to defensive measures. Human resources for controlling a botnet are relatively small and inexpensive. Zombie computers provide the vast majority of hardware resources required for an attack, thus liberating the perpetrators from substantial hardware investments. Hosts corrupted through their network connections can use this connection to send malicious traffic. Botnet use introduces an intermediate layer between the victim and the perpetrator. Attacker’s real IP address is not directly traceable. Traffic sent by botnets consisting of hosts from numerous networks is more difficult to filter, as it originates in many different IP address ranges. Using botnets is therefore a technique far superior to crafting own attack networks unless very specific host requirements need to be satisfied. B. Attack execution After a thorough preparation phase, executing a DDoS flood attack is relatively quick and straightforward.
I.J. Computer Network and Information Security, 2015, 11, 20-36
Data Traffic Modeling During Global Cyberattacks
Traffic from the botnet at the attacker’s disposal is directed towards the victim, occupying various types of resources and disrupting or completely disabling a certain service. Executing an effective attack relies mainly on four parameters:
Quality of the botnet. Timing of the attack. Victim’s attack resilience. Response of the victim.
Quality of the botnet depends on its size and traffic generation capabilities as well as distribution of zombie computers on different IP pool segments, autonomous systems and geographical regions. The former variable reflects the crude destructive power of the botnet whereas the latter indicates how difficult it will be to defend against a flood from such a botnet. Good quality botnet traffic is notoriously hard to filter even temporarily, as there is no single IP range or prefix that filtering can be administered against. Timing of the attack, already mentioned in the previous section, may constitute the difference between a gradually increasing trickle of packets flowing into the victim’s network when all of its network security personnel is present both at the organization itself and all of participating NSPs and a sudden, unexpected avalanche of traffic storming the network when only a single security engineer remains on the premises of the organization and the NSPs or even is awake. Additional twist to this situation is that denying a service of a government agency website when only a small fraction of operations is being conducted (e.g. in the middle of the night or on a weekend) is not as harmful as at any other time. However, especially more potent servers and websites might operate continuously when providing service to users and customers in other time zones. For example, global e-commerce services such as Amazon or eBay are vulnerable to financial losses due to a DDoS at all times. C. The aftermath There are six possible ways a DDoS attack attempt may end after some initial time necessary to respond: No damage, attack unsuccessful or quickly contained. Attack successful, operations of the victim ceased and services disabled for a significant amount of time, no permanent damage. Attack successful, operations of the victim ceased and services disabled for a significant amount of time with permanent damage. Attack partially successful, operations of the victim disrupted, no permanent damage after the attack ends. Attack partially successful, operations of the victim disrupted with permanent damage after the attack ends. Copyright © 2015 MECS
23
Attack quickly contained, but some permanent damage done. Because inflicting permanent damage, e.g. “bricking” network equipment, is a rare occurrence and confined to the DDoS category, the three categories in bold are of main interest. It is also possible to eliminate the middle ground of victim’s operations only being disrupted (but not fully halted) as there is little practical difference between operations being significantly disrupted and stopped completely. Even if data packets are able to traverse the network at very slow speeds when a DDoS attack is occurring, timeout policies of IP networks will render any service unavailable because of limited time of content transmission. Using the same reasoning, there is little practical difference between operations being disrupted slightly and not at all, especially with standard user traffic also fluctuating over time. Therefore, the two definitive cases that need to be analyzed in DDoS response considerations are: Attack unsuccessful or quickly contained Attacked successful, operations of the victim halted until the attack stops.
III. GLOBAL DDOS ATTACK MODELING: ESTONIA CASE As of 2010, the attempts to simulate the behavior of a computer network rely on discrete-event simulators. The events can signify sending, transmitting or receiving a data unit belonging to one of the OSI model layers, e.g.: Network layer packets (IPv4, IPv6, ICMP, IGMP etc.). Transport layer segments (TCP, UDP etc.). Data link layer frames (Ethernet, ARP, PPP etc.). Layers 2-4 (data link, network, transport) fit the discrete-event simulation model especially well – data bits are grouped in clearly defined, delimited portions and there is little difference between such portions on a single layer, except, of course, the content. For very large-scale simulation of IP networks and internetworks such as the Internet, the network layer is particularly viable. This is because the backbone of large networks is composed of routers, which operate at network layer. End-to-end communication between hosts begins and is terminated at the application layer in order to provide content to users, but the intermediate network traffic does not exceed the network layer. A. Simulator selection There are numerous network discrete-event simulation applications and new ones appear every year. The list of most popular tools includes: Ns2, by far the most popular network simulator with over 100 thousand downloads of build 2.43 alone [6,7];
I.J. Computer Network and Information Security, 2015, 11, 20-36
24
Data Traffic Modeling During Global Cyberattacks
Ns3, the successor of ns2 [8]; Arena Simulation Software, whose plug-in variety includes network security-specific tools [9]; Packet Tracer, extensively utilized in Cisco certification courses [10]; GloMoSim, an academic-only tool, as of November 2010 only capable of simulating pure wireless networks [11]; QualNet, a commercial tool based on GloMoSim [12]; NetSim, used extensively by universities; also a commercial tool [13]; OPNET Guru software suite, designed to help plan and implement new networks [14]; GTNetS, a Georgia Tech-developed simulator [15]; NeSSi², an open-source network simulator focused on network security [16]. Only five simulators on this list are available free of charge – ns2, ns3, GloMoSim, GTNetS and NeSSi². Only four of those are open-source and allow for user modifications and extensions (ns2, ns3, GTNetS, NeSSi²). Simulating a large-scale DDoS attack requires the software to be able to handle extensive, complex networks at least in the range of thousands of devices. It is advisable for the software to operate on a layered architectural model, in order to confine smaller networks (such as corporate LAN networks) within container units. This approach allows the designer to fit even very large topologies on the screen and work on a single module at a time. NeSSi²is specifically designed for network security research (the name itself is an acronym of “NEtwork Security SImulator”). It is specifically built to handle large-network simulation due to its modular structure. Network generation can be done automatically, while still allowing for user modifications in generated networks. Similarly, behavior profiles can be assigned automatically, based on the type of the device, using regular expressions to match device name patterns. The user can even define the percentage of devices that will bear a specific behavior profile, which is then automatically assigned to random devices throughout the network, e.g. 75% of all mail servers in the network. Additionally, it is vital for the designer to be able to automate the simulation design process. While it is still comfortable to design networks and assign node behavior on the lowest level (single device) for networks of tens of hosts, it is a strenuous task for any network large enough to qualify as a powerful flood botnet (thousands or tens of thousands of hosts). Moreover, NeSSi² supports the parallel execution model, making it feasible for simulations with complex behavior on network nodes. While still providing traffic information on single devices, it also supplies global event statistics, in order to facilitate network behavior on a more comprehensive level. In conclusion, NeSSi²is a very good choice for simulating and analyzing large-scale DDoS attacks, followed closely by GTNetS, then ns2/ns3 and some commercial solutions (QualNET and OPNET). Copyright © 2015 MECS
As such, it will be employed to perform the simulations of strategic DDoS attacks and its features will be discussed in more detail in the next section. B. NeSSi²simualtion environment NeSSi² is an open-source simulation framework, developed on JIAC (Java-based Intelligent Agent Componentware) agent platform, first released in December, 2008 [17]. Similarly to ns2 and ns3, it is a discrete-event simulator. NeSSi²is capable of simulating network-layer IP-network traffic with some functionalities involving higher layers. As of November 2010, NeSSi² is still in beta phase, the most recent version (2.0.0-beta3) released on July 30, 2010. Simulations discussed in this thesis were obtained in its direct predecessor, version 2.0.0-beta2.1, released in October, 2009. All public versions of NeSSi² are available to download from its SourceForge repository at: http://sourceforge.net/projects/nessi2/ and the project’s home page is: http://www.nessi2.de/. Devices present in simulated networks are: Core networks and autonomous systems; Distribution and access networks. Additionally, the devices can be linked by four types of connections:
Fiber connections; Backbone connections; Access connections; LAN connections [18].
Upon linking any two devices, IPv4 addresses are assigned automatically to fit designed subnets. NeSSi² does not recognize special-use IP addresses defined by ICANN and IETF that are normally reserved for specific purposes or private networks [19]. This is manifested by addresses normally associated with private networks sometimes assigned to core router interfaces. However, since the network is only a theoretical manifestation of physical devices, IETF regulations are irrelevant in the simulations. Features of NeSSi² that are crucial for presented research: An easy to use and very obvious composition of a workspace which allows for designing large networks, as one icon in logical view can represent extremely complex physical topologies; Ability to automatically generate subnets of desired parameters, which are: number of routers, node’s degrees average bandwidths etc.; After completing a simulation, the results are presented in transient charts, with ticks as the time unit. Each chart represents a relationship between a number of events occurring and the time of simulation (see Fig. 4). Most events are easy to monitor on links, where the graphs can
I.J. Computer Network and Information Security, 2015, 11, 20-36
Data Traffic Modeling During Global Cyberattacks
represent the incoming or outgoing traffic. Additionally, NeSSi²discerns various types of events (e.g. TCP and UDP segments) and provides aggregated values (e.g. total number of packets sent). Chart visualization can be easily adjusted to display the desired types of events. The results of the simulation in the form of graphs can be used for a variety of analysis methods. For DDoS attack analysis, the most important question is whether or not the service is still provided by the device which receives the traffic wave. For this reason capacity limits need to be assumed for the network devices that are going
25
to be investigated. In the simplest example, a router-client traffic can be examined. In this case, the client is sending traffic at an average rate of 0.2 packets per tick, with the characteristic slightly deviating from a straight line and rising sharply in the final stage of the simulation (tick 950). With similar reasoning, it is possible to establish whether any limited resource had been exhausted on any device, identify bottlenecks and propose solutions preventing denial of service, even in the most complex internetworks.
Fig.4. Transient Event Graph: Screenshot of Nessi2 Simulator
more than 91% of processor cycles and 63% of physical memory unoccupied for NeSSi²to use.
C. Simulation platform All simulations and tests have been performed on a single Centrino Duo-based, 32-bit Windows Vista machine. Additional specifications are provided in Table 1. Table 1. Simulation Machine Specifications and Benchmark Notes Processor Intel Core Duo T2350 Processor clock 1862 MHz System type 32-bit Graphics card NVIDIA GeForce Go 7300 Memory 2 GB OS Windows Vista Physical/logical processors 1/2 Windows Efficiency Assessment 2.1 (composite) Processor 4.1 Memory 4.5 Graphics (Windows Aero) 2.1 Graphics (3D) 3.2 Hard disk drive 4.9 PCMark05 Benchmark Assessment Physics and 3D 58.22 FPS File decryption 17.85 FPS HDD – General Usage 4.27 MB/s
At the time of every simulation, the machine was running several applications (including Windows daemons, antivirus software and a text editor), leaving Copyright © 2015 MECS
D. Network design for simulation In order to analyze a DDoS attack with a network simulator, two questions need to be answered: What are the characteristics of the network that is the victim of the attack? What is the scenario of the attack? For the simulation to be as close to real-world events as possible, it can be modeled after existing or planned networks and, in case of post-factum analysis, previous DDoS incidents. A number of such incidents was previously mentioned. One of them, a landmark DDoS attack on the Estonian Internet of 2007 was the base for the simulation. The 2007 attack was one of the largest in history. With numerous government and corporate networks under attack, it effectively crippled the country’s electronic services. Furthermore, even at the time Estonia had a very advanced network development program and was often referred to as “the most wired country in Europe” [20]. It therefore exhibited characteristics of a modern, infrastructure-saturated region with great dependence on the national Internet. Some statistics concerning Estonian Internet use are presented in Table 2.
I.J. Computer Network and Information Security, 2015, 11, 20-36
26
Data Traffic Modeling During Global Cyberattacks
Table 2. Selected statistics of Estonian Internet usage [21]
background processes. Global assumptions for the simulation in NeSSi²:
1.34 million citizens 75% inhabitants using the Internet 67% households own a computer 91% of households with a computer are connected to the Internet 1160 Wi-Fi networks registered for public use 98% of banking transactions performed electronically
According to the map provided by Estonian security researcher Merike Kaeo for NANOG40, as of January, 2006, Estonian government network nodes have been placed in 16 cities, listed in Table 3. Their inhabitants represent a total of over 86% of Estonia’s urban population and the majority of its Internet users. Because the amount of data regarding sensitive network infrastructure is limited and because of the volatile, ever-changing structure of the Internet, it is impossible to gather all the details concerning a national network. Therefore, for the purpose of a software simulation, some assumptions regarding the network are required to complete the case outline. They are listed further and designed to ensure link redundancy, scalability and attack resilience of the designed infrastructure as well as to reflect actual network design guidelines applied by network engineers worldwide. It is important to consider that the behavior of a national network changes dramatically with time, especially during a 24-hour cycle. It is, therefore, very difficult to define behavior patterns for the network operating over a long (several hours) period of time, and any behavior pattern needs to be associated with a time frame. In this case study, the simulation is performed to represent a middle-of-the-day traffic (peak period), when the end devices generate the largest amount of traffic and are especially vulnerable to oversaturation. It is, therefore, assumed that 90% of web clients runs at least one application that generates WAN network traffic. Such applications need not be directly controlled by the user, as they also include automated patch downloads, virus definition upgrades, routing and DNS queries and other
Every access network is connected to at least one distribution network; Every distribution network is connected to at least one other distribution network or a core network; Every core network is connected to at least one other core network with a backbone connection; Every edge router is connected to at least one core router (mostly only one); Every core and distribution network is connected to at least two other networks; Most core routers are connected to at least two other core routers to provide core network redundancy; 90% of Web Clients are running at least one non malicious UDP or TCP application; Among all end devices, 80% are clients and the remaining 20% are dedicated servers; On average, the number of end devices is two times greater than the number of access routers (e.g. a typical access network with 10 routers contains 20 end devices). NeSSi²allows for very large-scale attack simulations, but it also requires powerful hardware to do so. After preliminary tests, the maximum possible number of devices that a mid-range system is capable of handling appeared to be in the range of ten thousands. This number includes all of the main elements of the network – every router, server and host present in the topology. The pool of ten thousand was split among nodes representing Estonian government network nodes (named after cities of residence) according to the population percentage. The split, although arbitrary to some degree, reflects the role of Tallinn as the main network node and can be treated as a qualified guess. Because of the confidential nature of government network infrastructure data and the enormous scope of the network, no detailed information is available to the public.
Table 3. Population Statistics of Estonian Cities with Major Government Network Nodes [22] Position by population (of all Estonian cities) 1. 2. 3. 5. 6. 7. 10. 11. 12. 13. 14. 15. 19. 20. 23. 29.
Copyright © 2015 MECS
City
Population (2010)
Population percentage among listed cities
Tallinn Tartu Narva Pärnu Viljandi Rakvere Kuressaare Võru Valga Haapsalu Jõhvi Paide Põlva Jõgeva Rapla Kärdla SUM
399340 103284 65881 44083 19963 16580 14977 14376 13692 11618 11088 9761 6554 6322 5630 3634 746783
53,47% 13,83% 8,82% 5,90% 2,67% 2,22% 2,01% 1,93% 1,83% 1,56% 1,48% 1,31% 0,88% 0,85% 0,75% 0,49% 100,00%
I.J. Computer Network and Information Security, 2015, 11, 20-36
Data Traffic Modeling During Global Cyberattacks
In smaller communities, such as Rapla or Haapsalu, with less than 12 thousand inhabitants, the number of core network routers was assumed to be the minimum (1), with a minimal degree of redundancy in the distribution layer (2-3 edge routers per core router). Communities up
27
to 20 thousand citizens were assigned two core routers with 2 edge routers per core router as well. Largest Estonian cities received gradually more core and edge routers with Tallinn boasting a sizeable 21-router core network (see Table 4).
Table 4. Number of Devices in Each Network out of The Pool of 10 Thousand City
Pop. (2010)
Pop. [%]
Tallinn Tartu Narva Pärnu Viljandi Rakvere Kuressaare Võru Valga Haapsalu Jõhvi Paide Põlva Jõgeva Rapla Kärdla SUM
399340 103284 65881 44083 19963 16580 14977 14376 13692 11618 11088 9761 6554 6322 5630 3634 746783
53,47% 13,83% 8,82% 5,90% 2,67% 2,22% 2,01% 1,93% 1,83% 1,56% 1,48% 1,31% 0,88% 0,85% 0,75% 0,49% 100,00%
Hosts (of 10000) 5347 1383 882 590 267 222 201 193 183 156 148 131 88 85 75 49 10000
Core
Distrib.
Access
21 6 4 3 2 2 2 2 2 1 1 1 1 1 1 1 51
70 15 10 6 4 4 4 4 4 3 3 3 2 2 2 2 138
5256 1362 868 581 261 216 195 187 177 152 144 127 85 82 72 46 9811
Because even the smallest towns required one core router with a full feature set (e.g. routing protocol set for WAN networks supported), their number of hosts per core router is relatively low (below 200). The need for redundancy in communities of over 12 thousand makes the same hold truth for cities less populous than 20000 inhabitants. As the city size increases, so does the number of access-layer devices per core devices. This increase is explained by economy of scale – providing a variety of redundant paths and increasing the size of a system makes it more efficient. Moreover, it can be assumed that network equipment in larger cities is more powerful and upgraded more frequently than in smaller ones. Within the performance limits of the simulation machine, it was possible to handle individual networks of up to 90 devices or slightly more. Managing a network of over a hundred devices resulted in a dramatic decrease in usability and greatly impeded layout clarity in generated access networks. With the assumption that on average two end devices correspond to a single access router, this number implies that the largest individual access networks in the topology should not drastically exceed the 30-router limit. On the other end of the spectrum, the maximum number of devices per access network in small cities ensures that the municipal network retains its modular character and a degree of redundancy. Therefore, even in the communities with less than 90 end devices on the access layer, multiple access networks appear. This also highlights the fact that it is a rare occurrence for a single NSP to manage all subscribers in a city due to market competition. From a designer’s perspective, the process of implementing Estonia’s government network model down to the distribution network layer included: Copyright © 2015 MECS
Acc. per distrib. 75,1 90,8 86,8 96,8 65,3 54,0 48,8 46,8 44,3 50,7 48,0 42,3 42,5 41,0 36,0 23,0 -
Distrib. per core 3,3 2,5 2,5 2,0 2,0 2,0 2,0 2,0 2,0 3,0 3,0 3,0 2,0 2,0 2,0 2,0 -
Access per core 250,3 227,0 217,0 193,7 130,5 108,0 97,5 93,5 88,5 152,0 144,0 127,0 85,0 82,0 72,0 46,0 -
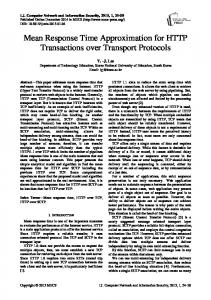
Fig.5a. Core network in Tartu with 6 routers
Fig.5b. Complete Core Topology of Estonian Government Network Implemented in NeSSi²Design
Placing the major core network nodes according to geographical placement;
I.J. Computer Network and Information Security, 2015, 11, 20-36
28
Data Traffic Modeling During Global Cyberattacks
Designing core networks in individual cities (e.g. Tartu, pictured in Fig. 5a); Connecting the core network nodes between Estonian cities according to the map provided by Kaeo (Fig. 5b); Adding distribution layer networks surrounding core network nodes in all cities. All stages required manual placement, connection and adjustment of nodes, as opposed to a more automated approach later in the process. After completing the network topology down to the distribution layer, the absent access networks have been created using the automatic generation tool. The process was governed by the following parameters:
As practice shows, a common access subnets topology is star (even though redundant links occur regularly). Number of routers is varying according to the number in Table 5. Node degree (the average number of connection a device has) is equal to 3. Average bandwidth between routers is 100 Mbps. Two end devices are connected to each access router. Statistically, 80% of end devices are clients and the remaining 20% are servers. Average bandwidth of an access link is also 100 Mbps.
Table 5. Number of Access Networks and Access Network Sizing in the Implemented Network City Tallinn Tartu Narva Pärnu Viljandi Rakvere Kuressaare Võru Valga Haapsalu Jõhvi Paide Põlva Jõgeva Rapla Kärdla
Access network devices 5256 1362 868 581 261 216 195 187 177 152 144 127 85 82 72 46
Number of access networks 70 15 10 6 4 4 4 4 4 3 3 3 2 2 2 2
Devices per access network 75,1 90,8 86,8 96,8 65,3 54,0 48,8 46,8 44,3 50,7 48,0 42,3 42,5 41,0 36,0 23,0
Due to poor performance on the available hardware platform, after completing the topology, the entire national network was reduced to the seven most significant government network nodes.
Fig.6. Estonian National Government Network Implemented in NeSSi² for Simulation
This network is visualized in Fig. 6. Importantly, seven selected core nodes encompass and represent the government network in six most populous counties of Estonia, jointly representing over 78% of the total Copyright © 2015 MECS
Routers per access network (33% of total) 25,0 30,3 28,9 32,3 21,8 18,0 16,3 15,6 14,8 16,9 16,0 14,1 14,2 13,7 12,0 7,7
Routers per access network (rounded) 25 30 29 32 22 18 16 16 15 17 16 14 14 14 12 8
population [24, 25]. It can be therefore regarded as a valid image of the Estonian government network and any other complex WAN network of similar properties. The first case showcases the possibilities of attacking an edge router, which is the sole agent responsible for maintaining the connection between the municipal network and the rest of the Internet. In this scenario, Edge Router 4 is the single point of failure for core-access connectivity and disabling it by performing a DDoS attack will result in the following: No device of the Pärnu municipal network will be able to obtain any content from or provide any content to any device outside of this municipal network. No device of the Estonian network outside of the Pärnu municipal network will be able to obtain any content from or provide any content to any device inside this municipal network. Any traffic within the municipal network that traverses the attacked router, for example as a result of load balancing due to congestion on other internal links, will not reach its destination. The second scenario is a UDP flood DDoS attack on a different type of network device – a web server. As
I.J. Computer Network and Information Security, 2015, 11, 20-36
Data Traffic Modeling During Global Cyberattacks
opposed to the router in the previous scenario, in general, servers are not directly responsible for maintaining connectivity (There are, however, special-purpose servers, which network connectivity depends on, for example DNS servers). Instead provide content and services to network users. Therefore, denial of service in case of a web server means simply that any services normally provided by the server are inaccessible to users. Although the attack is precisely engineered to only attack a single, critical server, congestion of links between major traffic generation nodes and the server may be a side effect of a server DDoS. Two types of victims are considered in this scenario: A web server connected directly to the edge router with no firewall protection. The same web server connected to the router through an intermediate hardware firewall. A large part of the analysis is based on comparing traffic charts obtained for different devices and portions of the network. An example of such chart is presented in Fig. 7. The graph illustrates the relationship between the number of events occurring on the link in time, which is represented by time units (ticks). A tick, possibly derived from the sound pendulum clocks produce, is the smallest possible increment of system time, defined differently for various operating systems and programming languages [26]. Both arguments and values are discrete, a standard approach in discrete event simulator NeSSi².The graph in Fig. 7 illustrates the transient characteristic of a link connecting a web client and an access router. As can be seen, five events are registered over the course of the simulation (1000 ticks). The graph actually shows two overlaid characteristics, one representing HTTP packets and one representing IP packets sent by the client. However, in this case the characteristics look exactly the same since HTTP and IP packets are the same data units,
29
only on different levels of encapsulation (layers). NeSSi² allows the user to manually adjust which characteristics are displayed with a simple checklist next to each obtained graph (not shown). In this particular case the web client was assigned a DDoS zombie profile, meaning it was targeting a single IP address and flooding it with traffic. The attack was configured to start at 500 mark, after which the client started flooding with average rate of 1 message per 100 ticks. Although this attack intensity may not seem overwhelming, it depends on what tick resolution is assumed for the simulation. For example, the POSIX time function uses tick equal to a whole second, which amounts to a traffic of just 0.01 packets per second (pps). However, on the Java platform, in which NeSSi² is implemented, the Nano Time function uses a tick of just one nanosecond, amounting to an astonishing traffic rate of 10 million pps or 10 Mpps, 2.5 times more than the entire network traffic flowing into Estonian networks during real-life cyberattacks of 2007 [27]. Nevertheless, since router and server capacity will also be expressed in events per tick, the actual exchange ratio is not necessary in the analysis, safe for ending conclusions. Coincidentally, the characteristic presented in Fig. 7 represents a zombie host that was used in all simulations as the malicious traffic generator. Because NeSSi²allows for automated behavior profile distribution, the exact same flooding pattern was common for all hosts participating in the attack. To review, its two main attributes are: Flooding starts at 500 mark (halftime of a standard simulation run). Malicious traffic rate is 1 event per 100 ticks. The only parameter changing for different simulations was the type of message – either an HTTP query or a UDP segment.
Fig.7. Attack Traffic Generated By One of the Compromised Web Clients
Copyright © 2015 MECS
I.J. Computer Network and Information Security, 2015, 11, 20-36
30
Data Traffic Modeling During Global Cyberattacks
E. Scenario I – Edge router attack The first scenario simulated in the network is a DDoS attack on an edge router at the border of core and distribution networks in the municipal Internet of Pärnu, the fifth biggest city in Estonia by population and the place of residence of the fourth biggest Estonian government network node. The network of Pärnu is physically connected to core networks of Tallinn, the
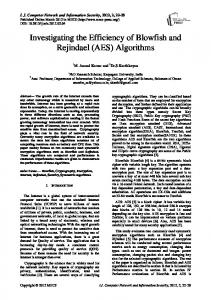
largest node of Estonia, and Viljandi. Summary of attack parameters is presented in Table 6. Because compromised hosts are located both outside and inside of the municipal network (see Fig. 8), both external and internal interfaces of the router are flooded simultaneously. Inbound traffic for the attacked router is illustrated in Fig. 9.
Table 6. Attack Parameters for Scenario 1 Type of attack Timing Attack target Sources of attack Client percentage (of all end devices) Server percentage (of all end devices) Access network link Core network link Percentage of web clients participating in the attack Other applications
Distributed UDP Flood Continuous flood Edge Router 4 (IP 130.7.0.3 and 192.168.3.30) Compromised web clients (zombies) of the Estonian network 80% 20% Edge Router 4 – Access Router 15 Edge Router 4 – Core Router 4 90% UDP network application deployed on 10% of all web clients (can overlap with attacking clients)
Fig.8. The Attacked Router as Viewed from Its Local Network (Left) and External Core (Right)
Fig.9a. Traffic towards the Attacked Router from the Inside of Its Corresponding Access Network
Copyright © 2015 MECS
I.J. Computer Network and Information Security, 2015, 11, 20-36
Data Traffic Modeling During Global Cyberattacks
31
Fig.9b. Inbound Traffic for the Attacked Router from Its Corresponding Core Network
Fig.10. Traffic For Two of the Servers Inside the Access Network Connected to the Attacked Edge Router. Despite Inducing Heavy Traffic on Router’s Interfaces, Very Little Traffic Impact is exerted on the Servers (Only Several Events over 681 Ticks)
Visibly, the traffic generated by a much larger external network is approximately ten times heavier than the outbound traffic of the access network: Traffic from core: 25 events per 681 ticks. Traffic from core: 249 events per 681 ticks. Even though the external interface of the edge router is abnormally congested, it has little influence on the hosts that it connects to the Internet (see Fig. 10). The reason for this disparity is that the DDoS zombies target only a single IP address – the external interface of the router, where the transmission stops. Thus, even though the edge router and Internet connectivity are heavily affected by Copyright © 2015 MECS
the attack, internal traffic inside the access network is unaffected or may even increase in speed due to the absence of external packets that normally would increase the level of congestion. This phenomenon occurs because in the designed topology, access routers are closely interconnected. If every access router was only connected to the edge router and no other access routers in a simple star topology, disabling the edge router would be disastrous for the entire access network. This very same degree of redundancy, but implemented at a distribution layer would help in alleviating the severe consequences of the DDoS scenario.
I.J. Computer Network and Information Security, 2015, 11, 20-36
32
Data Traffic Modeling During Global Cyberattacks
F. Scenario II – Server attack In the second scenario the target is a web server, once again placed in the Pärnu municipal network. Because the server itself is an end device, there is only a single source
of inbound traffic – an edge router. This differs from the previous case where the attacked router could have been flooded on both its external and internal front. Details of the scenario are listed in Table 7.
Table 7. Attack Parameters for Scenario 2 (no Firewall) Type of attack Timing Attack target Sources of attack Client percentage (of all end devices) Server percentage (of all end devices) Access network link Core network link Percentage of web clients participating in the attack (of all web clients in the network) Other applications
Repeating HTTP queries Continuous flood Web Server 37 (IP 130.7.0.5) Compromised web clients (zombies) of the Estonian network 80% 20% None (end device) Web Server 37 – Edge Router 1 90% UDP network application deployed on 10% of all web clients (can overlap with attacking clients)
Since the server in this scenario is a single-connection device that does not process packets in order to forward them, the simulation platform managed to complete a full, 1000-tick simulation (Fig. 11). In the previous scenario (edge router attack), the simulation was performed to at
most 681 ticks, with some runs even as low as 496 ticks before running out of physical and virtual memory and producing an error. Thus, the traffic charts need to be compared carefully, as the attack duration is different in both cases.
Fig.11. Web Server under Attack with No Firewall Protection
Similarly as in the previous scenario, there is a dramatic increase in inbound traffic to the attacked device. Because the attack lasts longer than previously, the upsurge is even more dramatic. The intensity of the attack expressed in events per tick, however, is only slightly heavier at the 600 mark. Even so, the UDP segments in this scenario are larger than TCP messages in the first scenario. This highlights the fact that selecting the type of flooding traffic may have profound effects on the overall effectiveness of a DDoS. Copyright © 2015 MECS
In the second subscenario (see Table 8), the server had been separated from the router network by a hardware firewall. The difference in setups is illustrated in Fig. 12. Although the firewall itself received approximately the same amount of traffic as the server did in the previous case, comparing charts in Fig. 13 show that the server traffic dropped more than fivefold. The amount of messages actually delivered to the server increased even with firewall protection as not all of the malicious traffic was filtered effectively. Still, with firewall protection, the
I.J. Computer Network and Information Security, 2015, 11, 20-36
Data Traffic Modeling During Global Cyberattacks
server only experienced a 14% increase in traffic overall instead of a 500% upsurge from the first subscenario (137 events compared to 120 events of regular traffic over 1000 ticks; see Fig. 12). Even though the firewall was not 100% effective, its presence managed to reduce server traffic nearly 4.4 times, from 500% of regular traffic to just 114%, which corresponds to just 3.5% of malicious traffic reaching the target. This value is in the same order of magnitude as
33
what Merike Kaeo stated to be the percentage of traffic left after filtering ICMP and TCP SYN malicious traffic on inbound points of the Estonian Internet – 2%. Both ICMP and TCP SYN messages are easily filtered with some configuration effort. It is therefore reasonable to conclude that an actual firewall placed similarly to the simulation topology would enable the server to suffer only a small fraction of the attack traffic.
Table 8. Attack Parameters for Scenario 2 (Firewall) Type of attack Timing Attack target Sources of attack Client percentage (of all end devices) Server percentage (of all end devices) Access network link Core network link Percentage of web clients participating in the attack (of all web clients in the network) Other applications
Repeating HTTP queries Continuous flood Web Server 37 (IP 192.169.0.5) Compromised web clients (zombies) of the Estonian network 80% 20% None (end device) Web Server 37 – Firewall 1 – Edge Router 1 90% UDP network application deployed on 10% of all web clients (can overlap with attacking clients)
Fig.12. First (Bare) and Second (Firewall-Protected) Configuration Comparison
Fig.13a. Web Server under Attack with Firewall Protection
Copyright © 2015 MECS
I.J. Computer Network and Information Security, 2015, 11, 20-36
34
Data Traffic Modeling During Global Cyberattacks
Fig.13b. Inbound Traffic for the Firewall Protecting the Web Server
IV. CONCLUSIONS There is a number of conclusions to be drawn from the simulations. First and foremost, it is possible to state that large-scale network DDoS simulation can be performed on modern personal computers, although only up to the size of a special-purpose internetwork of a relatively small country. NeSSi², the simulator, occupied a very large percentage of machine resources even during relatively undemanding simulations. Trials with larger networks (even up to 10 thousand hosts) introduced significant delay in network design and, more importantly, resulted in an “out of memory” error, because of insufficient physical memory available [28]. Even with additional precautions, including increasing the size of virtual memory swap file to the maximum level allowed by the OS and disabling all of the most memory-consuming features, including the Aero theme and other visual effects, the problem persisted. It could have been alleviated by employing additional machines and running all three of NeSSi²’s modules separately. By a large margin, the two most resource-consuming processes have been: Java.exe, sometimes occupying up to 650 MB of memory; Nessi.exe, sometimes occupying up to 900 MB of memory. The second conclusion, directly related to the outcomes, is that even an insignificantly small amount of traffic, generated by a large number of zombie computers, may be enough to disable even a powerful server. Latest news (November 2010) indicate that botnets can reach as many as 30 million hosts and a significant number Copyright © 2015 MECS
exceeds 200 thousand hosts [29]. Applying a botnet this large to a DDoS attack increases the probability of detection, but can result in a staggeringly effective assault. Judging by military criteria, it can be an excellent weapon since during war little consideration is given to the authorities who would normally investigate the botnet. For example, traffic generated at a modest rate of 200kbps on each zombie on a 30-million host botnet would be enough to saturate all but the most powerful undersea links between Europe and North America and generating 3.3Mbps (ADSL2+ upstream) would saturate VSNL Transatlantic, possibly the highest data rate transatlantic cable, four times over [30]. This was also the case in the simulation. Even generating as few as five packets over the course of the simulation, resulted in as many as 750 received by the victim. Both scenarios were perfect examples of why link redundancy is necessary on every level of network design. In the first scenario, the municipal network of the city was in itself unaffected by the attack on its edge router because of additional interconnections between the internal access routers. The connectivity with the outside world was lost due to a single point of failure at the distribution layer (the edge router), but internal connectivity remained due to multiple connections inside the municipal network. Had the topology been a less expensive, classic star, with every access router connected only to the edge router and its corresponding end devices, the internal connectivity would have also been shattered. On the same note, had multiple, redundant edge routers been connecting the municipal network to the core network, regular network traffic would have simply found another route and continue flowing, despite possible service degradation due to one router being attacked. Moreover, on analyzing the entire network under the
I.J. Computer Network and Information Security, 2015, 11, 20-36
Data Traffic Modeling During Global Cyberattacks
same set of criteria, it is possible to identify critical points of failure and implement redundancy to network segments where a successful DDoS attack would cause the most severe consequences. This can also be achieved in network simulators, such as NeSSi², by simply removing the device or link and investigating the resulting connectivity damage. The simulation highlighted the importance of traffic filtering, both ingress and egress. Without ingress filtering firewall, the server from the second scenario faced abnormally high traffic rates with high probability of successful DDoS. However, active egress filtering on each individual edge router would prevent the majority of malicious messages from reaching the core network in the first place. Both methods are recommended by security professionals and should be applied simultaneously because of their complementary character. For the first time was proposed method of maintaining intranet vitality in terms of external attacks by limiting the flow of requests from external sources. This may be useful to the electronic government systems, which are to maintain the critical ability to work in crisis situations, such as DDoS, by means of restricting users access. Additional conclusion, stemming from the case of web server with firewall protection is that it might be extremely beneficial to compromise hosts as close to the victim as possible, i.e. separated from it by a minimal possible number of diagnostic devices such as sniffers or defensive solutions, such as firewalls. Compromising hosts on the same local network as the victim not only renders its external firewall useless, but also may enable the attacker to fully exploit high-capacity LAN links, such as Gigabit Ethernet in order to send more attack traffic towards the victim.
The research and analysis of the results indicate that the proposed approach can further be improved by developing self-learning crisis detection management system. As Estonian case 2007 was not the most complex and structurally sophisticated event of malicious denial-ofservice activity, the proposed approach may need additional trial in a boundary circumstances, which will result in gathering more manifold statistics. In order to make a more precise conclusions about traffic influences, a traffic type factor should be taken into consideration. The ultimate goal of the research could be the development of intelligent self-learning system that ensures full protection of information and communication networks by analyzing traffic and application of protective measures at network management level, based on gathered statistic data (making global network reconfiguration or isolation "harmful" flows). Any further research modeling should be processed on non-java-based software or a more physically powerful machines.
Copyright © 2015 MECS
REFERENCES [1]
[2]
[3] [4]
[5]
[6] [7] [8] [9]
[10]
[11] [12]
[13] [14]
V. FURTHER RESEARCH
35
[15] [16]
[17] [18] [19]
[20]
[21] [22]
[23]
Xiang Y., Zhou W., Chowdhury M., A Survey of Active and Passive Defence Mechanisms against DDoS Attacks. Technical Report, TR C04/02, School of Information Technology, Deakin University, Australia, March 2004. Specht S. and Lee R., Distributed Denial of Service: Taxonomies of Attacks, Tools, and Countermeasures // Proceedings of the 17th International Conference on Parallel and Distributed Computing Systems, 2004 International Workshop on Security in Parallel and Distributed Systems, 2004 September. – P. 543 – 550. http://dictionary.reference.com/browse/botnet (acc. May, 31, 2014) Host icon by Everaldo Coelho, reposted under GNU Free Documentation License Version 2.1, http://upload.wikimedia.org/wikipedia/commons/thumb/7/ 77/Computer_n_screen.svg/500pxComputer_n_screen.svg.png (acc. Nov 30, 2013) Server icon by George Shuklin, reposted under GNU Free Documentation License Version 2.1, http://upload.wikimedia.org/wikipedia/commons/7/7c/Ser ver-tower.svg (acc. Nov 30, 2013) http://sourceforge.net/projects/nsnam/files/ (acc. Nov 15, 2013). http://www.isi.edu/nsnam/ns/ (acc. Nov 19, 2013). NS-3 official website, http://www.nsnam.org/ (acc. Nov 19, 2013). Kuhl M., Kistner J., Costantini K., Sudit M., Cyber Attack Modelling and Simulation for Network Security Analysis // Proceedings of the 2007 Winter Simulation Conference P. 1180-1188. Cisco Packet Tracer Datasheet, http://www.cisco.com/web/learning/netacad/course_catalo g/docs/ Cisco_PacketTracer_DS.pdf (acc. Nov 19, 2013). http://pcl.cs.ucla.edu/projects/glomosim/ (acc. Nov 19, 2013). SCALABLE Network Technologies home page, http://www.scalable-networks.com/products/qualnet/ (acc. Nov 19, 2013). http://tetcos.com/software.html (acc. Nov 19, 2013). http://www.opnet.com/solutions/network_planning_operat ions/ (acc. Nov 19, 2013). http://www.ece.gatech.edu/research/labs/MANIACS/GTN etS/feature_set.html (acc. Nov 19, 2013). Karsten Bsufka and Rainer Bye, NeSSi²Ver. 2.0.0-beta.3 Manual http://www.nessi2.de/fileadmin/Dateien/NeSSi/2.0.0beta.3/NeSSi2Manual.pdf (acc. Nov 19, 2013). http://www.nessi2.de/ (acc. Nov 16, 2013). This has been changed in the newest version (beta3), where all link types indicate bandwidth [author’s note]. Cotton, M., Vegoda, L., “Special Use IPv4 Adresses”, ICANN, IETF, January 2013, http://tools.ietf.org/html/rfc5735 (acc. Nov 17, 2013) Davis, J., “Hackers take down the most wired country in Europe”, Wired Magazine, August 21, 2007, http://www.wired.com/politics/security/magazine/1509/ff_estonia (acc. Sep, 12 2013) “Facts about e-Estonia”, Estonian Informatics Center, http://www.ria.ee/27525 (acc. Sep 30, 2013). Based on Eesti Statistika population statistics, http://pub.stat.ee/px-web.2001/Dialog/varval.asp?ma= Po0291&lang=1 (acc. Nov 19, 2013). Map of municipalities of Estonia (edited) – public domain image, http://commons.wikimedia.org/wiki/File: Estonia_municipalities.png (acc. Nov 21, 2013).
I.J. Computer Network and Information Security, 2015, 11, 20-36
36
Data Traffic Modeling During Global Cyberattacks
[24] Based on Eesti Statistika population statistics, http://pub.stat.ee/px-web.2001/Dialog/varval.asp?ma= PO0222&path=../I_Databas/Population/01Population_indi cators_and_composition/04Population_figure_and_compo sition/&lang=1 (acc. Nov 23, 2013). [25] http://www.stat.ee/main-indicators (acc. Nov 23, 2013). [26] http://www.merlyn.demon.co.uk/critdate.htm (acc. Nov 24, 2013). [27] http://download.oracle.com/javase/6/docs/api/java/lang/Sy stem.html#nanoTime%28%29 (acc. Nov 24, 2013). [28] http://download.oracle.com/javase/1.4.2/docs/api/java/lan g/OutOfMemoryError.html (acc. Nov 24, 2013). [29] BredoLab downed botnet linked with Spamit.com, InfoSecurity Magazine, November 1, 2010, http://www.infosecurity-magazine.com/view/13620/ bredolab-downed-botnet-linked-with-spamitcom/ (acc. Nov 24, 2013). [30] Poppe, Y., “Evolution of transoceanic lambdas. A GLIF capacity supplier perspective”, 23th APAN Meeting, January 22-26, 2007, http://www.apan.net/meetings/manila2007/presentations/b ackbone/lambdas-YP.ppt (acc. Nov 24, 2013).
Zenoviy Kharkhalis, born in 1992. Ph. D. student in Lviv Polytechnic National University. His main research interests include cognitive network management systems and network security
Manuscript received January 16, 2009; revised June 11, 2009; accepted July 21, 2009.
Authors’ Profiles Volodymyr Mosorov, born in 1961. D.Sc.Eng. Ph.D and professor in. Computer Science in Economics, University of Lodz, Poland. He is an author or co-author of more than 150 scientific publications, including: 2 monographs, 11 papers in journals from the Thomson Scientific Master Journal List and 11 patents. He was awarded by Order of Merit of the Republic of Poland, 2012. His research interests include: computer science, signal and image processing, industrial process tomography, telecommunication.
Andrzej Kosowski, born in 1985. M.Sc.. Institute of Applied Computer Science, Lodz University of Technology, Poland. Scrum master and software engineer at Fujitsu Technology Solutions. His main research interest includes software engineering.
Roman Kolodiy, born in 1969. Ph. D. and associated professor in Lviv Polytechnic National University. His main research interests include multimedia data processing and compression for telecommunications networks and systems, as well as telemedicine.
Copyright © 2015 MECS
I.J. Computer Network and Information Security, 2015, 11, 20-36