Plotted on a logarithmic time scale the pdf isa peaked function with an invariant width; this and ... exponential component of the distribution is not monotonic.
DATA TRANSFORMATIONS FOR IMPROVED DISPLAY AND FITTING OF SINGLE-CHANNEL DWELL TIME HISTOGRAMS F. J. SIGWORTH AND S. M. SINE Department of Physiology, Yale University School of Medicine, New Haven, Connecticut 06510
ABSTRACr A. L. Blatz and K. L. Magleby (1986a. J. Physiol. [Lond.l. 378:141-174) have demonstrated the usefulness of plotting histograms with a logarithmic time axis to display the distributions of dwell times from recordings of single ionic channels. We derive here the probability density function (pdf) corresponding to logarithmically binned histograms. Plotted on a logarithmic time scale the pdf is a peaked function with an invariant width; this and other properties of the pdf, coupled with a variance-stabilizing (square root) transformation for the ordinate, greatly simplify the interpretation and manual fitting of distributions containing multiple exponential components. We have also examined the statistical errors in estimation, by the maximum-likelihood method, of kinetic parameters from logarithmically binned data. Using binned data greatly accelerates the fitting procedure and introduces significant errors only for bins spaced more widely than 8-16 per decade. INTRODUCTION
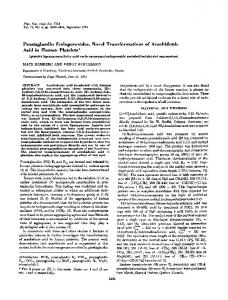
The rates of known conformational transitions in proteins span many orders of magnitude, from picoseconds to hours, reflecting the fact that transition rates depend exponentially on underlying energy differences. It is therefore natural to plot relaxation data on a logarithmic time scale, as was done by Austin et al. (1975) in their study of optical absorbance changes in myoglobin over a time scale of 2 ,As to 1 ks. Blatz and Magleby (1 986a, b) have recently shown the utility of a similar log-log representation for dwell-time distributions from single-channel recordings where the time constants are spread over several orders of magnitude. McManus et al. (1987) have also considered the bias introduced into estimates of fitted parameters by finite sampling intervals and binning. We present here an alternative, direct display method for histograms of constant logarithmic bin width and derive the corresponding probability density function (pdf). We also present an improved procedure for maximum-likelihood estimation of kinetic parameters from binned data, and we report the results of simulations to test the performance of this procedure. Fig. 1 A illustrates the limitations of the traditional linear histogram in displaying a dwell-time distribution having two exponential components. One component is well resolved on the time scale chosen for this plot; it comprises 70% of the events and has a time constant of 10 ms. The remaining 30% of the events belong to a component with a 100-ms time constant which is hardly visible on this time scale. The other parts of Fig. 1 show the same simulated data (5,120 events) and corresponding theoretical curves plotted on logarithmic time scales. Part B shows BIOPHYS. J.© Biophysical Society
-
Volume 52 December 1987 1047-1054
the representation introduced by Blatz and Magleby (1986a). Here the probability density, estimated by dividing the number of events in each bin by the bin width, is plotted on a log-log scale along with a log-log plot of the theoretical pdf. Parts C and D show the new representations to be considered in this paper, where the number of events in each bin (there are 10 equally spaced bins per decade) is plotted on a linear (C) or square-root ordinate (D). Superimposed on the histograms are the appropriately transformed, theoretical pdfs. Under the transformation to a logarithmic abscissa, the pdf corresponding to each exponential component of the distribution is not monotonic but has a peak at the value of the time constant. The unusual shape of the pdf can be understood from the fact that the bins at very short times are narrow and so collect few events, whereas at long times the frequency of events decreases exponentially, much more quickly than the increase in bin width. Thus a maximum is to be expected in the vicinity of the time constant of the distribution. DISPLAY OF DISTRIBUTIONS
Linear Histograms For comparison with the theory for the logarithmic histograms, we first review the theory of the traditional linear histogram (see for example Colquhoun and Hawkes, 1983). A set of bins is defined as having a width bt and starting values belonging to a sequence of times t,. Entries are made in the bins according to the dwell times observed, such that the number of entries ni in the ith bin is the number of events having durations t that satisfy
0006-3495/87/12/1047/08 $2.00
ti
< t
15c
c
2 10
100
10
50 0
L 4. o
l
i
10
20
il
30
l
40
i
7J
50
70
60
80
100
90
-5
10
Time (ms)
-4 -1 -3 -2 10 10 10 10
10
0
10
1
10
2
10
3
Time (s)
,
.
.
[r]rr~~~~~~~~~~~~qrd]j1j]jq?]~~~~~~~~~~~~~~~~~~~~~ -i 300
[ E-A-f