Data Visualizations for Dynamic Decision Support Jill L. Drury*, Gary L. Klein** The MITRE Corporation * Bedford, MA, USA and **McLean, VA, USA {jldrury, gklein}@mitre.org
Mark S. Pfaff1, Loretta D. More Pennsylvania State University 314 IST Building, University Park, PA, USA
[email protected],
[email protected],edu
ABSTRACT
inherently incomplete models of reality. There inevitably exists a gap between the description of a situation and the precise, accurate information needed to make optimal decisions. Hall et al. (2007) call this the Situation SpaceDecision Space gap. Decision-makers must make sense of the raw information in the “situation space” (e.g., from surveillance, sensors and alerts). They must then map this information into a “decision space” of the set of alternative courses of action (COAs) and their plausible consequences.
To enhance support of emergency response decision making, we are investigating decision aids that use simulation models to predict the range of plausible consequences of each potential course of action. Because of the rapid pace of systems such as emergency operations centers, the models would have to frequently recalculate the cost of each possible decision choice (in potential property damage, injuries, and loss of life) and the user interface displaying the results would need to facilitate rapid understanding of a changing landscape of possible futures. This paper describes a user test aimed at determining whether a model-driven visualization was useful, and evaluate the principled design of unambiguous and ambiguous decision-making test situations. Two groups of participants received identical textual descriptions of situations and were asked to decide the number of emergency response vehicles to dispatch. One of the groups also saw a visual depiction of model results. The decision-aided group’s decisions were closer to the normatively correct decisions, and both groups had higher confidence and shorter decision times for unambiguous situations.
An optimal COA is always extremely situation-dependent and is often sensitive to conditions beyond decisionmakers’ control. Under deep uncertainty (Lempert et al. 2003), decision-makers would be better served by aids for making robust decisions that are less sensitive to inaccuracies in situation descriptions. Lempert et al. (2003) and Chandrasekaran (2007) describe general methods for identifying robust COAs by using simulation models that determine the plausible consequences of each COA under a wide range of possible futures. Robust decision-making (RDM) will require novel visualizations of the simulated consequences of possible decisions. Consider a fire chief who must decide how many assets to deploy to a single fire. If a warm wind might whip the flames in the direction of the local chemical plant, the chief might make a very different decision than if a drenching downpour were to occur. The chief might want to visualize the potential for weather extremes and their effects on allocating two versus three ladder trucks to the scene. A graphical display based on weather simulation could make it easy to compare the results, using a relative cost metric, of what will happen when allocating two versus three ladder trucks under the best and worst conditions.
Author Keywords
Situation space, situation awareness, decision space, decision support, Robust Adaptive Planning, model-based decision support, emergency operations decision making. ACM Classification Keywords
H5.m. Information interfaces and presentation (e.g., HCI): Miscellaneous. INTRODUCTION
The purpose of this study was two-fold. Primarily, we wished to test whether a box-plot visualization of the robustness of COAs would impact people’s decision making. Secondarily, we aimed to determine whether we could design more complicated decision-making test situations based on the principles of RDM.
Any human description of a situation is an approximate model of reality. Simulating that model can be used to improve decision making, but can also lead to mistaken decisions because even precise simulations are still Permission to make digital or hard copies of all or part of this work for personal or classroom use is granted without fee provided that copies are not made or distributed for profit or commercial advantage and that copies bear this notice and the full citation on the first page. To copy otherwise, or republish, to post on servers or to redistribute to lists, requires prior specific permission and/or a fee. IUI 2009, February 8 - 11, 2009, Sanibel Island, FL, USA. Copyright 2009 ACM 978-1-60558-246-7/08/04…$5.00
VISUALIZATION
Although our work will be applicable to many domains in which decisions are made, our focus area was emergency response. To compare the relative desirability of alternative
1
Mark Pfaff is now at the University of Indiana Indianapolis
1
COAs, we developed a cost metric that takes into account the cost to send resources, the property damage that might occur in the course of the response, and a dollar value assigned to both the injuries and loss of life that might occur. However, one must also consider future costs in the current decision. If too many resources are allocated to the current emergency, there may not be enough to handle a future emergency, resulting in additional losses. The cost of current COAs should include some estimate of future damage, injuries, or loss of life that might be made more extensive than they otherwise might have been.
plots simultaneously, there have been small-scale variants of box-plots, such as one that arranges data along radial lines originating from the center of a circle (Jayaraman and North, 2002). Hundreds of slender box-plots could be displayed using a combination of Jayaraman and North’s visualization approach and a fisheye lens (Furnas, 1986) to allow for users to zero in on potential choices. Thus investigation of a simple box-plot visualization approach should scale well and generalize to other similar displays.
We developed a statistical box-plot visualization of the costs of the COAs facing an emergency response decision maker. We are aware of the universe of possible data visualizations, such as the hundreds of examples that can be seen at www.visualcomplexity.com or the “periodic table of visualizations” at visual-literacy.org. Box-plots were an obvious beginning point because they can readily show the costs for a range of possible futures for each COA.
Experiment Design
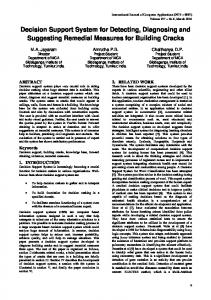
We used a simplified box-plot visualization (with no outlier data points) in this experiment because our intended audience of emergency responders will likely not have previous knowledge of sophisticated statistical concepts. In the visualizations (see Figure 1), each box-plot shows the lowest cost for the best possible future as a lower whisker, the 25th percentile cost as the bottom of the box, the median cost as a red line within the box, the 75th percentile cost as the top of the box, and the highest cost as the top whisker. d e tt re g e R e b lli ts W o n C o i is c e D d o o h il e k i L
Figure 1 (left). Box-plot visualization showing the relative costs of sending one fire truck versus two assuming a range of possible futures. 1
2 Fire Trucks
The power of the decision support comes from comparing the relative costs among all of the potential COAs. In each scenario, participants could choose between sending 0, 1, 2, 3, 4, or 5 emergency response vehicles (police squad cars, ambulances, or a fictional type of all-purpose fire truck). Therefore, participants saw six box-plots, with the y-axis representing cost and the x-axis representing the number of emergency response vehicles. The combination of the six box-plots is akin to Tufte’s “small multiples” (Tufte, 1990), in which he shows a series of simple graphics that differ in only a few key ways. We are mindful of the possibility that some situations will have dozens or hundreds of possible COAs instead of only the handful that we assume here. Thus any visualization approach should be scalable to more than a few COAs. While it’s difficult to imagine viewing hundreds of box-
METHODOLOGY
The experiment employed a mixed design. Between subjects: One group of participants received only situation space information (the SS group), and the other (the DS group) received both the situation space and decision space information. Within subjects: Each participant, regardless of group, was asked to make decisions in four different types of scenarios: 1) Unambiguous. There was clearly one COA that was better than the others in all dimensions. 2) Robustness versus cost. One COA had a higher median level of cost and/or a higher 25th percentile cost than the other COAs, but it also had a lower 75th percentile cost. This means that this COA would almost certainly result in a higher cost than the other COAs under the best circumstances, thus making it less attractive on a best-case basis. However, it would have much less probability of catastrophic results than the other COAs, thus making it the preferred choice on a worst-case basis. 3) Magnitude versus cost. All things being equal, smaller incidents normally require a smaller number of resources, and larger incidents should require a larger number of resources. But things are not always equal. For example, a small trash can fire in a major art gallery could result in millions of dollars in art restoration. Accordingly, more resources should be expended than would ordinarily be the case. Similarly, picture a large forest fire in the middle of a wilderness area in March. In this case, few (if any) resources should be expended. 4) Current versus future. These scenarios indicate that another emergency was imminent. There is a tension between using many resources to rectify the current emergency quickly, versus using fewer resources to combat the emergency more slowly but save resources to respond to the next emergency. Each participant was asked to make decisions in ten scenarios of each type. Experiment Conduct
Participants were assigned to the SS group or the DS group randomly. Participants were asked to read a paper copy of a one-page introduction to the experiment, which included Institutional Review Board (IRB) information. They were
H2 rationale: The box-plots will make it clearer which COAs will lead to more positive outcomes, so to the extent that this clarity is communicated to participants, they will be more confident in their decisions.
then given a paper copy of a training manual to read and keep as a reference during the experiment. We ensured that the training materials for both groups provided information about judging relative costs of the alternatives. Next, they were given five training scenarios on the computer interface to become familiar with it. After the training, they completed 40 scenarios on the computer interface during which participants were asked to play the roles of police or fire/rescue dispatchers.
H3: “Non-ambiguous” decisions will be made faster by the DS group. H3 rationale: Based on the situation space information only, it may not be readily apparent that a case is nonambiguous. The decision aid should make it apparent how clear the decision is, and the extra time needed to examine the decision aid will be more than offset by increased decision-making speed.
Each scenario contained a short textual situation space description of the emergency that included information that suggested the likely cost of the incident (e.g., a fire at a jewelry shop) and the likelihood of another incident occurring soon. For the DS group there was also a box-plot diagram of the decision space comparing the COAs. Each scenario was completely independent; what happened in one scenario did not affect another scenario and the number of resources available was reset to the maximum at each new scenario.
H4: In the case of “ambiguous” decisions, the DS group will take longer to make the decision. H4 rationale: When the decision is ambiguous, the decision aid will highlight the ambiguity and cause a decision-maker to stop and deliberate more than they would otherwise. H5: The DS group will give significantly higher scores for the degree of decision support provided to them.
After reading the provided information, the subject made a decision regarding the number of resources to send (0 to 5). Immediately after each decision, participants were asked to rate their confidence in that decision on a 7-point semantic differential scale (1 = “low” and 7 = “high”).
H5 rationale: The box-plots should help in determining which COA is likely to be best. The DS group should be more likely to feel that they have received some support in their decision making, while the SS group merely receives situation information.
After completing all of the scenarios, participants answered survey questions, including questions probing their subjective assessment of the decision support provided to them.
H6: The SS group will give significantly higher scores when asked to assess the degree to which they trusted the information provided to them. H6 rationale: The vast majority of the emergency situations reported to emergency dispatchers are genuine. The people who receive situation information only are likely to trust it. The people who also get decision aid information may not trust this additional model-based information.
Participants
We recruited 9 female and 12 male participants from a nonprofit corporation. Two participants were 30 years old or less, 4 were between 31 and 40, 7 were between 41 and 50, and 8 were between 51 and 60 years old. Four participants had some emergency response domain experience.
RESULTS
For H1, we examined the difference between the number of resources sent by each participant and the correct number of resources that should have been sent. The participants without the decision aid made greater underestimations (M = -.52, SE = .11) of the resources required to resolve events than participants who had the box-plot decision aid (M = -.20, SE = .10), t(20) = 2.15, p < .05.
Mitigating Confounders
As part of the post-test survey, we used three different survey instruments to determine where participants fell on the spectra of risk taking versus risk aversion (Blaise and Weber, 2006), visual versus verbal information processing (Childers et al., 1985), and vivid versus non-vivid imaging (Sheehan, 1967). We also surveyed participants’ prior experience with emergency response and with box-plots.
For H2, we found no main effect for confidence in decisions between the two groups. However, confidence was significantly higher in the non-ambiguous cases (M = 5.42, SE = .20) than in cases demonstrating robustness vs. cost (M = 4.76, SE = .20), magnitude vs. cost (M = 4.93, SE = .20), or current vs. future impact (M = 4.87, SE = .20), F(3,813) = 19.23, p < .001.
HYPOTHESES
There were six a priori hypotheses. H1: The DS group will make decisions that will result in more positive outcomes. H1 rationale: Since the box-plots take into account a number of factors that affect decision outcome, to the degree that they make the outcome quality clear, participants will be able to choose a response that will lead to a better outcome (that is, they will choose a decision that is closer to the normatively correct COA).
We analyzed H3 and H4 together because both pertain to speed of decision-making (decision time measurements were log-transformed for a normal distribution). Decision speed was significantly faster in the non-ambiguous cases (M = 9.51 (13.52 seconds), SE = .07) than in cases demonstrating robustness vs. cost (M = 10.22 (27.40
H2: The DS group will be more confident in their decisions.
3
seconds), SE = .07), magnitude vs. cost (M = 9.80 (18.03 seconds), SE = .07), or current vs. future impact (M = 10.04 (22.97 seconds), SE = .07), F(3,813) = 87.37, p < .001. All participants made faster decisions without the decision aid (M = 9.69 (16.16 seconds), SE = .10) than when using the decision aid (M = 10.10 (24.24 seconds), SE = .09), regardless of event type, t(20) = 2.98, p < .01. As the presence of the decision aid resulted in longer decision times for all event types, including ambiguous ones, H4 was partially supported. H5 and H6 were unsupported. Participants did not report any higher evaluation of the degree of decision support provided in either condition, nor did participants report any difference in the degree to which they trusted the information supplied with each event. No significant effects were found for covariance of any of the measures of personality traits or prior experience with box-plots or emergency response scenarios. DISCUSSION AND FUTURE WORK
The decision space information did significantly and positively impact the decisions that were made using the box-plot decision aid. Participants did not appear to have difficulty in understanding or making use of the plots. However, even with this additional decision space information, the DS group was no more confident in their normatively more correct decisions. This could be because the decision aid suggested a COA that conflicted with their otherwise intuitive choice. They apparently found the visualization compelling enough to follow its suggestion, but maintained some intuitive doubt. We created the ambiguous cases by exploiting the tension among the terms in the cost equation. Because participants had less confidence and took a longer time to make decisions in the non-ambiguous cases, it appears that this successfully introduced decision-making conflict based on decision space trade-offs. This result adds a new perspective on why people have difficulty making decisions in some situations. In particular, the trade-off between robustness and median cost only becomes apparent in the decision space. It was therefore surprising that the box-plot visualization, which makes this particular tradeoff vary apparent, had no affect on time or confidence. We plan to explore why people apparently find all of the ambiguous cases to be difficult. It is possible that they thought the COA costs were closer together than they expected, perhaps because they would have assigned different cost values to the model’s equations. Our future work plans include experiments to determine how participants would value cost parameters. We are considering allowing them to interact with the parameters via sliders, such as have been used in interfaces designed by Shneiderman (e.g., Williamson and Shneiderman, 1992).
ACKNOWLEDGMENTS
This work was supported by The MITRE Corporation Innovation Program project 19MSR062-AA. Thanks to Robert Hooper of PSU for help with scenario development. Thanks to David Hall and Jacob Graham of PSU for acting as sounding boards for ideas discussed in this project and for information systems support to conduct the experiment. REFERENCES
1. Blais, A., & Weber, E. A domain-specific risk-taking (DOSPERT) scale for adult populations. Judgment and Decision Making, 1(1), 33-47. 2006. 2. Chandrasekaran, B., From Optimal to Robust COAs: Challenges in Providing Integrated Decision Support for Simulation-Based COA Planning, Laboratory for AI Research, The Ohio State University, 2005. 3. Childers, T. L., Houston, M. J., & Heckler, S. E. Measurement of individual differences in visual versus verbal information processing. The Journal of Consumer Research, 12(2), 125-134., 1985. 4. Furnas, G. W. Generalized Fisheye Views. Proc. of the Conference on Human Factors in Computing Systems (CHI'86), ACM Press, 1986. 5. Jayaraman, S. and North, C. A radial focus+context visualization for multi-dimensional functions. Proc. of the Conference on Information Visualization, Boston, IEEE Computer Society, 2002. 6. Hall, D. L., Hellar, B. and McNeese, M. Rethinking the Data Overload Problem: Closing the Gap between Situation Assessment and Decision Making, Proc. of the 2007 National Symposium on Sensor and Data Fusion (NSSDF) Military Sensing Symposia (MSS), McLean, VA, 2007. 7. Lempert, Robert J., Steven W. Popper and Steven C. Bankes, Shaping the Next One Hundred Years: New Methods for Quantitative, Long-Term Policy Analysis, Santa Monica, Calif., RAND MR-1626, 2003. 8. Sheehan, P. A shortened form of Betts' questionnaire upon mental imagery. Journal of Clinical Psychology, 23(3), 386-389, 1967. 9. Tufte, E. R. Envisioning Information. Cheshire, CT: Graphics Press, 1990. 10. Willamson, C. and Shneiderman, B. The dynamic HomeFinder: Evaluating dynamic queries in a realestate information exploration system. Proc. of the 15th Annual International ACM SIGIR Conference on R&D in Information Retrieval, Copenhagen, ACM Press, 1992.