DataViewer: A Scene Graph Based Visualization Tool Randy Paffenroth, Dana Vrajitoru, Thomas Stone, John Maddocks Abstract— This article outlines the capabilities of a scientific visualization toolkit called DataViewer, and compares it to analogous software. DataViewer was originally designed for the construction of the visualization part of certain computational steering packages, and consequently it is particularly straightforward to closely couple DataViewer with numerical calculations. Rendering is performed through a high-level scene graph which facilitates the easy construction of complex visualizations. DataViewer differs from other such libraries by allowing complex geometrical objects, which efficiently encapsulate large amounts of data, to be used as nodes in the scene graph. Graphics hardware access is through the OpenGL API. Keywords— Scene Graphs, Scientific Visualization, Steered Computations.
I. Introduction DataViewer is a scientific visualization library created to allow the easy development of efficient visualization programs for those who are not, and do not wish to become, graphics programming experts. DataViewer comprises a high-level set of routines for rendering geometric objects. It utilizes the OpenGL graphics API [1] for low level rendering. DataViewer has previously been used in several different visualization projects, e.g. most of the visualization modules of the parameter continuation software package VBM (Visualization of Bifurcation Manifolds, [2], [3], [4]) have been developed using it. Most of the goals that have driven the design of DataViewer are comparatively standard. It had to be computationally efficient, but with a high-level easy-to-use interface, portable (at least over UNIX platforms), and open source, freely available to the mathematical and scientific research communities. A less standard design goal for DataViewer was to facilitate a close coupling between visualization and numerical computations, so as to be able to visualize dynamic data sets easily. By dynamic data sets we here mean data sets that are continually being modified as, for example, in interactively steered codes. Such dynamic data sets require a tighter coupling to the actual computation of the numerical data than is necessary in the more standard mode of visualizing a static, pre-computed Randy C. Paffenroth is with the Center for Research in Parallel Computing, California Institute of Technology, Pasadena, California. E-mail:
[email protected] Dana Vrajitoru is with the Laboratory for Computation and Visualization in Mathematics and Mechanics, EPFL, Switzerland. E-mail:
[email protected] Thomas Stone is with the Aerospace Systems Division, Veridian MRJ Technology Solutions, Fairfax, Virginia. E-mail:
[email protected] John Maddocks is with the Laboratory for Computation and Visualization in Mathematics and Mechanics, EPFL, Switzerland. E-mail:
[email protected]
data set a posteriori. Rendering in DataViewer is performed through a highlevel scene graph based structure which allows the user to construct complex visualizations simply. DataViewer is object oriented and provides a selection of leaf nodes that contain data for visualization, and container nodes that group together other nodes and which share properties. In addition to using only existing node types, more advanced users may easily add new node types to extend DataViewer’s capabilities. DataViewer differs from other such libraries in that it allows both simple and complex geometrical objects to be used as single nodes in the scene graph. The complex nodes can be used to visualize large amounts of data more efficiently than is possible by using conglomerations of simple nodes, while the simple nodes can be used when flexibility is required. Section III will detail DataViewer’s implementation of a scene graph and give examples of geometrical objects that DataViewer provides. This paper is structured as follows. Section II describes the history of the development of DataViewer and compares it with similar software packages. Section III describes the design, implementation and specific features of DataViewer. Finally, Section IV introduces some examples of DataViewer applications. II. History and Comparisons The design decisions that were made in the development of DataViewer were profoundly affected by the historical software context in which they were made. Accordingly, we first describe some of the chronology of DataViewer, and mention other software to which it may be compared. Many packages and algorithms have been developed for rendering three dimensional graphics on modern computers. Because our work requires highly interactive 3D graphics tightly coupled to computation, only certain approaches were of potential interest to us. For example, ray-tracing, e.g. POV-Ray [5] performs well under many circumstances and can produce very realistic images, but is generally too slow and often inappropriately detailed for our purposes of interactive scientific visualization. Similarly our experiences with [3], and evaluations of, general purpose highlevel visualization packages such as AVS [6], DataExplorer [7], and Explorer [8] lead us to the conclusion that it was awkward to couple such programs tightly with computations. For the problems of interest to us it seems to be more efficient to visualize by embedding 3D graphics capabilities into a computational code, rather than to embed computational code into a general graphics package. In addition such large software packages as AVS, DataExplorer,
and Explorer, typically do not meet our desiderata of low cost, and access to source code. Nevertheless we found that fast interactive control, zooming, rotations etc, was close to essential for the efficient generation of understanding from our numerical data sets. Commonly, such interactive graphics require some type of hardware assistance for the rendering process. Geometry rendering is notoriously slow, but since it is a repetitive process it can be efficiently implemented in hardware. Many companies produce hardware accelerators for graphical rendering, but until recently each accelerator tended to use its own proprietary library for accessing the hardware. Many attempts have been made to place software layers on top of the specific hardware implementations to make applications portable. In this category, some libraries defined a standard API, and hardware vendors were expected to provide implementations of this API for their hardware. Examples include PEX, PHIGS, GL, OpenGL, and Direct3D. Today the situation has become clearer, and it appears that OpenGL is the preferred solution on Unix and Macintosh systems and either OpenGL or Direct3D is the preferred solution on Microsoft Windows. These comparatively low level libraries offer the advantage that an application may be developed using them, and this application will then be portable to any hardware which has an implementation of the appropriate API. To achieve portability and maintain efficiency in our code development, we decided to use OpenGL to access hardware renderers. OpenGL is very general, but quite low level. It only provides simple geometrical primitives (such as lines and triangles), and higher level objects must be implemented separately. Accordingly, writing applications directly in OpenGL can be complex, time consuming, and, for most of the world, unappealing. We therefore decided that our development needs called for some type of additional layer on top of OpenGL to provide a higher level of abstraction that would make visualization programming more accessible. We examined the libraries and packages that were available in late 1996, and found several candidates, for example OpenInventor [9], GeomView [10], Alice [11], Java3D [12], and VTK [13]. Unfortunately, none of the available software met our needs, for the following reasons. OpenInventor is a product developed by Silicon Graphics as an evolution of their Inventor library. It is a layer written on top of OpenGL which provides high level geometrical objects, manipulation tools, and basic graphical user interface (GUI) elements. OpenInventor provided all of the functionality that we required, but was only ubiquitous on computers from Silicon Graphics. Today it is available for a wide array of computers, but it is not free and not available in source code form. GeomView is a software package developed at the Geometry Center of the University of Minnesota. It is a visualization system, as opposed to a library such as OpenInventor. It has many useful features, but being a complete system somewhat analogous to a small scale AVS, we again deemed it awkward to closely couple GeomView to large scale nu-
merical computations. Alice is a project from Carnegie Mellon University that provides a high level, easy to use interface to three dimensional graphics. Unfortunately, it is only available for the Windows operating system, and we wanted to be able to couple our visualization to Unix-based parallelized computational packages. Java3D [12] is an extension to the Java [14] programming language which allows geometrical rendering to be efficiently performed in Java programs. It can use a variety of low level rendering libraries, including OpenGL and Direct3D. Java3D seemed perfect for our needs. It provides efficient, easy to use geometry rendering, can be tightly coupled to numerical computations, and can be used on any computer with a Java Virtual Machine. Unfortunately, at the time DataViewer was being developed, Java3D was only a very preliminary specification, and a fully functional version was not released until November 1998. Even now, Java3D is not widely available beyond Sun Microsystems and Linux based computers. VTK, the Visualization Toolkit, is a software package developed by Kitware Inc. with various applications in both scientific and artistic visualization and in image processing. This product is known to be portable, robust and flexible, and to provide a high level of abstraction in building 3D graphics. In spite of its many advantages, it was not designed for close coupling to numerics, and is in many ways much more sophisticated than our needs. For example, VTK is approximately 3-4 times as big as DataViewer. Currently VTK would represent the alternative software most closely realizing the DataViewer objectives, although the differences were more substantial when we started the implementation of DataViewer. (Of course by definition DataViewer meets all the DataViewer goals!) Hence in late 1996, we were left with the prospect of starting to create our own visualization software library. DataViewer 2.x was developed by R. Paffenroth, T. Stone, D. Vrajitoru, and A. Ahearn; it is our attempt to create a library which encompasses all of the needs detailed in the Introduction. III. DataViewer 2.x Design The first release, DataViewer1.0, was implemented based on C++ with Motif for the GUI. DataViewer 2.x differs from DataViewer1.0 in two main respects. First, DataViewer 2.x uses Python to create GUIs, which we feel makes implementations much simpler. Second, DataViewer 2.x encapsulates all low-level graphics calls. The user may know nothing about OpenGL and still be able to exploit DataViewer 2.x efficiently. Further detail on the DataViewer 2.x software library may be found at http://lcvmwww.epfl.ch/DV. A. Implementation DataViewer 2.x is written entirely in C++, and uses many of the language’s object oriented features, such as templates and virtual functions [15]. Each graphical object class in DataViewer 2.x inherits from a single base class
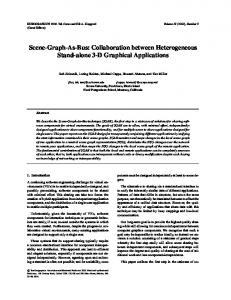
called DVobject. Each DVobject defines a virtual draw routine that canonically contains a set of OpenGL commands that create the graphical representation of the object. In addition, each DVobject contains a set of properties, such as color, translation, and rotation. These properties are discussed in greater detail below. Python gives access to the Tk [16] widget library, which DataViewer utilizes for the design of GUIs. Tk is a library of widgets which can be accessed from a wide variety of languages, including Tcl, Python, C/C++, and Perl. It is a robust and mature code which has implementations on all Unix systems as well as Microsoft Windows and Macintosh. In our opinion, Tk is much easier to use than Motif and makes the GUI more flexible. For users with only a little familiarity with Tk and Python, it is quite straightforward to create customized DataViewer GUIs for their particular problems. Finally, DataViewer 2.x provides several features that are accessible in any application which uses the library. For example, DataViewer provides stereo viewing capabilities, using hardware such as Crystal Eyes from StereoGraphics Inc, along with access to six degree-of-freedom controls, such as the Magellan 6D Mouse from Logitech Inc. B. The Scene Graph and its Properties The most important feature of DataViewer 2.x is its representation of the geometrical scene as a graph. Scene trees are a well-known and longstanding notion in computer graphics, either as a structural hierarchy of the view scene [17], or a spatial development of it [18], [19]. Although some recent research has expressed reservations concerning scene graphs [20], especially for photo-realistic rendering, they are still an efficient paradigm for scientific visualization, and we chose to implement them in DataViewer 2.x. In a scene graph, a geometrical object is represented in a hierarchical fashion using a tree. A given object is divided into pieces, each of which is either a leaf node (i.e. a geometrical object which can be represented as an atomic data type) or a group node which itself contains other nodes. DataViewer 2.x implements a scene graph by using two main types of nodes. The first type of node in DataViewer 2.x is the geometry node. Geometry nodes are the leaf nodes of DataViewer 2.x. They represent basic geometrical objects. DataViewer 2.x differs from most libraries that use scene graphs in that DataViewer 2.x provides both simple leaf nodes, and in addition leaf nodes that are quite complex geometrical objects. Such objects usually group any number of data to be translated into the same category of geometrical shapes and/or OpenGL primitives. Geometry nodes in DataViewer 2.x include sets of lines, cylinders, polygons, triangle strips, spheres and others. For example, Figure 1 is represented as two leaf nodes of DataViewer 2.x, a simple one containing the planar grid, and a more complex one containing a set of line segments rendered as cylinders with an associated ribbon . While complex leaf nodes reduce the flexibility of a library, DataViewer 2.x includes complex objects for two
Fig. 1. A complex geometric object which can be represented in DataViewer 2.x by two leaf nodes. The tube formed from cylinders and ribbon are both included in the definition of the first leaf node. The planar grid forms the second leaf node.
reasons. First, in our work certain types of geometry nodes are commonly used as metaphors for scientific visualization, and we wish these complex objects to be easy to use. For example, Figure 2 represents a surface computed as a surface of rotation generated by a periodic curve satisfying a certain system of ordinary differential equations. Second, each node in DataViewer 2.x has a certain amount of computational overhead imposed at each processing of the scene graph. For complex objects grouped into a single node, this overhead is low, while conglomerations of simpler objects increases the overhead. Concretely, many operations can be performed once for a whole set of basic geometrical shapes. Such operations include the definition of rendering properties such as color or data components to be displayed. In addition, properties such as rotation, translation, and scaling, are composed as the drawing advances in the depth of the tree. These operations take a non-trivial amount of computational effort, and the modification of some of them can even cause the OpenGL rendering pipeline to stall, causing a significant loss of efficiency. Thus, grouping basic objects into single leaf nodes as much as is possible both significantly improves the speed of translating a scene tree into OpenGL commands, and reduces the number of such commands. The second type of node in DataViewer 2.x is the container node. Container nodes group together other nodes into a set sharing a number of common graphical properties, which may then be treated as a single node. The container node and the nodes that are attached to it are linked by a parent - children relationship. DataViewer divides container nodes into two classes. The first class of container nodes is represented by normal containers, which have the following functionality: their draw function calls the draw functions of all of the children by passing to them a composition of the geometrical properties received from higher in the tree and the container’s own properties. The second class of container nodes includes several kinds of selection containers. Their draw function calls the draw func-
Container Green
1 Red
Container
Container Blue
2
Fig. 2. A complex geometric object which can be represented in DataViewer 2.x by a set of triangle strips in a single leaf node.
tions of only some of the children. Generally, the selection containers are used for special effects, such as animation and level-of-detail1. A scene graph also requires some way to handle properties, such as color. For example, the developers of OpenInventor chose to implement properties as leaf nodes themselves. In other words, leaf nodes are not just geometrical objects, they may also be properties. A color node may appear in the scene graph, and each geometrical object is drawn in the color of the color node that is closest to it (depending on how the scene graph tree is traversed). While this approach is quite flexible, it does introduce an order dependence in the scene graph. Depending on the order in which the scene graph is rendered different results may occur. DataViewer therefore took the different approach of including the properties into the geometry and container nodes themselves. Each node may either set the value of a given property itself, in which case objects in the node are rendered using its own value of the property, or the node may inherit the property from its parent. An example of a group of spheres and a set of property definitions is shown in Figure 3. Using this type of property inheritance the scene graph is not order dependent, and there is only a small loss of flexibility. We remark that, subsequent to our development of DataViewer 2.x, Java3D adopted the same property structure. C. Animation DataViewer 2.x provides 2 types of animation: flip-book and key-framed. Both types of animation are implemented using selection containers. Flip-book animation is achieved by simple selection containers that draw only one of their children for each frame. They occupy a relatively large amount of memory space, but are very flexible. In contrast key-framed animation is implemented using rotation and translation interpolation containers. They contain a list of rotation or translation properties corresponding to some particular frame numbers. Their draw function calls 1 Level-of-detail is a method by which a given object is rendered differently based upon its relationship to the viewer. For example, an object may be rendered at lower detail when it is far from the viewer.
3
Fig. 3. This figure shows a scene graph on the left and the graphical result of the scene graph on the right. The top container sets the color property to be green. The sphere attached to the top container sets the color property to red, and the first container attached to the top container sets the color property to blue. No other node sets the color property. The sphere marked with 1 is drawn in red since it sets that property itself. The sphere marked with 2 inherits its blue color from the container directly above it. The sphere marked with 3 inherits its green color from the top container.
the draw functions of all of their children for each frame, but hands them a rotation or translation property that is interpolated according to the frame number. This kind of animation is less flexible, but occupies significantly less memory and requires less user effort to create. Another feature of DataViewer is the possibility to combine any kind of normal and selection containers to create quite complex scenes. DataViewer 2.x is quite flexible and allows one to balance memory space restrictions and speed requirements when combining large static scenes with small animated objects. D. Runtime Features Every application written with DataViewer is automatically provided with a number of features that make the program interactive and easy to use. The first category of runtime features concerns navigation through the 3D scene. With simple mouse and keyboard actions, the user can perform rotations, translations and zooms of the 3D scene. Other more complex actions, such as selecting particular objects from the scene for further manipulation, can be linked to the mouse and keyboard by each application. The second category of runtime features concerns view and display manipulation via a menu bar associated with DataViewer’s main window (see Figure 4). The menu options include control of 6D and stereo devices, macros for setting the viewpoint, exporting snapshots of the displayed image, etc. An important widget in DataViewer is the animation control that provides navigation through an animated scene and frame by frame view. It is possible to export any particular DataViewer scene to various 2D and 3D formats such as bitmap, POV-Ray [5], etc. IV. Applications Several applications of DataViewer have already been implemented. We briefly mention three. A. VBM Visualization of Bifurcation Manifolds (VBM) [2], [4] is a software package whose goal is to provide tools for computing, manipulating, and visualizing bifurcation
Fig. 4. An example of DataViewer’s main window with menu bar.
manifolds obtained by parameter continuation. As described in [3] VBM is a confluence of the packages MC2 http://lcvmwww.epfl.ch/visual.html and PCR [21], [22], which represent much of our earlier, and more painful, experiences with graphics packages. VBM allows easy access to large data sets using special projections of the bifurcation diagram. It also provides direct selection of any particular solution, followed by its more detailed visualization in a separate window using a data probe. Most of the data probes in VBM have been written using DataViewer, Figure 5 shows an example of a VBM data probe. VBM has been developed by R. Paffenroth, J. Maddocks, R. Manning, D. Vrajitoru, and K. Hoffman.
This application defines a file format that provides special syntax structures for each graphical class in DataViewer and for most of the properties attached to them. This graphical file format uses especially minimal syntax requirements while keeping the structure of the scene clear. Thus, with minimal effort, the user can transform a raw data file produced by any other program, into a coherent scene file that can then be visualized with DataViewer. Following the ideas from the design of DataViewer, the data are grouped into large objects according to the graphical primitives they represent. This procedure decreases memory needs, streamlines the rendering, and minimizes the number of tokens in the scene file. The syntax also provides a tree structure similar to the one described in Section III-B.
Fig. 6. An example of a geometrical object generated with the scene file parser. (There are lots of castles in Switzerland.)
C. Slinky
Fig. 5. A runtime example of the software package VBM. The top window contains a bifurcation diagram in which each point on the curve represents a solution to a system of differential equations for some parameter values, with color indicating stability properties. The bottom window visualizes the solution corresponding to the point in the bifurcation diagram marked by a white ball.
B. Scene File Parser The Scene File Parser [23] by D. Vrajitoru is an application of DataViewer allowing rapid development, modification and visualization of 3D scenes by means of a file parser (see Figure 6) even with no knowledge of programming. As DataViewer can also export scenes to this file format, the scene file parser can be used as an input and output mechanism, to take 3D snapshots from DataViewer applications, and for debugging purposes.
DataViewer2.0 has been used in the latest implementation of a package called Slinky that was build to interactively explore solutions of an initial value problem for a system of ordinary differential equations describing an elastic ribbon. The ODE system governs the shape of an elastic rod that is used as a model of DNA (see Figure 7). The GUI allows the effect of changes in various coefficients and model parameters to be viewed interactively, with no external coding required. Acknowledgments It is a pleasure for the authors to be able to thank the many useful suggestions and criticisms from the past and current members of the Laboratory for Computation and Visualization in Mathematics and Mechanics (or LCVM2 ) of the EPFL, and the former Laboratory for Computation and Visualization in Mechanics (or LCVM) at the University of Maryland. References [1]
J. Neider, T. Davis, and M. Woo, OpenGL Programming Guide, Addison-Wesley, 1993.
[23] D. Vrajitoru, DataViewer Scene File Format Documentation, LCVM, EPFL, http://lcvmwww.epfl.ch/DV/Scene file/.
Fig. 7. An example of an elastic rod generated with Slinky.
[2] [3]
[4] [5] [6] [7] [8] [9] [10] [11] [12] [13] [14] [15] [16] [17] [18]
[19] [20]
[21]
[22]
R. Paffenroth, Mathematical Visualization, Parameter Continuation, and Steered Computations, Ph.D. thesis, University of Maryland, 1998, http://lcvmwww.epfl.ch/~redrod. J. H. Maddocks, R. Manning, R. Paffenroth, K. Rogers, and J. Warner, “Interactive computation, parameter continuation, and visualization,” International Journal of Bifurcation and Chaos, vol. 7, no. 8, pp. 1699–1715, 1997. R. Paffenroth, “VBM (visualization for bifurcation manifold),” WWW page, http://lcvmwww.epfl.ch/VBM/. C. Cason, Persistence of Vision Ray-Tracer User Documentation, 1994, http://www.povray.org. AVS, “Advanced visual systems,” WWW page, http://www.avs.com. ProtoView, “Data explorer,” WWW page, http://www.pds-site.com/ProtoView/ACS/DataExplorer.htm. Numerical Algorithms Group, “Iris explorer,” WWW page, http://www.nag.com/Welcome IEC.html. J. Wernecke, The Inventor Mentor : Programming ObjectOriented 3d Graphics With Open Inventor, Addison-Wesley, second edition, 1994. T. Munzner, S. Levy, and M. Phillips, The Geomview Manual, The Geometry Center, University of Minnesota, http://www.geomview.org/. Carnegie Mellon University, “Alice,” WWW page, http://www.alice.org. K. Rushforth, M. Deering, and H. Sowizra, The Java 3D API Specification, Addison-Wesley, 1997. W. Schroeder, K. Martin, and B. Lorensen, The Visualization Toolkit. An Object-Oriented Approach To 3D Graphics, Prentice Hall, second edition, 1997. K. Arnold and J. Gosling, The Java Programming Language, Addison-Wesley, 1996. B. Stroustrup, The C++ Programming Language, AddisonWesley, third edition, 1997. J. K. Ousterhout, Tcl and the Tk Toolkit, Addison-Wesley, 1994. S.R. Clay, “Put: Language-based interactive manipulation of objects,” IEEE Computer Graphics and Applications, vol. 16, no. 2, pp. 31–39, March 1996. K.R. Subramanian and B.F. Naylor, “Converting discrete images to partitioning trees,” IEEE Transactions on Visualization and Computer Graphics, vol. 3, no. 3, pp. 273–288, July-September 1997. O. Sudarsky and C. Gotsman, “Dynamic scene occlusion culling,” IEEE Transactions on Visualization and Computer Graphics, vol. 5, no. 1, pp. 13–29, January-March 1999. W. Bethel, “Scene graph APIs: Wired or tired?,” in SIGGRAPH’99 Conference Abstracts ans Applications. 1999, Computer Graphics Anual Conference, pp. 136–138, ACM SIGGRAPH. G. Domokos and R. C. Paffenroth, “Case study: Visualization for boundary value problems,” in IEEE Visualization ’94 Conference Proceedings, R. D. Bergeron and A. E. Kaufman, Eds. 1994, pp. 345–348, IEEE Computer Society Press. G. Domokos and R.C. Paffenroth, “PCR a visualization tool for boundary value problems,” WWW page, http://lcvmwww.epfl.ch/PCR/.