Dealing with uncertainty in Gaussian Bayesian networks from a regression perspective Miguel A. Gómez-Villegasa , Paloma Maina , Hilario Navarrob and Rosario Susia a Universidad Complutense Madrid, Spain b Universidad Nacional de Educación a Distancia, Spain Abstract Some sensitivity analyses have been developed to evaluate the impact of uncertainty about the mean vector and the covariance matrix that specify the joint distribution of the variables in the nodes of a Gaussian Bayesian network (GBN). Nevertheless, uncertainty about the alternative conditional speci…cation of GBN based on the regression coe¢ cients of each variable given its parents in the directed acyclic graph (DAG), has received low attention in the literature. In this line, we focus on evaluating the e¤ect of regression coe¢ cients misspeci…cation by means of the Kullback-Leibler (KL) divergence.
1
Introduction
GBNs are de…ned as Bayesian networks (BNs) where the joint probability density of X = (X1 ; X2 ; :::; Xp )T is a multivariate normal distribution Np ( ; ) with the p dimensional mean vector and the p p positive de…nite covariance matrix using a directed acyclic graph (DAG) to represent the dependence structure of the variables. As in BNs, the joint density can be factorized using the conditional probability densities of Xi (i = 1; :::; p) given its parents in the DAG, pa(Xi ) fX1 ; :::; Xi 1 g. These are univariate normal distributions with densities f (xi jpa(xi ))
N (xi j
i+
i 1 X
bji (xj
j ); vi )
j=1
being i the marginal mean of Xi , bji the regression coe¢ cients of Xi given Xj 2 pa(Xi ), and vi the conditional variance of Xi given its parents in the DAG. Note that if bji = 0 then Xj is not a parent of Xi . The parameters of the joint distribution can be obtained from the previous conditional speci…cation. More concretely, the means f i g are 1
E-mail addresses:
[email protected] (M.A. Gómez-Villegas),
[email protected] (P. Main),
[email protected] (H. Navarro),
[email protected] (R. Susi)
obviously the elements of the p dimensional mean vector and = [(Ip
B)
1 T
] D(Ip
B)
1
(Shachter and Kenley, 1989) where D is a diagonal matrix D = diag(v) with the conditional variances vT = (v1 ; :::; vp ) and B a strictly upper triangular matrix with the regression coe¢ cients bji ; j 2 f1; :::; i 1g. The speci…cation based on ( ; B; D) is more manageable for experts because they only have to describe univariate distributions. Moreover, the DAG can be improved by adding the numerical values of the regression coe¢ cient and conditional variance to the corresponding arc and node, respectively. Nevertheless, there can still be considerably uncertainty about parameters. Sensitivity analysis is an important phase of any modelling procedure. (Castillo and Kjærul¤, 2003) performed a one-way sensitivity analysis investigating the impact of small changes in the network parameters and . Alternatively, (GómezVillegas, Main and Susi, 2007) proposed a oneway global sensitivity analysis instead of considering local aspects as location and dispersion, over the network’s output. Also, in (GómezVillegas, Main and Susi, 2008) a n way sensitivity analysis is presented as a generalization of
the previous one both using the KL divergence to evaluate the impact of perturbations. It is well known the KL divergence is an nonsymmetric measure that evaluates the amount of information available to discriminate between two probability distributions. We have chosen it because we want to compare the global behaviors of two probability distributions. The directed KL divergence between the probability densities f (w) and f 0 (w), de…ned over the same domain is Z 1 f (w) 0 DKL (f j f ) = f (w) ln 0 dw : f (w) 1 The expression for multivariate normal distributions is given by DKL (f 0 j f ) =
=
1 j 0j + tr ln 2 j j 1h 0 T + 2
0
0
1
1
0
+
Ip i
2 ;
where f and f 0 are densities of normal distributions Np ( ; ) and Np ( 0 ; 0 ) respectively. In general, if X = (X1 ; X2 ; :::; Xp )T is a random vector normally distributed with parameters (0; ) where the covariance matrix is inaccurately speci…ed, the e¤ect of a perturbation p p measured in terms of a directed KullbackLeibler divergence can be expressed as follows 1 j j DKL (f jf ) = [ln + tr( 2 j + j =
1 [ln jIp + 2 1 tr( 4
1
j
tr(
1
(
1
1 , jj jj the Frobenius matrices + and F matrix norm and tr ( ) the trace function. However, as the directed KL divergence DKL (f 0 j f ) can be interpreted as the information lost when f 0 is used to approximate f , in the following sensitivity analyses f has to be the original model and f 0 the perturbed one opposite to previously used divergence. Herein we focus on the repercussion of a misspeci…ed Bp p matrix, while the rest of the conditional parameters are known. To evaluate perturbation e¤ects, the proper directed KL divergence is used in all the studied cases. The paper is organized as follows. In Section 2 the problem is stated and analyzed for constant errors. In Section 3 random perturbations are considered; some examples illustrate the behavior of the proposed measure for both local and global uncertainty.
+
))]
)]
1 )2 = jj 1 jj2F = 4 p 1X T 1 2 = ) i i ( 4 1
Fixed misspeci…cation of B
Let f be the density of a multivariate normal distribution Np ( ; ) with conditional parameters ; B and D. Denoting by B the matrix with additive perturbations on B and f B the B , corresponding perturbed density Np ; where B
B)
B
1 T
D(Ip B
B)
1
(see (Susi, Navarro, Main and Gómez-Villegas, 2009)), the KL divergence for comparing two covariance matrices when the means are equal is i 1h 1 B B DKL fB j f = p . trace 2 (1) It should be noted that as Ip B and Ip B B are upper triangular matrices with diagonal j Bj entries equal to one then ln j j = 0. Now, given that B
i=1
being f the density function with the perturbed covariance matrix + , i (i = 1; :::; p) each of the columns of , with the necessary restrictions to get symmetric and positive de…nite
(Ip
1
= Ip
B (Ip
B)
trace
(Ip
(Ip 1
1
B)
+
1 T BD
and
= trace
B) B (Ip
1 T
B)
T B 1
= ;
T B+ 1 T B
trace
B (Ip 1
= trace
B)
1
B (Ip
1
B)
the form:
= 1
B;i DKL f B;i j f =
the divergence in (1) can be restored as
1 B) 1 + = [p 2trace B (Ip 2 1 T +trace p] = BD B 1 1 T tr = = BD B 2 1 T 1 = tr . B BD 2
(2)
Note that (Ip B) 1 is an upper triangular matrix with diagonal entries equal to one and B) 1 is an upper triangular matrix B (Ip with diagonal entries zero. Under the same assumptions, if (i) denotes an (i 1)-dimensional vector of local errors in node i — produced by an erroneous estimation or elicitation of the node i with its parents relationships, the perturbation matrix on B, with only this error source is 0 1 i B C 0 0 C (i)1 B 0 B . . .. .. .. C B .. . . ... . . . C B C B C 0 (i)i 1 0 C B 0 C: B;i = B 0 0 0 C B 0 B . .. .. .. .. C .. B . C . . . . . . C B B C 0 0 0 A @ 0
Thus, denoting f B;i as the density with coe¢ cients matrix B + B;i , the e¤ect on the joint distribution can be expressed by
i 1 1 X = 2vi
1h tr 2
(i)k
tr
T B;i
B;i D
T (i 1)k
(i)k
1
,
(i 1)k ; (i)
(i)k
=
k=1
1 T = (i) = 2vi (i) (i 1) 1 2 = U(i 1) (i) 2 2vi
B DKL fB j f =
B;i DKL f B;i j f =
i 1 1 X 2vi
i
=
(3)
k=1
i = 2; ::::; p , being (i 1)k the k-th column of the submatrix (i 1) built with the …rst i 1 rows and columns of . The local perturbation divergence in (3) also may be written in
with U = (Ip B) 1 and the submatrix U(i 1) determined by the …rst i 1 rows and columns of U. Returning to the measure of interest, B DKL f B j f in (2), it can be immediately obtained that B DKL
f
B
=
jf = 1 2
p X i=2
p X i=2
1 vi
B;i DKL f B;i j f =
T (i)
(i 1)
(i)
.
(4)
Then, the total e¤ect can be expressed as the sum of individual e¤ects and consequently, the global sensitivity analysis can be performed through local analyses of nodes. Some direct results may be useful in applications: If all the components in it follows B;i DKL
f
B;i
jf =
(i)
are equal to ,
i 1X i 1 2 X
2vi
tk
k=1 t=1
The possibly erroneous arc deletion from node j to node i having bji 6= 0, would yield B;i DKL f B;i j f =
1 2 b 2vi ji
jj
The e¤ect of arc inclusion from node j to node i introducing bji is also B;i DKL f B;i j f =
1 2 b 2vi ji
jj
These last two cases describe the impact of the conditional and marginal variances for an uncertain knowledge of the exact model giving the distance between DAGs obtained by adding or removing arcs.
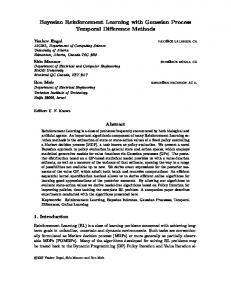
Figure 1: DAG with regression coe¢ cients on the arcs Example 1. Let us consider the GBN in Figure1 with parameters: 0
B B B B = 0; B = B B B B @
0 0 0 0 0 0 0
0 0 0 0 0 0 0
0 0 0 0 0 0 0
1 2 0 0 0 0 0
0 2 1 0 0 0 0
0 0 0 2 2 0 0
0 0 0 0 0 1 0
1 C C C C C C C C A
D = diag (1; 1; 2; 1; 4; 1; 2) : Using that = [(I7
B)
1 T
] D(I7
the covariance matrix is 0 1 0 0 1 B 0 1 0 2 B B 0 0 2 0 B =B B 1 2 0 6 B 0 2 2 4 B @ 2 8 4 20 2 8 4 20
0 2 2 4 10 28 28
B)
2 8 4 20 28 97 97
2 8 4 20 28 97 99
1
1
C C C C C: C C C A
The divergences re‡ecting the e¤ect of each arc removal are shown in Figure 2. It is observed that divergence increases as the depth of the node grows with a maximum in the arc from X6 to X7 . Therefore, it gives us information about
Figure 2: Measure of deviation for each arc removal
the di¤erence between the original GBN and the particular networks obtained by means of the cancellation of some regression coe¢ cients.
3
The random case
The expression (4) relates easily, global e¤ect to local errors e¤ects due to no interaction. Now, we are going to replace the hypothesis that B is known by the assumption that it is a random matrix. The main aim is using the relation (4) to evaluate the impact of uncertainty in B for a GBN. Both this measure and its value for di¤erent nodes can be useful to point the most sensitive nodes so as to compare structures with respect to uncertainty sensitivity. If we suppose each vector (i) is distributed independent from the remaining errors as Ni 1 (0; Ei ) ; i = 2; :::; p, while the common value v1 = v2 = = vp = v is known, each T random variable (i) (i 1) (i) is a quadratic form in normal variables with a chi-squared distribution with i 1 degrees of freedom 2(i 1) , if and only if Ei (i 1) is a symmetric idempotent matrix of rank i 1 (Rencher, 2000). Also, if Y is a random vector with mean vector , covariance matrix and Mp p is a nonrandom matrix, then (Rencher, 2000) E(YT MY) =
T
M + tr(M )
V ar(YT MY) = 4
T
+2tr((M )2 ). (5)
M
Thus, it results that the mean of the random B variable DKL f B j f is B DKL
E
f
B
p 1 X = tr 2v
jf
(i 1) Ei
.
i=2
If we express the covariance matrix Ei in terms of the di¤erence with (i 1 1) , that is Ei =
1 (i 1)
+ Ai ,
then tr
= tr I(i
(i 1) Ei
=i
1)
+
1 + tr
=
(i 1) Ai (i 1) Ai
.
It follows immediately that for a positive semide…nite matrix Ai — it could be denoted by Ei "larger than" (i 1 1) — the minimum mean impact is obtained when Ai = 0 being k = 1 p 1) a lower bound for the mean impact 2v 2 (p of all the matrices Ei larger than (i 1 1) . Moreover, imposing Ei =
1 (i 1)
we could assure each
1 2 summand is distributed as a 2v (i 1) because Ei (i 1) = Ii 1 is a symmetric idempotent matrix of rank i 1. The lower bound k can be considered to de…ne the mean relative sensitivity by Pp B tr (i 1) Ei E DKL fB j f = i=2p , k 1) 2 (p
whenever Ei "larger than" sumed. 3.1
1 (i 1)
could be as-
Independent errors
When the hypothesis of independent errors with common variance 2 can be accepted, that is Ei =
2
I(i
1) ;
i = 2; :::; p ,
using (5), the quadratic forms of each component have …rst and second order moments given by: E V ar
T
(i 1)
(i)
T (i)
(i)
(i 1)
= (i)
2 tr
(i 1)
= 2 4 tr[(
2 (i 1) ) ]
Figure 3: Node divergence from node 2 (red) to node 7 (yellow) and global divergence (black)
Consequently, under the stated conditions, we obtain an increasing average e¤ect according to node depth in the network, independently of the network speci…cation. Figure 3 illustrates the random behavior of Kullback-Leibler divergences displaying the empirical cumulative distribution function (ECDF) for samples from 1 2v
T (i)
(i 1)
(i)
, i = 2; :::; 7 ,
as well as the random global e¤ect for the example discussed above. We have used a simulated sample of size 100; 000, with v = 1 and 2 = 5, for each case. In this setting, a reasonable procedure to evaluate sensitivity to uncertainty in B is to analyze the normalized ratio S B (f )
B DKL fB j f =
2
,
that can be interpreted as the distribution variation in terms of the uncertainty variation. ObB viously, the random divergence DKL fB j f 2 changes with ; Figure 4 shows the ECDFs behavior for some 2 values in Example 1, exhibiting an apparent dominance relation. Nevertheless, the mean as well as the variance of S B (f ) do not depend on 2 ; more concretely
Example 2. For the GBN in Example 1 it is obtained E S B (f ) = 63 Using (6), the numerical results by nodes are (2) 0.008, (3) 0.016, (4) 0.024, (5) 0.071, (6) 0.12, (7) 0.76
Figure 4: Empirical cumulative distribution function of Kullback-Leibler divergences for GBN in Example 1 with di¤erent independent errors: "2 = 0:5 (black), 1 (red), 2 (green), 5 (dark blue), 10 (light blue) E S B (f ) =
Pp
1 2v
i=2 tr
1 2v 2
V ar S B (f ) =
(i 1)
Pp
2 (i 1)
i=2 tr
Relying on the moments invariance we propose to evaluate the GBN sensitivity to uncertainty in B by
E S B (f ) =
p 1 X tr 2v
(i 1)
ii (p
i);
i=1
where ii denotes the variance of Xi . Then, the relative contribution of each node to the total sensitivity measure will be given by tr Pp 1 i=1
(i 1) ii (p
i)
:
4
Conclusions
The factorization of the joint distribution in GBN leads us to an additive decomposition of the Kullback-Leibler divergence. Then, for misspeci…ed regression coe¢ cients, the weight each node has in the global deviation of the initial structure can be determined. Modelling uncertainty with independent random errors provides a highly simpli…ed analysis to achieve an uncertainty sensitivity measure de…nition that can be easily handled. Acknowledgments
=
i=2
p 1 1 X = 2v
Here the most important values are the contribution of the nodes to the global mean normalized divergence, resulting a signi…cantly large in‡uence for node (7) compared to the rest of nodes in the DAG. Therefore, independent random errors in the regression coe¢ cients of nodes (1) to (5) do not describe very di¤erent joint models, however, that is not the case for node (7) and some e¤ort has to be made to bring some additional information to asses the correct regression coe¢ cient value.
(6)
This result enables us to classify nodes according to greatest contribution to global sensitivity.
This research has been supported by the Spanish Ministerio de Ciencia e Innovación, Grant MTM 2008.03282, and partially by GR58/08A, 910395 - Métodos Bayesianos by the BSCHUCM from Spain.
References E. Castillo and U. Kjærul¤. 2003. Sensitivity analysis in Gaussian Bayesian networks using a symbolic-numerical technique. Reliability Engineering and System Safety, 79:139-148. M.A. Gómez-Villegas, P. Main, R. Susi. 2007. Sensitivity Analysis in Gaussian Bayesian Networks
Using a Divergence Measure. Communications in Statistics: Theory and Methods, 36(3):523–539. M.A. Gómez-Villegas, P. Main and R. Susi. 2008. Sensitivity of Gaussian Bayesian Networks to Inaccuracies in Their Parameters. Proceedings of the 4th EuropeanWorkshop on Probabilistic Graphical Models, pages 145–152. A. Rencher. 2000. Linear Models in Statistics. New York : Wiley. R. Shachter and C. Kenley. 1989. Gaussian in‡uence diagrams. Management Science, 35:527–550. R. Susi, H. Navarro, P. Main and M.A. GómezVillegas. Perturbing the structure in Gaussian Bayesian networks. 2009. Cuadernos de Trabajo de la E.U. de Estadística, CT01/2009: 1–21. http://www.ucm.es/info/eue/pagina/cuadernos _trabajo/CT01_2009.pdf.