facilities. In the context of software development, debugging support is provided by .... plications to Google Android code are instrumented such that backward links ... Execution Modes To our knowledge, every IDE debugger has provisions to.
Debugging in Domain-Specific Modelling †
Raphael Mannadiar and
†,‡
Hans Vangheluwe
Modelling, Simulation and Design Lab † McGill University 3480 University Street Montr´eal, Qu´ebec, Canada
‡ University of Antwerp Middelheimlaan 1 2020 Antwerpen, Belgium
Abstract. An important obstacle to the wide-spread adoption of ModelDriven Development (MDD) in industry is the lack of proper debugging facilities. In the context of software development, debugging support is provided by a combination of language and Integrated Development Environment (IDE) features which enable the monitoring and altering of a running program’s state. In Domain-Specific Modelling (DSM) however, debugging activities have a wider scope: a model transformation designer needs to debug transformations and/or synthesized artifacts. A domainspecific modeller needs to debug models at the level of models and not at the level of synthesized code. In this work, we survey the current state-of-the-art of debugging in the context of DSM. We then propose a conceptual mapping between debugging concepts such as breakpoints and assertions in the programming world and the DSM world.
1
Introduction
Domain-Specific Modelling (DSM) allows domain-experts to play an active role in (software) development efforts. It provides them with means to manipulate constructs they are familiar with and to automate the error-prone and timeconsuming conceptual mapping between the (often very distant) problem and solution domains. Empirical evidence suggests increases in productivity of up to one order of magnitude when using DSM and automatic artifact synthesis as opposed to traditional code-driven development approaches [14, 10, 13]. Model transformations can be used to specify the semantics of DomainSpecific Languages (DSLs) by either defining an interpreter (operational semantics) or by mapping onto formalisms whose semantics is well understood (such as Petri Nets, Statecharts, Differential Equations or code). Numerous model transformation techniques exist ranging from explicit, operational to rule-based, declarative approaches. Czarnecki and Helsen provide a comprehensive and detailed feature-based classification in [6]. In this work, we restrict ourselves to rule-based approaches. In these approaches, model transformation models are composed of a collection of rules. Each of these have a left-hand side (LHS) pattern, a right-hand side (RHS) pattern and optionally a negative application condition (NAC) pattern, condition code, and action code. The LHS and NAC R. Mannadiar and H. Vangheluwe. Software Language Engineering., pp. 1–20, 2010. c Springer-Verlag Berlin Heidelberg 2010
2
†
Raphael Mannadiar and
†,‡
Hans Vangheluwe
patterns respectively describe what sub-graphs should and should not be present in the source model for the rule to be applicable. The RHS pattern describes how the matched LHS pattern should be transformed by the application of the rule. Further applicability conditions may be specified within the condition code, while actions to carry out after successful application of the rule may be specified within the action code. The typical work flow of a DSM project consists of the specification of one or more DSLs and of the model transformations that define their semantics. Subsequently, Domain-Specific models (DSms1 ) are created. In practice, models, model transformations, and synthesized artifacts may require debugging and thus appropriate debugging facilities are needed. In Section 2, we survey the current state-of-the-art of debugging in the context of DSM. In Section 3, we review common debugging concepts such as breakpoints and assertions from the programming world. We then map these concepts onto the DSM world in Section 4. Finally, future work is discussed in Section 5. The main contributions of this work are our comparison-oriented mapping of debugging concepts from the programming world to the DSM world and the demystification of the amount of effort required to produce DSM debuggers.
2
Related Work
Very little attention has been paid to debugging in DSM. In [14, 10], several industrial applications of DSM are presented. In all of these, the debugging of the models, of their associated ad hoc generators, and of the synthesized artifacts is accomplished without any tool support. More importantly, debugging is invariably performed at the code level rather than at the model level. This, despite being DSM efforts motivated by the general philosophy of improved productivity through the manipulation of domain-specific concepts. Debugging deals only with synthesized artifacts and modelling tool APIs (e.g., functions for viewing and manipulating internal representations of model entities). In the sofware realm, this would be equivalent to debugging compilers and bytecode to find and resolve issues in an Object-Oriented (OO) program. The most advanced DSm debugger to-date is that presented by Wu et al. in [21]. Their approach allows the re-use of existing, tried and familiar debugging facilities. By enabling the hidden and automatic construction of a detailed mapping between model entities and synthesized code, the approach allows the designer of textual DSms to use Eclipse’s built-in debugging facilities. Thus, the domain-specific modeller is given means to set breakpoints within the domainspecific code, to pause/resume execution and more, without requiring any prior 1
Note that we refer to domain-specific modelling as DSM and to a domain-specific model as a DSm.
Debugging in Domain-Specific Modelling
3
knowledge about the synthesized code or the code generator. From a tool implementer’s point of view, the main advantage of this technique is that it does not require the implementation of a new debugger from scratch. However, the approach is currently limited to textual languages, restricts the modeller to the Eclipse tool, and assumes that the generated artifacts are code. Also, the approach does not consider the debugging of the transformations that generate artifacts from models. In [12], we laid the basis for extending Wu et al.’s work to visual modelling languages. Graph transformation rules that translate DSms of mobile device applications to Google Android code are instrumented such that backward links (also known as traceability links) are maintained between constructs at different levels of abstraction. Ultimately, these links are realized in the form of code. Running the synthesized applications (either in an emulator or on a Google Android device) causes the associated DSm, displayed within a visual modelling tool, to be animated and it state updated. In the approach described in this paper, the above-mentioned backward links can be further exploited and used as “forward links” to propagate debugging commands such as break and update value to running applications. Tools such as AToM3 [7] enable some form of transformation debugging via step-by-step rule execution. Instead of having transformations always run to completion, these tools allow the execution of rules one at a time, the manual selection of which rule to execute in cases where multiple rules are simultaneously applicable, the choice of which of multiple matches to transform, and even the modification of the source model between rule applications. This enables the rule designer to observe the effects of each rule in isolation and to perform some form of transformation debugging. However, more advanced functionality such as “pause the transformation when rule ri is encountered” or “when a pattern p appears in the destination model” are not natively supported. Finally, in [16], Syriani et al. propose the modelling of exceptions and their handlers at the level of abstraction of Model Transformation Languages (MTLs). They propose a categorization of model transformation exceptions and extend a control flow environment for rule execution with provisions for specifying exception handlers. Their technique for the modelling of flow interruptions by exceptions can readily be extended to model flow interruptions caused by debugging commands as well as the specification of arbitrary breakpoints within the transformation model. This possibility will be further explored in Section 4.1.
3
Debugging Code
Debugging forms a central part of any programming effort. Several authors have looked into common sources of bugs, into what makes certain bugs more insidious than others, and into popular debugging activities [8, 22]. Not surprisingly,
†
4
Raphael Mannadiar and
†,‡
Hans Vangheluwe
presenting information about program state as well as hand-simulation (i.e., interrupting execution and stepping through code) are often used for tracking down and resolving bugs. Means to carry out these activities are thus commonly found in modern programming languages and Integrated Development Environments (IDEs). Below, a brief overview is given of the most common debugging facilities featured in OO languages and popular IDEs. 3.1
Language Primitives
The following concepts are commonly used to create a “poor man’s debugger” when a full-fledged debugger is not available. Print Statements The central part of every programmer’s2 first program: “Hello World!”. Print statements are commonly used to output variable contents and to verify that other statements or code blocks are executed. Assertions A slightly more advanced feature than print statements, assertions enable programmers to verify that arbitrary conditions are satisfied at a given point in the program’s execution. Assertions traditionally have two particularities. The first is that they cause the execution to be aborted when their condition fails. The second is that the source language or its compiler usually provide means to enable or disable assertions (e.g., Java’s compiler has a flag to enable assertions, compiling C++ in “release” mode rather than “debug” mode disables assertions). This implies that assertions are not required to be removed or commented out (as is the case with print statements) in order to avoid undesired output or computation in deliverables. Exceptions Exceptions, the third and most advanced enabler for debugging commonly found in programming languages, are thrown at runtime to indicate the system is in a problematic state. An exception encapsulates information on the system’s state (exception context) as well as on the problem that occurred. Numerous exceptions are built into languages to report events such as I/O problems and null-pointer dereferencing. Exceptions may halt the execution of a program. Programmer-defined exception handlers may however catch an exception and attempt to take appropriate action (such as recover from the identified problem), forward them higher along the call stack or gracefully terminate. Lastly, provisions for defining new types of exceptions are also usually made available to programmers to enable support for application-specific exceptional situations. 3.2
Debugger Primitives
The following facilities are commonly provided in modern IDEs. 2
In the following, the term programmer is loosely used to describe both the code’s implementer and the person debugging it.
Debugging in Domain-Specific Modelling
5
Execution Modes To our knowledge, every IDE debugger has provisions to execute a program continuously (i.e., until either termination or user interruption) or step-by-step (i.e., one program statement at a time). “Stop” and “pause” commands allow for the terminating or non-terminating halt of the execution respectively. When the execution is paused, the user (re-)enters continuous mode using a “play” command or the step-by-step mode using the “step” command. It is important to note however that most IDE’s enable programmers to run their code in release mode (as opposed to debug mode) in which case only playing and stopping functionality is available. Steps There are usually three step commands: step over, step into and step out (or step return). The first executes the current statement as one atomic block. The second tells the debugger to display the execution of any sub-statements (e.g., function calls) contained within the current statement. Stepping into substatements implies a change of scope. Moreover, certain debuggers allow stepping into seemingly atomic constructs into their corresponding lower-level representations. For instance, it is possible in Eclipse to step through Java bytecode. The available level of granularity (or abstraction level) is obviously dependent on tool support and programming language implementation. Finally, stepping out tells the debugger to run until it has exited the current scope and is one level higher in the call stack. Runtime Variable I/O IDE debuggers usually provide means to read (and change) global and local variables when the program’s execution is paused. This feature effectively removes the need to insert debugging-related print statements into the code. To our knowledge, no popular debugger imposes any constraints (beyond basic type constraints) on the values one can assign to variables when the execution is paused. Breakpoints Breakpoints allow the programmer to specify when the debugger should interrupt normal program execution. This avoids having to step through the code line by line. Breakpoints are commonly set on statements indicating that the execution should be paused before the debugger executes the given statement. Most debuggers also support associating hit counts or boolean conditions with breakpoints. These respectively enable the programmer to specify that a breakpoint should only halt the execution when the statement has been executed some arbitrary number of times or if an arbitrary condition over the state (context) is satisfied. Jump To Certain debuggers allow the programmer to “jump” from the current statement to some other statement without executing the statements in between. This is akin to changing variable values where the variable in question is the program counter. In other words, the debugger’s state rather than the program’s state is what is being modified. Though this feature may be convenient,
6
†
Raphael Mannadiar and
†,‡
Hans Vangheluwe
it may bring the program into an unstable state. Stack Traces Stack traces allow the programmer to see which function calls led the program into its current state. Stack traces become visible when the execution is paused. Most debuggers support navigating from the current context to that of any other level in the stack trace for variable viewing and editing purposes. The concepts above are by no means an exhaustive list of all debugging facilities available to modern programmers. However, together they form an effective basis for writing debugable code and debugging it.
4
Debugging in DSM
The development process in DSM has two important facets: (1) developing models and (2) developing model transformations – which may describe a formalism’s operational semantics, or transform DSms into lower level (i.e., closer to code) models or artifacts –. These two facets introduce two very important differences between the programming and DSM worlds. The first is that, in the latter realm, the artifacts to debug are no longer restricted to code but also include handcrafted models, model transformations, synthesized models and other arbitrary non-code artifacts. The second is that the counterparts of the common DSM activities of designing and debugging model transformations – which are respectively designing and debugging code compilers/interpreters – are both rare and specialized activities in the coding realm. In the following section, we explore how the previous concepts translate into the debugging stages of both facets of DSM development. 4.1
Debugging Transformations
One could easily argue that the number of programs to debug (and their domains) is orders of magnitude larger than the number of existing compilers and interpreters for the languages these programs are implemented in. This is a sideeffect of the nature of General Purpose programming Languages (GPLs) which are designed to enable programmers to develop applications for an unbounded set of domains. Domain-specific modelling languages, however, target restricted domains and as such the number of DSLs is much more closely related to the number of DSms. To carry any meaning and be anything more than metamodels for blueprints, DSLs must have associated operational or denotational semantics which the Model-Driven paradigm dictates should be specified as model transformations [4]. Operational semantics can be described as a collection of rules each describing the transformation between valid system states (e.g., for Petri Nets, a rule describes the model before and after the firing of an enabled transition). Executing these rules effectively executes/interprets/simulates the model. As for denotational semantics, they essentially define the meaning of a DSL by
Debugging in Domain-Specific Modelling
7
mapping its concepts onto other formalisms for which semantics are well defined. A common approach in DSM is to encode the denotational semantics mapping within code generators that transform DSms to code3 [14, 10]. We demonstrated in [12] that modelling this mapping onto intermediate modelling formalisms (as opposed to directly onto code) is modular, adheres closely to the Multi-Paradigm Modelling (MPM) philosophy [7], and considerably facilitates debugging by easing the specification, display and maintenance of backward links between models and synthesized artifacts. Regardless of the type of semantics the DSL designer and/or model transformation modeller require, the resulting transformation model will describe a flow of rule applications which may require debugging. Below, we re-visit the debugging concepts described in the previous section and see how they translate to model transformation debugging. Print Statements A contrived means of reproducing print statements for model transformations is to create rules with their action code set to appropriately parameterized calls to output functions in a supported action language (e.g., Python). Such a rule could be permanently enabled allowing it to be run as needed by the modeller4 or it could specify a pattern causing the printing to occur only when the given pattern is matched. Unfortunately, this technique is not void of accidental complexity: the LHS and RHS patterns would need to be identical to avoid modifications to the source model which further implies that means to prevent the rule from looping forever might need to be included in the action code and/or as NAC patterns. A similar but neater and more domainspecific solution would be to enhance MTLs with printing functionality. This could be done by augmenting traditional rules with a “printing code” parameter or by introducing special “print rules” that could be included within the transformation model (e.g., a print rule rprt could be inserted between rules ri and rj as shown in Fig. 1). In the latter case, the print rules would have only three parameters: a single pattern (as opposed to the two patterns in traditional rules), condition code and printing code. The natural semantics of such rules would be to execute the printing code if the condition code is satisfied when the pattern is found in the host model. Print rules could easily and automatically be translated to the contrived traditional rules described above using higher-order transformation rules5 such as to leave the transformation execution engine unchanged. Although it may seem counter-intuitive to support a language construct whose usefulness is mostly restricted to debugging purposes, we should remember that print statements (whose usefulness is mostly restricted to debugging purposes) are supported in every modern GPL. 3
4 5
Note that non-code artifacts such as configuration files, documentation, and models may also be synthesized. This requires tool support for manual on-the-fly rule selection. Rules that take other rules as input and/or output.
8
†
Raphael Mannadiar and
†,‡
Hans Vangheluwe
Fig. 1: An example transformation model where a print rule prt is inserted between traditional rules i and j.
Assertions Assertions in transformation models can be implemented in a very similar manner as print statements. The conditions they are meant to check can be encoded in rule condition code or as patterns. In [16], Syriani et al. propose specifying assertions in just this manner; in case of failure, the rule’s action code throws a user-specified exception that either interrupts and terminates the execution of the transformation or is caught and handled by exception handlers specified at the transformation language level. Unfortunately, forcing the modeller to reproduce assertions using the default rule mechanism carries the same limitations as those mentioned for print statements, namely the necessity for identical RHS and LHS patterns and for loop prevention action code and/or NAC patterns. A similar solution applies though: enhancing the MTL with special “assertion rules” (see Fig. 2a) that could be sequenced arbitrarily with other rules. Analogous reasoning applies regarding their parameters and the validity of their inclusion in a MTL. An added benefit of this approach is that it would facilitate the implementation of the crucial assertion property mentioned earlier: the ability to enable and disable assertions without having to comment, remove or alter them. Achieving this using contrived rules may be possible by coming up with fancy action code but is clearly a less elegant solution. Furthermore, more advanced modelling tools could support hiding and unhiding assertions to improve the transformation model’s readability. Such features would be increasingly difficult to implement if assertions where indistinguishable (or less distinguishable) from common rules. Exceptions Exceptions and their handlers in the context of model transformation debugging were extensively studied in [16]. Syriani et al. provide a classification of several relevant exceptions ranging from synchronization problems brought on by incorrectly parallelizing transformations to action language errors, and even support the creation of user-defined exception types. They propose enhancing MTLs with exception handler rules to which traditional rules can be sequenced to in case of exceptions (as shown in Fig.2b). The applicability of these handlers is specified via patterns and/or constraints. Execution Modes As mentioned in Section 2, the transformation engines in tools such as AToM3 natively support continuous and step-by-step execution
Debugging in Domain-Specific Modelling
(a)
9
(b)
Fig. 2: (a) An example assertion rule. Sensible behaviour would be for an exception to be fired if the pattern is found but the condition fails. (b) Modelling resuming, restarting and terminating after handling an exception.[16]
modes. In the former, the transformation is executed until none of its rules apply with user input optionally solicited when more than one rule applies simultaneously. In the latter mode, after every rule application the user is prompted to run the remainder of the transformation in continuous mode or to step over a single applicable rule. To our knowledge, only the Visual Modeling and Transformation System (VMTS) [11] offers means to pause the execution of an ongoing transformation. The meaning of such an action is not as trivial as it may seem. Pausing the transformation exactly between the application of two rules should provide the user with means to continue in either continuous or step-by-step mode. However, if the pause request were to be triggered during the application of a rule, what should be the appropriate response? In a system where rule application is implemented following a transactional approach, sensible behaviours might be to let the current rule complete or to roll-back to before its application before pausing. In a system based on T-Core [19] where rules may not only be composed but also decomposed into primitive operations (e.g., match, rewrite), ideal behaviours might be to pause the execution before invoking the next primitive operation. A third option is immediate interruption. Either choice has its merits; the only truly important concern is the nature of the debugging information that is made available to the modeller when the execution has paused. Thus, it seems unreasonable to offer immediate interruption in a context where rule application is atomic and no means of observing the intermediate state of the system are available. Finally, it may be desired to run a transformation in debug or release modes. As in the context of code debugging, pausing and stepping functionality should only be enabled in debug mode. Steps The notion of stepping over in the context of rule-based model transformations is trivial. It corresponds to the execution of one, possibly composed, rule. Stepping into, however, is very dependent on the features of the MTL and
10
†
Raphael Mannadiar and
†,‡
Hans Vangheluwe
engine – much like the aforementioned pause feature –. For instance, in languages like MoTif [18], GReAT [2], QVT [1], VIATRA [20] and VMTS which support rule composition, stepping into a composite rule would conceivably allow the modeller to “enter” the rule and execute its sub-rules one at a time. This process could of course be repeated recursively in the event of several layers of composition. For more advanced languages like MoTif-Core [19] – or any other language based on T-Core for that matter – where rules are no longer atomic blocks but are instead arbitrarily composed sets of primitive components such as “matchers” (which locate a rule’s pre-condition pattern in the host graph), “rewriters” (which effect the transformation of a given match into the rule’s postcondition pattern) and “iterators” (which choose one match for the rewriter to work on given several matches reported by the matcher), it is sensible for the modeller to be able to step into even a non-composite rule. Doing so would enable him to execute each primitive in turn and possibly perform such actions as modifying a match before it is given to the rewriter. Finally, stepping out obviously only makes sense for MTLs and engines where stepping into is meaningful. In such languages, stepping out would perform a very analogous task to that which it performs in code debugging. Stepping out of a composite rule would cause the continuous execution of any remaining rules within the composite rule while stepping out of an “exploded” T-Core rule would cause the continuous execution of any remaining primitives within that rule. Runtime Variable I/O The notion of what is a variable per se in the context of model transformations is unclear. The parameters of a rule or the sequencing of the rules themselves may all be considered variables. Thus, when the execution is paused, the modeller could choose to edit LHS and RHS patterns, condition code, action code and even the scheduling of the transformation rules – provided he has access to it –. All of the previous propositions share a crucial requirement though: if the rules and/or the transformation model need to be compiled before they can be executed by the transformation engine, modifying either of them on-the-fly might be unfeasible6 . This is of course analogous to modifications to running C++ or Java code being ignored by IDE debuggers until the next compilation. Control flow- (e.g., GReAT, MoTif) and T-Corebased languages lend themselves more intuitively to traditional runtime variable I/O operations because of their notions of inputs and outputs. It is conceivable that the modeller may want to observe or change the inputs or outputs of a rule or a T-Core primitive. This implies that a model transformation debugging tool should clearly expose these variables and offer means to modify them. Ideally, this should be done at the appropriate level of abstraction. For instance, if the modeller wants to observe the pattern given to a T-Core rewriter block, this pattern should be represented using domain-specific constructs rather than in some internal format. Similarly, if the modeller wants to modify a pattern, he should be provided with a domain-specific model editor pre-loaded with appro6
To our knowledge, no existing modelling or model transformation tools currrently support on-the-fly rule scheduling modifications.
Debugging in Domain-Specific Modelling
11
Fig. 3: An example breakpoint and its property dialog.
priate metamodels. Finally, as for code debuggers, ensuring that modifications don’t leave the system in an unstable state is a desired but complex task. In this context, one such verification could be to ensure that the modified input of a T-Core rewriter block still contains exactly one instance of the specified pattern to match. Breakpoints Breakpoints very intuitively translate to the model transformation debugging world. Given proper tooling, breakpoints could be associated to composite rules, non-composite rules and primitive T-Core blocks causing the execution to pause when they are encountered. Hit counts and boolean conditions (written in a supported action language) could conceivably be specified in the same manner as in code IDEs. Figure 3 suggests a possible rendering of a breakpoint annotating a rule. Jump To The jump to operation also readily translates to the model transformation debugging context. Rather than jumping to arbitrary statements, the modeller could move to arbitrary rules. This feature is of course dependent on the debugging tool clearly identifying the next rule to execute and providing means for the modeller to modify the scheduling on-the-fly – which as we’ve mentioned earlier remains beyond the capability of current tools –. As in the code world, jumping can easily lead the system into unstable and unexpected states. Stack Traces Like the stepping into and out operations, the availability of stack traces and their meaning depend on the MTL and engine; specifically, on their levels of granularity. Hence, for languages where rules can neither be composed nor decomposed, stack traces would do little more than report the current rule and would thus be of very little use. However, for more complex languages, they would enable the modeller to navigate between the contexts of sub-rules and their parent composite rules, or between the contexts of T-Core primitives and their enclosing rule.
†
12
4.2
Raphael Mannadiar and
†,‡
Hans Vangheluwe
Creating Debuggable Artifacts
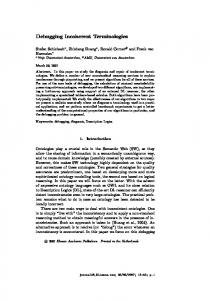
Before proceeding to map code debugging concepts onto the realm of debugging DSms and artifacts, we briefly overview the technique for artifact synthesis from DSms we present in [12]. As we have already hinted above and will often repeat below, the availability of backward links between corresponding constructs at different levels of abstraction greatly facilitates numerous complex activities including debugging. They accomplish this by, amongst other things, enabling elegant two-way information propagation between DSms and generated artifacts, and providing implicit and navigable relationships between related concepts. In [12], we proposed a means of generating backward links between DSms of mobile device applications, generated Google Android code and intermediate representations in between. Our technique is based on triple graph rules (TGRs)[15], which essentially provide means of generically relating constructs in source (i.e., LHS) and destination (i.e., RHS) rule patterns. Thus, by describing the denotational semantics of our DSms with a collection of TGRs, we are left with a web of traceability links that connect related elements at all levels of abstraction. Figure 4 shows four different perspectives of the same system: a conference registration application modelled in our DSL for mobile devive applications, a generated model which contains only the layout-related aspects of the DSm, a generated Statechart [9] which contains only the behavioural aspect of the DSm, and a trivial generated model of the to-be-generated files on disk. Connecting the four subgraphs is a complex network of correspondence links that reflects the application of numerous TGRs. This web of connections is quite obviously not intended for direct human consumption. However, as we will discuss in more detail in Section 4.3, it can considerably facilitate the implementation of numerous components of a DSM model and artifact debugger. 4.3
Debugging Models and Artifacts
Despite the importance and need for model transformation debugging facilities, they may not be sufficient for debugging models whose semantics are specified denotationally. Indeed, running such models implies the execution of the synthesized artifacts7 rather than of model transformations. Although not always the case in academic DSM efforts, it is sensible to assume that in industry, DSLs and their semantics will often be defined by actors different than the end-users of the DSLs. Similarly, most C++ and Java programmers did not play active roles in the development of those languages nor of their compilers. Thus, in the following section, we distinguish between two types of users. Designers are fully aware of the model transformations that describe the semantics of their models and generate lower level artifacts. On the other hand, modellers have an implicit understanding of the semantics of their models but have little or 7
Although numerous non-executable artifacts can be generated from DSms, we restrict our attention here to programs and models.
Debugging in Domain-Specific Modelling
13
Fig. 4: Four perspectives of the same conference registration mobile device application connected via traceability links.
no knowledge about how their models are given these semantics. Nevertheless, they should be aware of the end-products generated from their models – why else would they bother creating them? –. As a concrete example, consider a DSL for modelling mobile device applications such as the one presented in [12]. A designer should be aware of the DSm, the generated lower level models, Java and XML code, and running application on a target device. A modeller should however only be concerned with his DSm and the generated running application. As a consequence of their different expertise, the debugging scenarios for designers and modellers differ. Designer artifact debugging is akin to programmer bytecode debugging. The goal is to ensure the correctness of the output of the model transformations. Modellers on the other hand may assume that the model transformations applied to their models are flawless and must instead establish the correctness of their models. Thus, their task is more akin to traditional code debugging but with model and executing artifact being compared instead of code and executing program. In both debugging scenarios though, the basic work flow will entail observing the evolution of the model with respect to the evolution of the synthesized artifact with the designer possibly paying special attention to intermediate representations, if any. Note that we assume that DSms change their state as a result of artifact execution. This idea stems from program debugging where variables take on values (that can be viewed using runtime variable I/O
14
†
Raphael Mannadiar and
†,‡
Hans Vangheluwe
debugger facilities) and change dynamically as a result of program execution. A formal discussion on how to implement this feature in the context of models and artifacts is beyond the scope of this paper. However, the approach for artifact synthesis we present in [12] and reviewed in Section 4.2 enables the sort of two-way communication between model and artifact that would be required. Below, we re-visit the debugging concepts described in the previous sections and translate them to DSm and artifact debugging. Print Statements Print statements seem less useful in this context. For one, most modern DSm editors offer means to display pertinent information as part of the concrete syntax of modelling constructs. It is for example common in Petri Net editors for the graphical representation of a place to include its current number of tokens. Moreover, model editors allow for easy reading (and writing) of construct parameters. Nevertheless, it is conceivable for a modeller or domain expert to require explicit output for debugging purposes. A similar solution to the one proposed for the model transformation context applies. DSM tools could provide means to specify print rules that output arbitrary information about models upon detecting conditions specified by the modeller in the form of patterns (e.g., state s is enabled, any place contains at least than i tokens). Recall though that modellers may have no knowledge about model transformations and might need to be introduced to the foreign concepts of rule patterns, conditions and actions. An added challenge from a tool implementer’s point of view is that means to verify rule applicability and execute them concurrently with model execution8 would be required. Print rules as we describe them here are very powerful: they can essentially print anything, anytime. However, they are somewhat orthogonal to the rest of the DSm creation process. A better solution might to be (semi-)automatically integrate appropriate output constructs in DSLs themselves at DSL design time. This solution is indeed more closely related to what we propose for MTLs and what is done in GPLs. Assertions Assertions can be thought of in a very similar manner as print statements: they can be implemented via orthogonal assertion rules or as explicit DSL constructs. The main differences are that provisions to enable and disable them should be provided, and that they may halt the execution of the model when fired. The latter implies that means to halt the execution of running artifacts are required. For code artifacts, this might be accomplished by invoking thread sleeping (or waiting) methods; for model artifacts, appropriate tool APIs could be used to halt execution of operational semantics transformations. In either case, such tasks and the generation of any needed facilities (e.g., dummy rules or callback functions) can and should be automated. Note that we restrict our definition of assertions to conditions that are verified during model execution rather than during model editing. Thus, “static” DSL constraints should not be confused with assertions. Such a static DSL constraint specifies for example that 8
This is of course an abuse of notation since, in this context, executing models means executing artifacts.
Debugging in Domain-Specific Modelling
15
before creating an edge of type “is-parent” from node n1 to node n2 , the nonexistence of an “is-parent” edge from n2 to n1 should be established. Note that this implies the checking of different constraints at different times during the modelling process. A single metamodel will thus not suffice. Exceptions The notion of exception in the context of debugging models is somewhat deferred. The reason for this is that exceptions occur at runtime and that although models may be animated and updated, what is truly being executed are the synthesized artifacts. Consequently, exceptions will originate from these artifacts and will be described in terms of their metamodel (e.g., Java). Such exceptions may be caused by I/O errors, by bugs in third party code libraries, by errors in designer or modeller provided code9 , by problems within the operational semantics transformation of lower level models, etc. Some of these exceptions may be straight-forward to translate back into domain-specific terms; others may be describe transient issues that are entirely irrelevant to the modeller; others may describe issues that are only of interest to the designer. The handling of these exceptions is thus a design choice of the DSL architect. “Silent” exception handlers for irrelevant exceptions should be generated along with the rest of the synthesized artifacts. For relevant exceptions, propagation and translation facilities for presentation to the designer or modeller should be available. This is thus yet another scenario where the web of links left behind by the approach for artifact synthesis we reviewed in Section 4.2 can be beneficial. Figure 5 shows a possible rendering of exception translation specification facilities grafted onto a traditional rule. The rule specifies the mapping of a domain-specific construct to a modelled code file. The proposed exception translation specification indicates that if a given error message is produced while executing the real file associated to the designated modelled file, the corresponding domain-specific construct’s concrete syntax should reflect a high-level version of the error. Execution Modes Similarly to exceptions and assertions, the play, pause, stop and step functionalities require two-way communication means between model and artifact. Playing and stopping simply imply that means to remotely run or kill the generated model or program are available. Stepping presents more of a challenge. First, the meaning of what taking one step in an arbitrary DSm should be is not obvious. To this end, we propose a very general definition: any modification of the state of a DSm constitutes a step, where the notion of state encompasses the values of the parameters of every construct in the model. Second, (semi-)automatic instrumentation of the artifacts to enable running only arbitrary parts of them at a time may be required10 . Pausing presents similar challenges as in the model transformation debugging context. The ideal behaviour of a pause should thus depend on the structure and semantics of the DSm and artifacts. However, a widely applicable and sensible approach is to 9 10
This applies to languages with support for escape semantics. The specifics of such instrumentation are outside the scope of this paper but we believe the web links left behind by the approach for artifact synthesis we reviewed in Section 4.2 would considerably ease the process
16
†
Raphael Mannadiar and
†,‡
Hans Vangheluwe
Fig. 5: An example a high-level Downloader construct, its mapping to code, and a possible rendering of exception translation specification facilities.
pause the execution before executing what would have been the next step (at the DSm level). Finally, it may be desirable for the traditional debug mode to be further refined. For instance, although immediate pausing or stepping at the level of generated code statements may be absurd for a modeller, it might be advantageous and even necessary for designers.
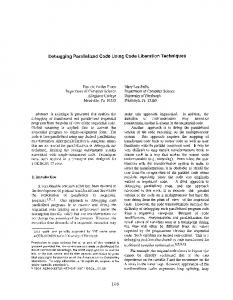
Steps The notions of stepping over, into and out may be considered from two orthogonal perpectives. On the one hand, all three notions intuitively translate to DSLs which support hierarchy and composition. For instance, given a Statechart-based language (i.e, some DSL constructs are transformed to Statechart constructs and eventually translated to code), if the current state were within a composite state, stepping out could execute the Statechart continuously until the parent state was exited. On the other hand, the fact that artifacts are generated from DSms creates an implicit hierarchy between them. Hence, for a designer, appropriate behaviour for the step into operation might be to take a step at the level of corresponding lower level entities. Keeping with the Statechart-based language example, stepping into might allow the designer to step through the underlying Statechart. Further stepping into might allow him to step through statements of the compiled Statechart’s code. This scenario is depicted in Figure 6 where two successive step into operations lead a designer from a domain-specific traffic light model entity to a corresponding Statechart
Debugging in Domain-Specific Modelling
17
Fig. 6: Stepping into from the designer’s perspective. Stepping into a TrafficLight model entity leads into a corresponding Statechart state. Further stepping into leads into the generated code.
state and finally to an appropriate function in the compiled code11 . Conversely, stepping out would bring the designer back to higher level entities and stepping over would perform an appropriate step given the current formalism (e.g., one statement for code, one operational semantics rule application for models). This idea is somewhat akin to stepping into code libraries (which is only possible when they were compiled in debug mode, making symbol table information available). These distinct stepping modes further motivate our previous proposal of separate debug modes for designers and modellers.
11
Notice again how the availability of intermediate representations between DSms and end artifacts, and of traceability links between them eases the debugging process.
18
†
Raphael Mannadiar and
†,‡
Hans Vangheluwe
Runtime Variable I/O At a first glance, runtime variable I/O seems the most straight-forward of the debugger operations. For DSms and lower level generated models, the model editing tool itself can be used to view and modify variable values when the execution is paused, whereas code IDE debugger facilities can be used for synthesized coded artifacts. The hidden challenge is to propagate changes: changing a variable value should be reflected appropriately at every level of abstraction – higher and lower – to ensure continued overall consistency. Once again, the correspondence links left behind by the approach for artifact synthesis we reviewed in Section 4.2 would facilitate the automatic generation of appropriate change propagation facilities. Breakpoints Breakpoints translate more or less intuitively to the model and artifact debugging world. Ideally, it should be possible for the designer to specify breakpoints at any level of abstraction from DSm to end artifact. Of course, the modeller is only expected to specify them at the DSm level. The challenge here is how to specify the said breakpoints. For modelling languages with an explicit representation of state (e.g., Statecharts), the trivial answer is to mark certain states as breakpoints causing the execution to pause whenever they become enabled12 . However, this is impossible for languages with an implicit representation of state (e.g., Petri Nets where the state is encoded in the marking). For such formalisms, we propose that breakpoints instead be specified as patterns (e.g., a partial or complete Petri Net marking) causing the execution to pause when the patterns are matched in the model. Once again, hit counts and boolean conditions (written in a supported action language) could conceivably be specified in the same manner as in code IDEs. Jump To The jump to operation does not have a clear-cut mapping to this context. This is due in part to the conceptual gap between DSm and artifact: modifying variables in a DSm may effectively translate to a jump to operation in the lower level models or code. To illustrate this phenomenon, consider the consequence of altering the marking of a Petri Net or changing the enabled state in Statechart-based languages. Thus, in the context of model and artifact debugging, the jump to operation is absorbed within the runtime variable I/O operation. Stack Traces Like in the code and model transformation debugging contexts, stack traces in the context of model and artifact debugging are tightly bound to the notions of stepping into and out. Thus, for the designer debug mode, they might display sequences of related actions between DSm and artifact. On the other hand, for the modeller debug mode, they might reflect construct composition if applicable.
12
This of course assumes tool support for such markings.
Debugging in Domain-Specific Modelling
5
19
Conclusion and Future Work
We have proposed a conceptual mapping between debugging concepts in the software development realm and concepts in the DSM realm. These form a starting point for DSM debugger development. In our mapping, we distinguished between the two different facets of DSM debugging: the debugging of model transformations (such as models of operational or denotational semantics) and the debugging of DSms. We made a further distinction between debugging scenarios for two types of users of DSM. On the one hand, there are the designers who are fully aware of the model transformations that describe the semantics of their models and generate lower level artifacts. On the other hand, there are the modellers who understand the semantics of their models and are aware of synthesized artifacts but have little or no knowledge about how these are produced. Our work demystifies the amount of effort required to build DSM debuggers: numerous model transformation debugger features can be built-in to MTLs and engines themselves, while appropriate artifact synthesis based on TGRs can considerably facilitate the implementation of numerous model and artifact debugger features. We have prototyped the concepts described in this paper in our tool for multi-formalism and meta-modelling, AToM3 . We will fully integrate our proposed debugging facilities in AToMPM, the successor of AToM3 we are currently developing.
6
Acknowledgments
We thank Eugene Syriani for sharing his expertise on model transformation tools and languages and for his valuable editorial comments on this paper.
References 1. Meta Object Facility (MOF) 2.0 Query/View/Transformation (QVT). http://www.omg.org/spec/QVT/index.htm. 2. Aditya Agrawal, Gabor Karsai, Sandeep Neema, Feng Shi, and Attila Vizhanyo. The design of a language for model transformations. Software and Systems Modeling (SoSym), 5:261–288, 2006. 3. Jean Bezivin. On the unification power of models. Software and Systems Modeling (SoSym), 4:171–188, 2005. 4. Alan W. Brown. Model driven architecture: Principles and practice. Software and Systems Modeling (SoSym), 3:314–327, 2004. 5. Krzysztof Czarnecki and Ulrich Eisenecker. Generative Programming: Methods, Tools, and Applications. Addison-Wesley, 2000. 832 pages. 6. Krzysztof Czarnecki and Simon Helsen. Feature-based survey of model transformation approaches. IBM Systems Journal (IBMS), 45:621–645, 2006. 7. Juan de Lara, Hans Vangheluwe, and Manuel Alfonseca. Meta-modelling and graph grammars for multi-paradigm modelling in AToM3 . Software and Systems Modeling (SoSym), 3:194–209, 2004.
20
†
Raphael Mannadiar and
†,‡
Hans Vangheluwe
8. Marc Eisenstadt. “My Hairiest Bug” war stories. Communications of the ACM (CACM), 40:30–37, 1997. 9. David Harel. Statecharts: A visual formalism for complex systems. The Science of Computer Programming, 8:231–274, 1987. 10. Steven Kelly and Juha-Pekka Tolvanen. Domain-Specific Modeling : Enabling Full Code Generation. Wiley-Interscience, 2008. 427 pages. 11. L´ aszl´ o Lengyel, Tiham´er Levendovszky, Gergely Mezei, and Hassan Charaf. Model transformation with a visual control flow language. International Journal of Computer Science (IJCS), 1:45–53, 2006. 12. Raphael Mannadiar and Hans Vangheluwe. Modular synthesis of mobile device applications from domain-specific models. Technical Report SOCS-TR-2010.5, McGill University, 2010. 13. MetaCase. Domain-specific modeling with MetaEdit+: 10 times faster than UML. http://www.metacase.com/resources.html; June 2009. 14. Laurent Safa. The making of user-interface designer a proprietary DSM tool. In 7th OOPSLA Workshop on Domain-Specific Modeling (DSM), page 14, http://www.dsmforum.org/events/DSM07/papers.html, 2007. 15. Andy Sch¨ urr. Specification of graph translators with triple graph grammars. In Proceedings of the 20th International Workshop on Graph-Theoretic Concepts in Computer Science, 1995. 16. Eugene Syriani, J¨ org Kienzle, and Hans Vangheluwe. Exceptional transformations. In International Conference on Model Transformation (ICMT), volume LNCS 6142, pages 199–214, 2010. 17. Eugene Syriani and Hans Vangheluwe. De-/re-constructing model transformation languages. Technical Report SOCS-TR-2009.7, McGill University, 2009. 18. Eugene Syriani and Hans Vangheluwe. Discrete-Event Modeling and Simulation: Theory and Applications., chapter DEVS as a Semantic Domain for Programmed Graph Transformation. CRC Press, 2009. never read this... eugene sites this for MoTif. 19. Eugene Syriani and Hans Vangheluwe. De-/re-constructing model transformation languages. In 9th International Workshop on Graph Transformation and Visual Modeling Techniques (GT-VMT), 2010. 20. D´ aniel Varr´ o, , and Andr´ as Balogh. The model transformation language of the viatra2 framework. Science of Computer Programming, 68:214–234, 2007. 21. Hui Wu, Jeff Gray, and Marjan Mernik. Grammar-driven generation of domainspecific language debuggers. Software : Practice and Experience, 38:1073–1103, 2008. 22. Andreas Zeller. Why Programs Fail: A Guide to Systematic Debugging. Morgan Kaufmann, second edition, 2009. 480 pages.