Siv Hilde Houmb
Decision Support for Choice of Security Solution The Aspect-Oriented Risk Driven Development (AORDD) Framework
Thesis for the degree philosophiae doctor Trondheim, November 2007 Norwegian University of Science and Technology Faculty of Information Technology, Mathematics and Electrical Engineering Department of Computer and Information Science
Innovation and Creativity
NTNU Norwegian University of Science and Technology Thesis for the degree doctor philosophiae Faculty of Information Technology, Mathematics and Electrical Engineering Department of Computer and Information Science © Siv Hilde Houmb ISBN 978-82-471-4588-3 (printed version) ISBN 978-82-471-4591-3 (electronic version) ISSN 1503-8181 Doctoral theses at NTNU, 2007:208 Printed by NTNU-trykk
To Erlend
Abstract
In security assessment and management there is no single correct solution to the identi…ed security problems or challenges. Instead there are only choices and tradeo¤s. The main reason for this is that modern information systems and security critical information systems in particular must perform at the contracted or expected security level, make e¤ective use of available resources and meet end-users’expectations. Balancing these needs while also ful…lling development, project and …nancial perspectives, such as budget and TTM constraints, mean that decision makers have to evaluate alternative security solutions. This work describes parts of an approach that supports decision makers in choosing one or a set of security solutions among alternatives. The approach is called the Aspect-Oriented Risk Driven Development (AORDD) framework, combines Aspect-Oriented Modeling (AOM) and Risk Driven Development (RDD) techniques and consists of the seven components: (1) An iterative AORDD process. (2) Security solution aspect repository. (3) Estimation repository to store experience from estimation of security risks and security solution variables involved in security solution decisions. (4) RDD annotation rules for security risk and security solution variable estimation. (5) The AORDD security solution trade-o¤ analysis and trade-o¤ tool BBN topology. (6) Rule set for how to transfer RDD information from the annotated UML diagrams into the trade-o¤ tool BBN topology. (7) Trust-based information aggregation schema to aggregate disparate information in the trade-o¤ tool BBN topology. This work focuses on components 5 and 7, which are the two core components in the AORDD framework. This work has looked at four main research questions related to security solution decision support. These are: RQ.1: How can alternative security solutions be evaluated against each other? RQ.2: How can security risk impact and the e¤ect of security solutions be measured? RQ.3: Which development, project and …nancial perspectives are relevant and how can these be measured? RQ.4: How can the disparate information involved in RQ.1, RQ.2 and RQ.3 be combined?
ii
Abstract
The main contributions of this work towards the above-mentioned research questions are: C.1: A set of security risk variables. C.2: A set of security solution variables. C.3: A set of trade-o¤ parameter variables to represent and measure relevant development, project and …nancial perspectives. C.4: Methodology and tool-support for comparing the security solution variables with the security risk variables. C.5: Methodology and tool-support for trading o¤ security solutions and identifying the best-…tted one(s) based on security, development, project and …nancial perspectives. C.1-C.5 is integrated into components 5 and 7 of the AORDD framework. C.1, C.2 and C.4 address RQ.1 and RQ.2, while C.3 and C.5 address RQ.3 and RQ.4 and C.5 addresses RQ.4.
Acknowledgement
PhD work is a strenuous task and feels much like running a marathon. Through this long and sometimes painful race I have had several people to discuss matters with and I am grateful to them all. I will …rst and foremost thank my supervisors Professor Dr Tor Stålhane, Professor Dr Maria Letitzia Jaccheri and Dr Per Hokstad (SINTEF), the head of the software engineering group Professor Dr Reidar Conradi, all of the Department of Computer and Information Science at NTNU and my dear friend and colleague Sven Ziemer. Other people that have been of importance in completing this work are Dr Ketil Stølen, SINTEF; Senior adviser Stewart Clark, Student and Academic Division, NTNU; Dr. Bjørn Axel Gran, IFE; Professor Dr Robert France, Dr Geri Georg, Professor Dr Indrakshi Ray, Professor Dr James Bieman and Professor Dr Indrajit Ray, all from Colorado State University; Dr Jan Jürjens, Open University in London and all of Telenor R&I and in particular Judith Rossebø, Gerda Hybertsen, Dr Oddvar Risnes and Sune Jakobsson. Dr Stølen was of great help during the …rst two years of this work. He struggled heroically with my stubbornness. I do really appreciate his devoted way of commenting on my work and his ability to repeatedly challenge my ideas and ask the necessary questions. I would also like to take the opportunity to thank Professor Dr France for allowing me to join his research group at Colorado State University as a visiting researcher for nearly two years and Dr Georg and Professor Dr Indrakshi Ray for close and fruitful cooperation since 2002. There would not be much to report in this work without the two of you. When it comes to people who have been crucial for me in both my everyday life and as a source of inspiration for my work my dear and devoted husband Erlend is irreplaceable. He has the rare ability to make me smile even when things seem too complicate to solve and when times are rough and work is not as smooth and pleasant as it should be. In addition, my parents Johan and Inger Houmb are and have always been very important to me. I owe them my ability to look at things from di¤erent perspective. They are the best parents that anyone can ever hope for. I know that they have not always agreed with my decisions but even though they have always been able to advise, accept and move on. Their pure and wise
iv
Acknowledgement
degree of tolerance and sense of fairness is something that I will strive to achieve. Thanks a lot mom and dad. Last but not least, my gratitude and honour to my baby sister, Liv Elin Houmb, with whom I have shared many joyful and challenging tasks and experiences with. She is the anchor that I can always rely on. And then there are my dear friends that I can discuss anything and nothing with. Thanks Sven, Kari, Xiaomeng, Sverre, Ove, Judith, Jens, Ana, Pete, Vidya, Frode, Helen, Mette, Sangita and everybody else. Thanks also to my two sets of "foster parents" in Fort Collins, Bob and Nancy Sturtevant and Dan and Maggie Matheson and to my grandma Borghild. Thanks for always being there.
Preface
Living in a technological society is like riding a bucking bronco. I don’t believe we can a¤ ord to get o¤ , and I doubt that someone will magically appear who can lead it about on a leash. The question is: how do we become better broncobusters? William Ruckelshaus Risk in a Free Society Modern society relies heavily on networked information systems. The risks associated with these systems might have serious implications, such as threatening the …nancial and physical well-being of people and organisations. For example, the unavailability of a telemedicine system might result in loss of life and an Internet-based organisation can be put out of business as a result of a successful denial of service (DoS) attack. Hence, decision-makers must gain control over risks associated with security attacks and they need techniques to support them in determining which security strategy best serves their many perspectives. In practice, the traditional strategy for security assurance has been penetration and patch, meaning that when the penetration of a software system is discovered and the exploited weaknesses are identi…ed the vulnerability is removed. This strategy is often supported by the use of tiger teams, which cover all organised and authorised penetration activity. Many of the major software vendors still use this strategy today, as the size and complexity of their software has outgrown their ability to ensure su¢ cient coverage of their testing. Some million lines of code have many possible combinations of potential use and misuse. Even though both alpha and beta testing user groups are used the last few per cent of testing and vulnerability analysis are left to the end-users and the today’s very active hacker environment. This process transfers responsibility for the security of the information system to the consumers and system administrators. Thus, the software vendor takes no responsibility for the security level of their software and provides no documentation of the risk level associated with using the system.
vi
Preface
Hence, these information systems are shipped with a high degree of uncertainty in their security level. Military systems struggled with similar problems in the beginning of the 1980s and developed early approaches for advanced classi…cation and access control models and software evaluation methods, such as the Trusted Computer System Evaluation Criteria (TCSEC) also known as the Orange Book. TCSEC is a United States Government Department of Defense (DoD) standard that speci…es the basic requirements for assessing the e¤ectiveness of the computer security controls built into an information system (called computer system in the standard). This is done by the use of seven prede…ned security classes; D, C1, C2, B1, B2, B3 and A1, where class A1 o¤ers the highest level of assurance. Similar e¤orts were also undertaken in Europe and Canada which led to the Information Technology Security Evaluation Criteria (ITSEC) and the Canadian Trusted Computer Product Evaluation Criteria (CTCPEC). Later industry adopted these models, but not without problems as most of them are unsuitable for cost-e¤ective development of industrial applications. There are several reasons for this, one being the clear di¤erences between the environments that military and industrial systems operate in. As a response to this the security evaluation standard ISO 15408 Common Criteria for Information Technology Security Evaluation was developed as a common e¤ort by the the International Organization for Standardization (ISO). The Common Criteria has today largely taken over from TCSEC, ITSEC and CTCPEC. The Common Criteria is tailored for industrial purposes and is the result of the experience and recommendations of researchers and experienced developers both within the military sector and from industry. The standard has adopted the strategy from TCSEC and its subsequent evaluation standards. It evaluates the security level of information systems using a hierarchy of prede…ned evaluation classes called evaluation assurance levels (EAL). The EALs and associated guidelines take an evaluator through a well-formulated and structural process of assessing the security level of a system to gain con…dence in the security controls of the system. However, even though the Common Criteria is developed for an industrial setting the evaluation process is time and resource demanding and considered by many not to be worth the e¤ort and cost. This is particularly true for web-based applications where a system may be of no interest to the market by the time the evaluation is completed. Furthermore, despite the structural process that a Common Criteria evaluation undertakes the evaluation is still a subjective assessment and does not su¢ ciently address the development, project and …nancial perspectives of information systems. Security assessment and management is a strategy for controlling the security of a system that lies between the penetration and patch and the security evaluation
Preface
vii
strategies. In security assessment and management several techniques for identifying and assessing security problems in an information system are combined into a process that ensures that there is continuous review and update of its security controls. This process is based on observations from vulnerability analysis or hacker reports and from the structural and continuous examination of the potential security problems and challenges in the information system. Security assessment and management can be employed at any level of rigour and can be tailored for any type of system. However, as for the Common Criteria, security assessment and management is subjective and its results depend on the ability of the risk analyst carrying out the assessment. There are also problems with estimating the variables involved as little empirical information for security risk estimation exists. Thus, the situation is that the ad-hoc and after-the-fact security strategy “penetration and patch” ensures that systems are delivered within a reasonable time and cost, but with a high degree of uncertainty and lack of con…dence in the e¢ ciency of the security controls in an information system. On the other hand, the preventive security strategy employed by Common Criteria evaluation provides con…dence in the e¢ ciency of the security controls, but is too costly and demands too much in terms of time and resources. It is also very dependent on the experience level of the evaluator for it to be practical in today’s highly competitive market with strict budget and time-to-market (TTM) constraints. Security assessment and management relies on subjective judgments and su¤ers from the lack of empirical data. However, all three approaches possess some desired properties in a development setting where security, development, project and …nancial perspectives must be ful…lled. This is the reason why this work is based on the recommendations in the Common Criteria as a penetration and patch type of construct in the setting of security assessment and management that makes use all available information for identifying the best-…tted security solutions for the security problems or challenges of an information system.
Trondheim, September 2007
............................... Siv Hilde Houmb
Contents
Part I. Background and Research Context 1.
Research Context : : : : : : : : : : : : : : : : : : : : : : : : : : : : : : : : : : : : : : : : : : : : :
3
1.1 Background and motivation . . . . . . . . . . . . . . . . . . . . . . . . . . . . . . . . . .
3
1.2 Research objective and research questions . . . . . . . . . . . . . . . . . . . . .
5
1.3 Main contributions of this work . . . . . . . . . . . . . . . . . . . . . . . . . . . . . .
6
1.3.1 Publications . . . . . . . . . . . . . . . . . . . . . . . . . . . . . . . . . . . . . . . . .
8
1.4 Research method and way of work . . . . . . . . . . . . . . . . . . . . . . . . . . . . 12 1.4.1 Application of action research for this work . . . . . . . . . . . . . . 13 2.
Outline of the Thesis : : : : : : : : : : : : : : : : : : : : : : : : : : : : : : : : : : : : : : : : : 17
Part II. Background Information and State of the Art 3.
Security in Information Systems : : : : : : : : : : : : : : : : : : : : : : : : : : : : : : 21 3.1 Security standards and regulations . . . . . . . . . . . . . . . . . . . . . . . . . . . . 24
4.
The Common Criteria : : : : : : : : : : : : : : : : : : : : : : : : : : : : : : : : : : : : : : : : 29 4.1 Relevant parts of Common Criteria terminology . . . . . . . . . . . . . . . . 30 4.2 Evaluation and certi…cations according to the Common Criteria . . 31 4.3 Performing a Common Criteria evaluation . . . . . . . . . . . . . . . . . . . . . 34
5.
Risk Assessment and Management of Information Systems : : : 37 5.1 Security (risk) assessment . . . . . . . . . . . . . . . . . . . . . . . . . . . . . . . . . . . 39
x
Contents
5.1.1 Performing security assessment . . . . . . . . . . . . . . . . . . . . . . . . . 39 5.2 AS/NZS 4360:2004 Risk Management . . . . . . . . . . . . . . . . . . . . . . . . . 41 5.3 CRAMM . . . . . . . . . . . . . . . . . . . . . . . . . . . . . . . . . . . . . . . . . . . . . . . . . . 46 5.4 The CORAS approach . . . . . . . . . . . . . . . . . . . . . . . . . . . . . . . . . . . . . . 47 5.4.1 CORAS risk management process . . . . . . . . . . . . . . . . . . . . . . 49 6.
Towards Quantitative Measure of Operational Security : : : : : : : 51
7.
Subjective Expert Judgment : : : : : : : : : : : : : : : : : : : : : : : : : : : : : : : : : : 55 7.1 Aggregation techniques for combining expert opinions . . . . . . . . . . . 60
8.
Bayesian Belief Networks (BBN) : : : : : : : : : : : : : : : : : : : : : : : : : : : : : 63
9.
Architecture/Design trade-o¤ analysis : : : : : : : : : : : : : : : : : : : : : : : : 69 9.1 Architecture Trade-o¤ Analysis Method (ATAM) . . . . . . . . . . . . . . . 69 9.2 Cost Bene…t Analysis Method (CBAM) . . . . . . . . . . . . . . . . . . . . . . . 71
Part III. Security Solution Decision Support Framework 10. The AORDD Framework : : : : : : : : : : : : : : : : : : : : : : : : : : : : : : : : : : : : : 77 11. The AORDD Process : : : : : : : : : : : : : : : : : : : : : : : : : : : : : : : : : : : : : : : : : 81
Part IV. AORDD Security Solution Trade-O¤ Analysis 12. The Role of Trade-O¤ Analysis in Security Decisions : : : : : : : : : 89 13. AORDD Security Solution Trade-O¤ Analysis : : : : : : : : : : : : : : : : 93 13.1 Phase 1: Risk-driven analysis . . . . . . . . . . . . . . . . . . . . . . . . . . . . . . . . 95 13.1.1 Relationship between misuse variables . . . . . . . . . . . . . . . . . . 99 13.1.2 Deriving the list of security risks in need of treatment . . . . . 104 13.2 Phase 2: Trade-o¤ analysis . . . . . . . . . . . . . . . . . . . . . . . . . . . . . . . . . . . 105 13.2.1 Identifying and assigning values to assets . . . . . . . . . . . . . . . . 110
Contents
xi
13.2.2 Relationship between MI/SE and AV . . . . . . . . . . . . . . . . . . . 115 13.2.3 Misuse and security solution costs . . . . . . . . . . . . . . . . . . . . . . 117 14. Structure of the Trade-O¤ Analysis : : : : : : : : : : : : : : : : : : : : : : : : : : : 121 15. The Trade-O¤ Tool : : : : : : : : : : : : : : : : : : : : : : : : : : : : : : : : : : : : : : : : : : : 129 15.1 SSLE subnet . . . . . . . . . . . . . . . . . . . . . . . . . . . . . . . . . . . . . . . . . . . . . . . 131 15.1.1 Aggregating asset value . . . . . . . . . . . . . . . . . . . . . . . . . . . . . . . 134 15.2 RL subnet . . . . . . . . . . . . . . . . . . . . . . . . . . . . . . . . . . . . . . . . . . . . . . . . . 136 15.3 SSTL subnet . . . . . . . . . . . . . . . . . . . . . . . . . . . . . . . . . . . . . . . . . . . . . . . 140 15.4 TOP subnet . . . . . . . . . . . . . . . . . . . . . . . . . . . . . . . . . . . . . . . . . . . . . . . 142
Part V. Aggregating Information in the Trade-O¤ Tool 16. Information Sources : : : : : : : : : : : : : : : : : : : : : : : : : : : : : : : : : : : : : : : : : : 149 16.1 Sources for observable information . . . . . . . . . . . . . . . . . . . . . . . . . . . . 149 16.2 Sources for subjective or interpreted information . . . . . . . . . . . . . . . 154 17. Trust-Based Information Aggregation Schema : : : : : : : : : : : : : : : : 157 17.1 Step 1: Specify trust context . . . . . . . . . . . . . . . . . . . . . . . . . . . . . . . . . 160 17.2 Step 2: IS trustworthiness weight . . . . . . . . . . . . . . . . . . . . . . . . . . . . . 162 17.2.1 Knowledge level . . . . . . . . . . . . . . . . . . . . . . . . . . . . . . . . . . . . . . 162 17.2.2 Expertise level . . . . . . . . . . . . . . . . . . . . . . . . . . . . . . . . . . . . . . . 168 17.2.3 Computing IS trustworthiness weights . . . . . . . . . . . . . . . . . . 172 17.3 Step 3: Trust between decision maker and IS . . . . . . . . . . . . . . . . . . . 174 17.4 Step 4: Update relative IS trustworthiness weights . . . . . . . . . . . . . . 175 17.5 Step 5: Aggregate information . . . . . . . . . . . . . . . . . . . . . . . . . . . . . . . . 175
Part VI. Validation, Discussion and Concluding Remarks 18. Validation of the Approach : : : : : : : : : : : : : : : : : : : : : : : : : : : : : : : : : : : 179
xii
Contents
18.1 Demonstration of the trade-o¤ tool and TBIAS . . . . . . . . . . . . . . . . 180 18.1.1 Aggregating information for the trade-o¤ tool using TBIAS 181 18.1.2 Example of trading o¤ two DoS solutions . . . . . . . . . . . . . . . . 194 19. Discussion : : : : : : : : : : : : : : : : : : : : : : : : : : : : : : : : : : : : : : : : : : : : : : : : : : : : 203 19.1 Related work . . . . . . . . . . . . . . . . . . . . . . . . . . . . . . . . . . . . . . . . . . . . . . 210 20. Concluding Remarks and Suggestions for Further Work : : : : : : 219 References : : : : : : : : : : : : : : : : : : : : : : : : : : : : : : : : : : : : : : : : : : : : : : : : : : : : : : : : 229
Part VII. Appendices Appendix A.1: AORDD Concepts : : : : : : : : : : : : : : : : : : : : : : : : : : : : : : : : 233 Appendix B.1: P.16: Houmb and Georg (2005) : : : : : : : : : : : : : : : : : : : : 237 Appendix B.2: P.26; Houmb et al. (2006) : : : : : : : : : : : : : : : : : : : : : : : : : 253 Appendix B.3: P.17; Houmb et al. (2005) : : : : : : : : : : : : : : : : : : : : : : : : : 285 Appendix C: Publication List : : : : : : : : : : : : : : : : : : : : : : : : : : : : : : : : : : : : : 305
List of Figures
1.1 The relation between the research questions, main contributions and the three studies of this work . . . . . . . . . . . . . . . . . . . . . . . . . . . . . . . . . . . .
7
1.2 The phases and iterations of the construction (work) process . . . . . . . . . 14 1.3 Action research and how it in‡uenced the construction process . . . . . . . 14 1.4 The evaluation and validation process used in this work . . . . . . . . . . . . 15 4.1 ST, PP and ToE in relation to phases of a development process . . . . . . 32 4.2 Relationship between PP, ST and ToE in Common Criteria (page 45 in Part 1 of [15]) . . . . . . . . . . . . . . . . . . . . . . . . . . . . . . . . . . . . . . . . . . . . . . . 33 5.1 AS/NZS 4360:2004 Risk management process . . . . . . . . . . . . . . . . . . . . . . 42 5.2 The …ve main components of the CORAS framework . . . . . . . . . . . . . . . . 48 7.1 Example case description using a state transition diagram . . . . . . . . . . . 56 7.2 Example of Triang(a,b,c) distribution for three experts . . . . . . . . . . . . . . 59 7.3 Robustness analysis used to derive the weighting schema . . . . . . . . . . . . 61 8.1 Example BBN for ‘…rewall down’. . . . . . . . . . . . . . . . . . . . . . . . . . . . . . . . . 65 10.1 The seven components of the AORDD framework . . . . . . . . . . . . . . . . . . 78 11.1 Outline of the AORDD process . . . . . . . . . . . . . . . . . . . . . . . . . . . . . . . . . . . 83 11.2 Overview of the activities of the requirement and design phase of the AORDD process . . . . . . . . . . . . . . . . . . . . . . . . . . . . . . . . . . . . . . . . . . . . . . . . 83 13.1 The two phases of the AORDD security solution trade-o¤ analysis . . . . 94
xiv
List of Figures
13.2 The security assessment concepts involved in Phase 1 and 2 of the AORDD security solution trade-o¤ analysis . . . . . . . . . . . . . . . . . . . . . . . . 95 13.3 Concepts involved in Phase 1 of the AORDD security solution tradeo¤ analysis . . . . . . . . . . . . . . . . . . . . . . . . . . . . . . . . . . . . . . . . . . . . . . . . . . . . 97 13.4 Example of a risk model . . . . . . . . . . . . . . . . . . . . . . . . . . . . . . . . . . . . . . . . . 98 13.5 Relation between security threat, security vulnerability and misuse . . . 100 13.6 Overview of how misuses happen and how they can be prevented . . . . . 101 13.7 Illustration of a misuse hierarchy . . . . . . . . . . . . . . . . . . . . . . . . . . . . . . . . . 103 13.8 Concepts involved in Phase 2 of the AORDD security solution tradeo¤ analysis . . . . . . . . . . . . . . . . . . . . . . . . . . . . . . . . . . . . . . . . . . . . . . . . . . . . 107 13.9 The input and outputs of Phase 2 of the AORDD security solution trade-o¤ analysis . . . . . . . . . . . . . . . . . . . . . . . . . . . . . . . . . . . . . . . . . . . . . . . 109 13.10Asset value table as a composite of the 15 asset valuation categories (sub variables) . . . . . . . . . . . . . . . . . . . . . . . . . . . . . . . . . . . . . . . . . . . . . . . . . 115 13.11The 15 misuse impact sub variables and how to aggregate these into the misuse impact table . . . . . . . . . . . . . . . . . . . . . . . . . . . . . . . . . . . . . . . . . 116 13.12The relation between misuse impacts, the original asset values and the resulting updated asset value table . . . . . . . . . . . . . . . . . . . . . . . . . . . . . . . . 117 13.13The 15 security solution e¤ect sub variables and how to aggregate these into the security solution e¤ect table . . . . . . . . . . . . . . . . . . . . . . . . . 118 14.1 Overview of the structure and the step by step procedure of the tradeo¤ analysis . . . . . . . . . . . . . . . . . . . . . . . . . . . . . . . . . . . . . . . . . . . . . . . . . . . . 122 14.2 Variables involved in estimating the risk level of a ToE in the trade-o¤ analysis method . . . . . . . . . . . . . . . . . . . . . . . . . . . . . . . . . . . . . . . . . . . . . . . . 124 14.3 The relation between misuse cost and security solution cost in the trade-o¤ analysis method . . . . . . . . . . . . . . . . . . . . . . . . . . . . . . . . . . . . . . . . 125 15.1 The top-level network of the trade-o¤ tool BBN topology . . . . . . . . . . . . 130 15.2 SSLE subnet . . . . . . . . . . . . . . . . . . . . . . . . . . . . . . . . . . . . . . . . . . . . . . . . . . . 132 15.3 Asset value subnet . . . . . . . . . . . . . . . . . . . . . . . . . . . . . . . . . . . . . . . . . . . . . . 135 15.4 The ToE risk level or operation security level of a ToE as a result of the environmental (security) and internal (dependability) in‡uence on the ToE . . . . . . . . . . . . . . . . . . . . . . . . . . . . . . . . . . . . . . . . . . . . . . . . . . . . . . . 136 15.5 RL subnet . . . . . . . . . . . . . . . . . . . . . . . . . . . . . . . . . . . . . . . . . . . . . . . . . . . . . 137
List of Figures
xv
15.6 Negative and positive misuse impacts . . . . . . . . . . . . . . . . . . . . . . . . . . . . . 138 15.7 Misuse impact (MI) subnet . . . . . . . . . . . . . . . . . . . . . . . . . . . . . . . . . . . . . . 139 15.8 Misuse cost (MC) subnet . . . . . . . . . . . . . . . . . . . . . . . . . . . . . . . . . . . . . . . . 140 15.9 SSTL subnet . . . . . . . . . . . . . . . . . . . . . . . . . . . . . . . . . . . . . . . . . . . . . . . . . . . 141 15.10Security solution cost (SC) subnet . . . . . . . . . . . . . . . . . . . . . . . . . . . . . . . . 142 15.11TOP subnet . . . . . . . . . . . . . . . . . . . . . . . . . . . . . . . . . . . . . . . . . . . . . . . . . . . 143 17.1 Overview of the …ve steps of the trust-based information aggregation schema . . . . . . . . . . . . . . . . . . . . . . . . . . . . . . . . . . . . . . . . . . . . . . . . . . . . . . . . 159 17.2 General reference knowledge domain model . . . . . . . . . . . . . . . . . . . . . . . . 164 18.1 Reference knowledge domain model . . . . . . . . . . . . . . . . . . . . . . . . . . . . . . . 185 18.2 Information source knowledge domain models for experts 4, 6, 15 and 18 . . . . . . . . . . . . . . . . . . . . . . . . . . . . . . . . . . . . . . . . . . . . . . . . . . . . . . . . . . . . 189 18.3 Information inserted and propagated for security solution s1 (cookie solution) . . . . . . . . . . . . . . . . . . . . . . . . . . . . . . . . . . . . . . . . . . . . . . . . . . . . . . 193 18.4 Information inserted and propagated for security solution s2 (…lter mechanism) . . . . . . . . . . . . . . . . . . . . . . . . . . . . . . . . . . . . . . . . . . . . . . . . . . . . 193 18.5 The top-level network of the trade-o¤ tool BBN topology . . . . . . . . . . . . 194 18.6 The resulting risk level . . . . . . . . . . . . . . . . . . . . . . . . . . . . . . . . . . . . . . . . . . 195 18.7 The resulting security solution treatment level for the security solution s1 with the information from the information sources inserted and propagated . . . . . . . . . . . . . . . . . . . . . . . . . . . . . . . . . . . . . . . . . . . . . . . . . . . . 196 18.8 The resulting security solution treatment level for the security solution s2 with the information from the information sources inserted and propagated . . . . . . . . . . . . . . . . . . . . . . . . . . . . . . . . . . . . . . . . . . . . . . . . . . . . 196 18.9 Details on the computations made for the Security Solution E¤ect node for security solution s1 and security solution s2 . . . . . . . . . . . . . . . . 197 18.10TOP subnet with prior probability distributions . . . . . . . . . . . . . . . . . . . . 198 18.11Status of TOP subnet when security requirement information is entered and propagated . . . . . . . . . . . . . . . . . . . . . . . . . . . . . . . . . . . . . . . . . . . 199 18.12Evidence, propagation and result for the TOP subnet . . . . . . . . . . . . . . . 200 18.13Fitness score for s1 (cookie solution) . . . . . . . . . . . . . . . . . . . . . . . . . . . . . . 201 18.14Fitness score for s2 (‡itering mechanism) . . . . . . . . . . . . . . . . . . . . . . . . . . 201
List of Tables
7.1 Answer table for Question 1 in the questionnaire for Expert i . . . . . . . . 58 8.1 Node probability table for ‘ftp fork attack’. . . . . . . . . . . . . . . . . . . . . . . . . 66 13.1 Example asset value table . . . . . . . . . . . . . . . . . . . . . . . . . . . . . . . . . . . . . . . 113 13.2 Example of qualitative scale evaluation . . . . . . . . . . . . . . . . . . . . . . . . . . . . 114 15.1 Nodes and their states in the TOP subnet . . . . . . . . . . . . . . . . . . . . . . . . . 145 17.1 Example calibration variables for determining the expertise level for an information source . . . . . . . . . . . . . . . . . . . . . . . . . . . . . . . . . . . . . . . . . . . 169 18.1 The combined knowledge and experience level questionnaire . . . . . . . . . 186
Part I
Background and Research Context
1. Research Context
1.1 Background and motivation 6 February 2007 is the date where the so far last major security breach was reported in Norway (today is 6 August 2007). This time a major bank in Norway had to close down many of their branches due to a virus attack that successfully executed a DoS attack and took out many of the bank’s critical business servers. The only services provided by the bank on 7 February 2007 was cash withdrawal using ATMs and Internet banking. The news story showed frustrated customers and Bank representatives assuring that no customers’bank accounts were a¤ected by the attack and that all services would be running normally from the next day. Last year (2006) was remarkably bad in terms of security incidents. Not only were Windows-based personal computers and servers a¤ected, which had been the case before 2006, this time the type of security incidents had expanded to also target Macintosh and embedded systems in critical infrastructure. 2006 was also the year when the …rst terror-motivated security attacks materialised. PriceWaterhouseCooper reported in their information security breaches survey for 2006 [26] that around 62% of all UK businesses experienced serious security incidents in 2006. This is a high number. For premeditated and malicious incidents the number is even more worrying as the number of business a¤ected by such security attacks has increased by around 34% from 1998 to 2006. There are several reasons for this increase one being the heavy computerising of the businesses another the increased number of automated attack tools a¢ liating script kiddies. However, of the many security attacks leading to security incidents in 2006 the attack on the web services of the US export department on 9 October 2006 was particularly worrying. This attack originated from several computers located in China and resulted in more than a month’s downtime for the web service issuing online export licences for the US. The increased amount of serious security incidents reported the past few years has put focus on information security. However, solutions to information security
4
1. Research Context
problems are often costly in terms of money and time and resources. Thus, security issues should be addressed at the appropriate level for a reasonable cost. In a system development context this means that information security should be addressed as part of the development process rather than as an afterthought. Additionally, as cost and security are not the only perspectives involved in system development designers and decision makers need to evaluate security risks and security solutions in relation to development, project and …nancial perspectives as well. As it is hardly ever evident which of the alternative solutions that meet these multi-dimensional perspectives the best, the alternatives need to be evaluated against each other to identify the best-…tted solution. The security standard ISO 15408 Common Criteria for Information Technology Security Evaluation (Common Criteria) [15] permits comparability between results of independent security evaluation. Hence, the Common Criteria is useful as a guide for choosing one security solution among alternatives. However, the Common Criteria has a pure security perspective and does not provide any support for choosing security solutions based on other of the involved perspectives, such as development, project and …nancial perspectives. Penetration and patch strategies are more ‡exible in taking additional perspectives into consideration. In such a security strategy a solution is only identi…ed and employed whenever a problem is discovered and the choice of security solution is restricted by the time and budget available at the time the problem occurs. However, this leaves a business prone to security attacks and without control. Security assessment and management on the other hand focuses on future events and potential security risks and have several well-tested methodologies for identifying and assessing security risks “a priori”. The problem with security assessment and management though is that no e¤ective approaches for measuring and evaluating alternative solutions to the security risks have been established. Furthermore, most of these techniques do not su¢ ciently address the development, project and …nancial perspectives involved. What is needed is a security strategy that bene…ts from best practice and comparability of the Common Criteria, the ad-hoc and time e¤ectiveness of penetration and patch strategies and the preventive focus of security assessment and management. Furthermore, the strategy must o¤er su¢ cient performance, meaning that it must possess the ability to be carried out within a reasonable time frame, as well as take the relevant development, project and …nancial perspectives into consideration.
1.2 Research objective and research questions
5
1.2 Research objective and research questions The objective of this work has been to aid a decision maker in choosing the best-…tted security solution among alternatives taking relevant security, development, project and …nancial perspectives into consideration. The context of this decision support for choice of security solution is the development of security critical information systems and a security solution can be comprised of one or more of the following: security control, security mechanism, security procedure, security process, security policy or similar. This work is based on several security standards that will be discussed throughout this work and has adopted and re…ned the de…nitions of an information system and information security from these standards. De…nition Information system is a system containing physical and conceptual entities that interacts as a potential target for intended or unintended security attacks which might a¤ ect either the system itself, its data or its stakeholders and end-users (modi…ed from IEEE Std 1471–2000 [52]). De…nition Information security comprises all perspectives related to de…ning, achieving, and maintaining con…dentiality, integrity, availability, nonrepudiation, accountability, authenticity and reliability of an information system (adapted and modi…ed for information security from ISO/IEC TR 13335 [54]). The above research objective requires techniques for estimating security risks and security solutions so that alternative security solutions can be evaluated against each other to derive the best-…tted security solution. This also involves the identi…cation of relevant development, project and …nancial perspectives that should be taken into consideration when evaluating alternative security solutions, as well as a clear perception of how to measure the …tness of a security solution. Additionally, information sources for estimating security risk, security solution and development, project and …nancial perspectives needs to be identi…ed and combined. This led to the following research questions: RQ.1: How can alternative security solutions be evaluated against each other to identify the most e¤ective alternative? RQ.2: How can security risk impact and the e¤ect of security solutions be measured? RQ.3: Which development, project and …nancial perspectives are relevant for an information system and how can these be represented in the context of identifying the most e¤ective security solution among alternatives?
6
1. Research Context
RQ.4: How can the disparate information involved in RQ1, RQ2 and RQ3 be combined such that the most e¤ective security solution among alternatives can be identi…ed?
1.3 Main contributions of this work The main contributions of this work towards the above four research questions are: C.1 A set of security risk variables used to measure the impact, frequency and cost of potential undesired events, which in this work is called misuses. C.2 A set of security solution variables used to measure the treatment e¤ect and cost of alternative security solutions. C.3 A set of trade-o¤ parameter variables to represent and measure relevant development, project and …nancial perspectives. C.4 Methodology and tool-support for comparing the security solution variables with the security risk variables to identify how e¤ective a security solution is in protecting against the relevant undesired behaviour (misuse). C.5: Methodology and tool-support for trading o¤ security solutions and identifying the best-…tted one(s) based on security, development, project and …nancial perspectives. C1-C5 are integrated into the Aspect-Oriented Risk Driven Development (AORDD) framework which is a security solution decision support framework comprised of seven components: (1) An iterative AORDD process. (2) Security solution aspect repository. (3) Estimation repository to store experience from estimation of security risks and security solution variables involved in security solution decisions. (4) RDD annotation rules for security risk and security solution variable estimation. (5) The AORDD security solution trade-o¤ analysis and trade-o¤ tool BBN topology. (6) Rule set for how to transfer RDD information from the annotated UML diagrams into the trade-o¤ tool BBN topology. (7) Trust-based information aggregation schema to aggregate disparate information in the trade-o¤ tool BBN topology. This work focuses on components 5 and 7, which are the AORDD security solution trade-o¤ analysis and trade-o¤ tool and the trust-based information aggregation schema. Details of the AORDD framework are given in Part 3 while details of the AORDD security solution trade-o¤ analysis (component 5) are given in Part 4 and details of the trust-based information aggregation schema (component 7) are given in Part 5.
1.3 Main contributions of this work
7
AORDD Framework Overall objective of this work Described in Part 3 RQ.1 and RQ.2 C.1 and C.2 Security aspect repository
RQ.4 C.4 and C.5 RDD annotation rules
RQ.1 and RQ.2 C.1 and C.2 Estimation repository
RQ.1, RQ.2 and RQ.3 C.1, C.2, C.4 and C.5 AORDD security solution trade-off analysis Part 4
RQ.4 C.4 and C.5
RQ.4 C.4 and C.5 RDD information input rule set
C.4 and C.5 Described in Part 3 AORDD Process
Trust-based information Part 5 aggregation schema
Fig. 1.1. The relation between the research questions, main contributions and the three studies of this work
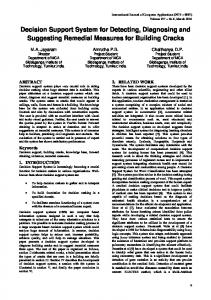
Figure 1.1 shows which of the …ve contributions in this work addresses which of the four research questions posed in this work. Figure 1.1 also shows that each of the three simulation examples performed in this work addresses all four research questions and tests all …ve contributions. The three simulation examples are named Study 1, 2 and 3 respectively. Details are in Section 1.4. Contributions 1 and 2 are closely related as the …tness of a security solution is the sum of the e¤ect of applying security solutions on the security risks. The set of security risk variables must therefore be comparable with the set of security solution variables. Security risk is in this work de…ned as a function over misuse frequency (MF), misuse impact (MI), mean e¤ort to misuse (METM), mean time to misuse (MTTM) and misuse cost (MC) and security solution e¤ect is de…ned as a function over security solution e¤ect (SE) and security solution cost (SC). Thus, MF, MI, METM, MTTM and MC are the security risk variables and SE and SC are the security solution variables. This means that C.1 and C.2 address research questions RQ.1 and RQ.2. Contribution 3 is a selection of relevant development, project and …nancial perspectives in a security critical information system development context. These are modelled as a set of trade-o¤ parameters in the AORDD security solution trade-o¤ analysis and the trade-o¤ tool, which are component 5 of the AORDD framework. The trade-o¤ parameters included are: priorities, budget, business goals, standards, business strategy, law and regulations, TTM, policies and security risk acceptance criteria. For policies, business goals, standards, business
8
1. Research Context
strategy and law and regulations only the security perspective is considered. This means that C.3 addresses research question RQ.3 and RQ.4. To evaluate security solutions and identify the best-…tted security solution among alternatives for a particular context a methodology for measuring and comparing security risk variables, security solution variables and trade-o¤ parameters is needed. This is covered by contributions 4 and 5 of this work. Contribution 4 is a methodology for evaluating the e¤ect that a security solution has on a security risk while contribution 5 is a methodology for identifying the best-…tted security solution taking security, development, project and …nancial perspectives into consideration. This means that C.4 addresses research question RQ.1, RQ.2 and RQ.4 and that C.5 addresses research question RQ.3 and RQ.4. 1.3.1 Publications The work presented in this thesis is supported by a number of papers that each discusses issues related to the seven components of the AORDD framework to some degree. However, only three of the papers in the below publication list are enclosed as appendices to this thesis. These are P.16, P.17 and P.26. P.16 gives an overview of the AORDD framework and its components. P.17 and P.26 describe parts of the …rst and second version of the AORDD security solution trade-o¤ analysis. This thesis gives an overview of the current version of the AORDD framework in Part 3 and describes the current version of the two core components of the AORDD framework; the security solution trade-o¤ analysis and trade-o¤ tool and the trust-based information aggregation schema, in Parts 4 and 5. Details of which component(s) of the AORDD framework that the other relevant papers in the below publication list discusses are given throughout this work. P.1: Siv Hilde Houmb, Folker den Braber, Mass Soldal Lund and Ketil Stølen. Towards a UML Pro…le for Model-based Risk Assessment. In Proceedings of the First Satellite Workshop on Critical System Development with UML (CSDUML‘02) at the Fifth International Conference on the Uni…ed Modeling Language (UML’2002). Pages 79-92, TU-Munich Technical Report number TUM-I0208. Dresden, Germany, 2002. P.2: Theodosis Dimitrakos, Brian Ritchie, Dimitris Raptis, Jan Øyvind Aagedal, Folker den Braber, Ketil Stølen and Siv Hilde Houmb. Integrating modelbased security risk management into eBusiness systems development - the CORAS Approach. In Proceedings of the IFIP Conference on Towards The Knowledge Society: E-Commerce, E-Business, E-Government. Pages 159-
1.3 Main contributions of this work
9
175, Vol. 233, Kluwer IFIP Conference Proceedings. Lisbon, Portugal, 2002. ISBN 1-4020-7239-2. P.3: Ketil Stølen, Folker den Braber, Rune Fredriksen, Bjørn Axel Gran, Siv Hilde Houmb, Mass Soldal Lund, Yannis C. Stamatiou and Jan Øyving Aagedal. Model-based risk assessment - the CORAS approach. In Proceedings of Norsk Informatikkonferanse (NIK’2002), Pages 239-249, Tapir, 2002. P.4: Siv Hilde Houmb, Trond Stølen Gustavsen, Ketil Stølen and Bjørn Axel Gran. Model-based Risk Analysis of Security Critical Systems. In FischerHubner and Erland Jonsson (Eds.): Proceedings of the 7th Nordic Workshop on Secure IT Systems. Pages 193-194, Karlstad University Press, Karlstad, Sweden, 2002. P.5: Ketil Stølen, Folker den Braber, Theodosis Dimitrakos, Rune Fredriksen, Bjørn Axel Gran, Siv Hilde Houmb, Yannis C. Stamatiou and Jan Øyving Aagedal. Model-Based Risk Assessment in a Component-Based Software Engineering Process: The CORAS Approach to Identify Security Risks. In Franck Barbier (Eds.): Business Component-Based Software Engineering. Chapter 10, pages 189-207, Kluwer, ISBN: 1-4020-7207-4, 2002. P.6: Siv Hilde Houmb and Kine Kvernstad Hansen. Towards a UML Pro…le for Model-based Risk Assessment of Security Critical Systems. In Proceedings of the Second Satellite Workshop on Critical System Development with UML (CSDUML‘03) at the Sixth International Conference on the Uni…ed Modeling Language (UML’2003). Pages 95-103, TU-Munich Technical Report number TUM-I0323. San Francisco, CA, USA, 2003. P.7: Glenn Munkvoll, Gry Seland, Siv Hilde Houmb and Sven Ziemer. Empirical assessment in converging space of users and professionals. In Proceedings of the 26th Information Systems Research Seminar in Scandinavia (IRIS’26). 14 Pages. Helsinki, Finland, 9-12 August, 2003. P.8: Siv Hilde Houmb and Jan Jürjens. Developing Secure Networked Web-based Systems Using Model-based Risk Assessment and UMLsec. In Proceedings of IEEE/ACM Asia-Paci…c Software Engineering Conference (APSEC2003). Pages 488-498, IEEE Computer Society. Chiang Mai, Thailand, 2003. ISBN 0-7695-2011-1. P.9: Jan Jürjens and Siv Hilde Houmb. Tutorial on Development of SafetyCritical Systems and Model-Based Risk Analysis with UML. In Dependable Computing, First Latin-American Symposium, LADC 2003. Pages 364-365, LNCS 2847, Springer Verlag. Sao Paolo, Brazil, 21-24 October 2003. ISBN 3-540-20224-2.
10
1. Research Context
P.10: Siv Hilde Houmb and Ørjan M. Lillevik. Using UML in Risk-Driven Development. In H.R. Arabnia, H. Reza (Eds.): Proceedings of the International Conference on Software Engineering Research and Practice, SERP ’04. Volume 1, Pages 400-406, CSREA Press. Las Vegas, Nevada, USA, 21-24 June 2004. ISBN 1-932415-28-9. P.11: Siv Hilde Houmb, Geri Georg, Robert France and Dan Matheson. Using aspects to manage security risks in risk-driven development. In Proceedings of the Third International Workshop on Critical Systems Development with UML (CSDUML‘04) at the Seventh International Conference on the Uni…ed Modeling Language (UML’2004). Pages 71-84, TU-Munich Technical Report number TUM-I0415. Lisbon, Portugal, 2004. P.12: Jingyue Li, Siv Hilde Houmb and Axel Anders Kvale. A Process to Combine AOM and AOP: A Proposal Based on a Case Study. In Proceedings of the 5th Workshop on Aspect-Oriented Modeling (electronic proceeding) at the Seventh International Conference on the Uni…ed Modeling Language (UML’2004). 8 pages, ACM. Lisbon, Portugal, 11 October 2004. P.13: Jan Jürjens and Siv Hilde Houmb. Risk-driven development process for security-critical systems using UMLsec. In Ricardo Reis (Ed.): Information Technology, Selected Tutorials, IFIP 18th World Computer Congress, Tutorials. Pages 21-54, Kluwer. Toulouse, France, 22-27 August 2004. ISBN 1-4020-8158-8. P.14: Mona Elisabeth Østvang and Siv Hilde Houmb. Honeypot Technology in a Business Perspective. In Proceedings of Symposium on Risk-Management and Cyber-Informatics (RMCI’04): the 8th World Multi-Conference on Systemics, Cybernetics and Informatics (SCI 2004). Pages 123-127, International Institute of Informatics and Systemics. Orlando, FL, USA, 2004. P.15: Siv Hilde Houmb, Ole-Arnt Johnsen and Tor Stålhane. Combining Disparate Information Sources when Quantifying Security Risks. In Proceedings of Symposium on Risk-Management and Cyber-Informatics (RMCI’04): the 8th World Multi-Conference on Systemics, Cybernetics and Informatics (SCI 2004). Pages 128-131, International Institute of Informatics and Systemics. Orlando, FL, USA, 2004. P.16: Siv Hilde Houmb and Geri Georg. The Aspect-Oriented Risk-Driven Development (AORDD) Framework. In Proceedings of the International Conference on Software Development (SWDC-REX). Pages 81-91, University of Iceland Press. Reykjavik, Iceland, 2005. ISBN 9979-54-648-4. P.17: Siv Hilde Houmb, Geri Georg, Robert France, Jim Bieman and Jan Jürjens. Cost-Bene…t Trade-O¤ Analysis Using BBN for Aspect-Oriented RiskDriven Development. In Proceedings of the Tenth IEEE International Con-
1.3 Main contributions of this work
11
ference on Engineering of Complex Computer Systems (ICECCS2005). Pages 195-204, IEEE Computer Society Press. Shanghai, China, 2005. ISBN 0-76952284-X. P.18: Siv Hilde Houmb. Combining Disparate Information Sources When Quantifying Operational Security. In Proceedings of the 9th World Multi-Conference on Systemics, Cybernetics and Informatics, Volume I. Pages 128-131, International Institute of Informatics and Systemics. Orlando, USA, 2005. ISBN 980-6560-53-1. P.19: Siv Hilde Houmb, Geri Georg, Robert France, Raghu Reddy and Jim Bieman. Predicting Availability of Systems using BBN in Aspect-Oriented Risk-Driven Development (AORDD). In Proceedings of 2nd Symposium on Risk Management and Cyber-Informatics (RMCI’05): the 9th World MultiConference on Systemics, Cybernetics and Informatics, Volume X. Pages 396-403, International Institute of Informatics and Systemics. Orlando, USA, 2005. ISBN 980-6560-62-0. P.20: Siv Hilde Houmb and Karin Sallhammar. Modeling System Integrity of a Security Critical System Using Colored Petri Nets. In Proceedings of Safety and Security Engineering (SAFE 2005). Pages 3-12, WIT Press. Rome, Italy, 2005. ISBN 1-84564-019-5. P.21: Jan Jürjens and Siv Hilde Houmb. Dynamic Secure Aspect Modeling with UML: From Models to Code. In Model Driven Engineering Languages and Systems: 8th International Conference, MoDELS 2005. Pages 142-155, LNCS 3713, Springer Verlag. Montego Bay, Jamaica, 2-7 October 2005. ISBN 3-54029010-9. P.22: Dan Matheson, Indrakshi Ray, Indrajit Ray and Siv Hilde Houmb. Building Security Requirement Patterns for Increased E¤ectiveness Early in the Development Process. Symposium on Requirements Engineering for Information Security (SREIS). Paris, 29 August, 2005. P.23: Geri Georg, Siv Hilde Houmb and Dan Matheson. Extending Security Requirement Patterns to Support Aspect-Oriented Risk-Driven Development. Workshop on Non-functional Requirement Engineering at the 8th International Conference on Model Driven Engineering Languages and Systems, MoDELS 2005. Montego Bay, Jamaica, October 2-7 2005. P.24: Siv Hilde Houmb, Indrakshi Ray and Indrajit Ray. Estimating the Relative Trustworthiness of Information Sources in Security Solution Evaluation. In Ketil Stølen, William H. Winsborough, Fabio Martinelli and Fabio Massacc (Eds.): Proceedings of the 4th International Conference on Trust Management (iTrust 2006). Pages 135-149, LNCS 3986, Springer Verlag, Pisa, Italy, 16-19 May 2006.
12
1. Research Context
P.25: Geri Georg, Siv Hilde Houmb and Indrakshi Ray. Aspect-Oriented Risk Driven Development of Secure Applications. In Damiani Ernesto and Peng Liu (Eds.), Proceedings of the 20th Annual IFIP WG 11.3 Working Conference on Data and Applications Security 2006 (DBSEC 2006). Pages 282-296, LNCS 4127, Springer Verlag, Sophia Antipolis, France, 31 July - 2 August 2006. P.26: Siv Hilde Houmb, Geri Georg, Robert France and Jan Jürjens. An Integrated Security Veri…cation and Security Solution Design Trade-o¤ Analysis. In Haralambos Mouratidis and Paolo Giorgini (Eds), Integrating Security and Software Engineering: Advances and Future Visions. Chapter 9, Pages 190-219. Idea Group Inc, 2007. ISBN: 1-59904-147-6. 288 pages. P.27: Siv Hilde Houmb, Geri Georg, Robert France, Dorina C. Petriu and Jan Jürjens (Eds.). In Proceedings of the 5th International Workshop on Critical Systems Development Using Modeling Languages (CSDUML 2006). 87 pages. Research Report Telenor R&I N 20/2006, 2006. P.28: Geri Georg, Siv Hilde Houmb, Robert France, Ste¤en Zschaler, Dorina C. Petriu and Jan Jürjens. Critical Systems Development Using Modeling Languages – CSDUML 2006 Workshop Report. In Thomas Kühne (Eds.), Models in Software Engineering: Workshops and Symposia at MoDELS 2006, Genoa, Italy, October 1-6, 2006, Reports and Revised Selected Papers. Pages 27-31, LNCS 4364, Springer Verlag, 2007. P.29: Dorina C. Petriu, C. Murray Woodside, Dorin Bogdan Petriu, Jing Xu, Toqeer Israr, Geri Georg, Robert B. France, James M. Bieman, Siv Hilde Houmb and Jan Jürjens. Performance analysis of security aspects in UML models. In Proceedings of the 6th International Workshop on Software and Performance, WOSP 2007. Pages 91-102, ACM. Buenes Aires, Argentina, 5-8 February 2007. ISBN 1-59593-297-6.
1.4 Research method and way of work The research method adopted in this work is action research [90]. In action research the construction and evaluation of an approach under development is done in an integrating and re‡ecting context. This means that the constructors (such as developers of software systems or researches of methodology) and end-users work together in a setting that enables the end-users to express their goals and opinions explicitly and implicitly and the constructor can passively observe and actively interact with the tasks performed by the end-users. Here, the goal of the constructor is to understand the why, when and what of the tasks performed by
1.4 Research method and way of work
13
the end-users. The latter is called change and re‡ection and hence the emphasis in action research is more on what practitioners do than on what they say they do. Action research comes in a number of shapes and are applied in …elds such as organisation development and education and health [90, 99]. Lately, action research has also been adapted for and applied in the software engineering domain [100], such as that of the CORAS project [19]. More information and appropriate references on action research and theory on community of practice for which action research is based upon are in Munkvoll et al. (2003) [76]. 1.4.1 Application of action research for this work Most action research projects set out to explicitly study something in order to change and improve it. In many cases the need for change or improvement arises from an unsatisfactory situation that those a¤ected want to improve. However, it can also arise from a need to extend or re…ne an already satisfactory situation. As improvement can only be facilitated by a complete understanding of the particular work situation it is important to ensure that the constructors have the ability to study and understand the problems of the end-users. This is best done through practical participation and experimentation. Hence, the process of action research is iterative and usually consists of some variation of the three phases: hypothesis, …eldwork and analysis and conclusion based on the results from the …eldwork and analysis. This work has used an example-driven action research approach both for the initial explorative phase and for the development and evaluation phase. The explorative phase focused on understanding the needs of the decision maker (end-user) in the context of security solution decisions. This was performed in a number of iterations through execution and observation of security solution decision situations using simulation examples. The development and evaluation phase included the interpretation of the result from the explorative phase and change and re‡ection through example-driven testing of alternative approaches and techniques to the problems or challenges discovered. This phase also went through a number of iterations as well as reiterated back to the explorative phase as it became evident that a better understanding of the problems and challenges involved in security solution decisions were needed. These two phases constitute the overall work process of this work. To achieve a structured and repeatable process within each of the two work phases each was called a construction process and structured like a development process as shown in Figure 1.2. As action research is used in this work the testing phase is extended to include prototyping. Also, as the evaluation is example-driven through testing and pro-
14
1. Research Context
Requirements Phase
Test and Prototyping Phase
Design Phase
Implementation Phase
Evaluate, Refine and Update Phase
Fig. 1.2. The phases and iterations of the construction (work) process
Develop version n of approach
Test version n of approach in trial n
Evaluation of version n of approach If approach does not meet requirements, or predefined goals not met: n=n+1 Requirements and predefined goals are met (sufficently met)
Fig. 1.3. Action research and how it in‡uenced the construction process
totyping an additional loop-back phase called evaluate, re…ne and update are performed in all iterations before …nally entering the implementation phase. This ensures that the approach developed is su¢ ciently mature and evaluated before any implementation activity is started. Hence, the work process iterates between all phases, as well as between the testing and prototyping phase and the requirements phase. This means that several iterations involving the four …rst phases were executed before any full iteration was performed. Figure 1.3 shows how action research in‡uenced the construction process while Figure 1.4 illustrates how the community of practice was built and maintained throughout this work and and gives an overview of the step-wise construction and evaluation strategy adapted in this work.
1.4 Research method and way of work
2
1
Practitioners
15
Constructors
Test and evaluation through example runs
3
4
Evaluation session: Examine evaluation results, and refine and update methdology
Fig. 1.4. The evaluation and validation process used in this work
As can be seen in Figure 1.4 the communities of practice were built and maintained using three main constructs: (1) Requirement speci…cation, design, testing and implementation with involvement from both the practitioner and constructor roles where the practitioners execute and the researchers observe. (2) Test and evaluation through practical examples. (3) Evaluation, re…ne and update based on the results from the example runs. An important question in the latter was: Did the methodology meet its intentions su¢ ciently in terms of feasibility, usability and applicability? The results from the evaluation session in (3) are used as input to the next iteration in the construction of the methodology. This process was repeated until the requirements of the end-user were met or the goal of this work was su¢ ciently achieved. This work re-engineered parts of the ACTIVE e-commerce platform in three full iterations of the action research based work process described above. Each of these iterations are called a study and referred to as study 1, 2 and 3 in Figure 1.1. These studies are simulation examples as they were not carried out in an industrial setting but rather in a research setting. Details are given in Chapter 18. In addition to the three simulation examples included as part of the action research work process three controlled experiments were executed; one using students at NTNU and two using a mixture of students and people with relevant industrial background at Colorado State University, Fort Collins, US. These three
16
1. Research Context
experiments were performed to explore the relation between some of the variables in the trust-based information aggregation schema described in Part 5 of this thesis. A selection of the results from the …rst experiment is given in Houmb, Johnsen and Stålhane (2004) [49].
2. Outline of the Thesis
As can be seen from the publication list in Section 1.3.1 this work has crawled down many small paths. The reason for this is that risk assessment and management is still a rather new …eld within the security domain and quanti…cation of security risks, security levels or operational security level of information systems are even less explored. However, during the last thirteen years, since the publication of the …rst major paper on quantifying security risks as an operational measure by Littlewood et al. (1993) [74], the focus has shifted but the domain is still far from mature. There is thus substantial work left in advocating a broader acceptance on the importance of structured and formalised security assessment and management both during development and as a continuous day-to-day activity and particular on how to handle security risk in relation to other perspectives. The latter has however improved as the …nancial factors became more important during and after the massive breakdown of the dot-com bubble in 2001. In an attempt to avoid confusing the reader by presenting the many detours in this work the focus is put on three topics and these are: (1) Giving an overview of the AORDD framework. (2) Describing the AORDD security solution trade-o¤ analysis and associated trade-o¤ tool. (3) Describing the trust-based information aggregation schema used to combine information as input to the trade-o¤ tool. The reminder of this work is organised as follows: Part 2: Background Information and State of the Art. This part provides background information in terms of state of the art within security and risk assessment and management, risk management processes and development processes relevant for this work. This part also gives an overview of relevant security standards and describes the state of the art in security evaluation, quantifying security, architectural/design trade-o¤ analysis and subjective expert judgment. Part 3: Security Solution Decision Support Framework. This part is the …rst of the three main parts of this work and gives an overview of the AORDD framework and its seven components. This part also looks into how each of these components
18
2. Outline of the Thesis
relates to each other and how each contributes in aiding a decision maker in choosing a security solution among alternatives. Part 4: AORDD Security Solution Trade-O¤ Analysis. This part is the second of the three main parts of this work and provides details on the AORDD security solution trade-o¤ analysis, which is one of two main components of the AORDD framework. The trade-o¤ analysis is implemented as the BBN topology trade-o¤ tool which is also described in this part. Part 5: Aggregating information in the trade-o¤ tool. This part is the last of the three main parts of this work and describes the steps-wise trust-based information aggregation schema, which is an performance-based weighting expert opinion aggregation schema tailored for security solution decision support. This part also gives an overview of information sources suitable for estimating the security risks and security solutions variables in the AORDD security solution trade-o¤ analysis and trade-o¤ tool. Part 6: Validation, Discussion and Concluding Remarks. This part concludes this work and contains a validation of the applicability, feasibility and usability of the AORDD framework as a security solution decision support approach by demonstrating the use of the trust-based performance weighting schema and the AORDD security solution trade-o¤ analysis and trade-o¤ tool. In addition, this part includes a discussion of the strengths and weaknesses of the AORDD framework as a security solution decision support framework and concludes with a summary of this work, as well as some insights into ongoing and further work. Part 7: Appendices. This part contains the appendices to this work which is the following: Appendix A: AORDD Concepts Appendix B.1: P.16: Houmb and Georg (2005); The Aspect-Oriented RiskDriven Development (AORDD) Framework Appendix B.2: P.26: Houmb et al. (2006); An Integrated Security Veri…cation and Design Security Solution Trade-o¤ Analysis Appendix B.3: P.17: Houmb et al. (2005); Cost-Bene…t Trade-O¤ Analysis Using BBN for Aspect-Oriented Risk-Driven Development Appendix C: Publication list
Part II
Background Information and State of the Art
3. Security in Information Systems
According to ISO 15408:2006 Common Criteria for Information Technology Security Evaluation Common Criteria [15] security is about protection of assets from unauthorised disclosure, modi…cation or loss of use. Hence, the goal of security assurance is to establish con…dence in that assets are su¢ ciently protected from potential security risks. Assets in this context are entities that have a value to one or more of the system stakeholders. The ascribed meaning of security, security threats and security attacks in relation to an information system is however ambiguously de…ned and used. This is also the case across well-known security standards, such as ISO 15408:2006 Common Criteria for Information Technology Security Evaluation Common Criteria [15], ISO/IEC 17799:2000 Information technology –Code of Practice for information security management [55] and ISO/IEC TR 13335:2001 Information technology – Guidelines for management of IT Security [54]. ISO/IEC 17799 talks about information security while ISO 15408 (Common Criteria) and ISO/IEC TR 13335 targets Information Technology (IT) security. Furthermore, Common Criteria and ISO/IEC 17799 de…ne security to include con…dentiality, integrity and availability of IT and information systems respectively while ISO/IEC 13335 has a broader scope that also covers the security attributes authenticity, accountability, nonrepudiation and reliability. This ambiguity makes it hard to communicate and manage security and leads to confusion and imprecise description of the potential undesired behaviour of a system. To meet these challenges and avoid confusion in the context of this work a clear and precise de…nition of the involved concepts including security, security threats, security attacks, security assessment, security management, security assurance and security evaluation is given in the following. IT security relates to an IT system while information security relates to an information system. IT systems are systems with computers connected to a network containing data, software and hardware as a potential target for intended or unintended security attacks that might a¤ect either the system itself, its data or its stakeholders and users [54]. An information system goes beyond the concept of computers and does also covers the conceptual parts related to a system, such as
22
3. Security in Information Systems
the people who use, develop, manage and maintain the system. Hence, IT systems are the computerised part of an information system. This work targets information systems and has adopted the de…nition of information system from the architecture standard IEEE Std 1471-2000 Recommended Practice for Architectural Description of Software–Intensive Systems [52] while security is understood as information security and de…ned according to ISO/IEC TR 13335, which includes all seven security attributes. De…nition Information system is a system containing physical and conceptual entities that interacts as a potential target for intended or unintended security attacks which might a¤ ect either the system itself, its data or its stakeholders and end-users (modi…ed from IEEE Std 1471–2000 [52]). De…nition Information security comprises all perspectives related to de…ning, achieving, and maintaining con…dentiality, integrity, availability, nonrepudiation, accountability, authenticity and reliability of an information system (adapted and modi…ed for information security from ISO/IEC TR 13335 [54]). According to the Common Criteria a security critical information system is a system where information held by IT products is a critical resource which enables organisations to succeed in their mission. This means that the success of such a system is highly dependent on its perceived level of security. The security level of an information system should be understood as the ability of the system to meet the end-users expectations and ensure that their personal information is kept con…dential (secret), is available to them upon request and is not modi…ed by unauthorised users. An information system should perform its functionality while exercising proper control of the contained information to ensure that it is protected against unwanted or unwarranted dissemination, alternation or loss. The term IT security is used in the Common Criteria to cover prevention and mitigation of undesired events a¤ecting the value of assets. De…nition Assets are entities that have value to one or more of the system stakeholders modi…ed from [15]). De…nition Stakeholder is an individual, team or organisation (or classes thereof ) with interest in or concerns relative to an information system (modi…ed from the software architectural standard IEEE 1471 [52]). De…nition Physical assets are physical entities of value to one or more stakeholders, such as hardware and other infrastructure entities, operating systems, application and information (interpretation of de…nition given in [20]).
3. Security in information systems
23
De…nition Conceptual assets are non-physical entities of value to one or more stakeholders, such as people and their skills, training, knowledge and experience, and the reputation, knowledge and experience of an organisation (interpretation of de…nition given in [20]). De…nition Asset value is the value of an asset in terms of its relative importance to a particular stakeholder. This value is usually expressed in terms of some potential business impacts. This could in turn lead to …nancial losses, loss of revenue, market share or company image (modi…ed from the risk management standard AS/NZS 4360:2004 [4]). In this work, as in AS/NZS 4360:2004, CRAMM and CORAS, assets are the centre of the attention and de…nes the entities of concern in an information system. In the reminder of this work a security critical information system is understood as a system that contains assets with values which it is critical to preserve one or more of the security attributes of. Here, critical means that security attacks against the security attributes of such a system might lead to unacceptable loss of value of one or more of the asset for at least one of the involved stakeholders. Such systems include for example systems for e-commerce, medical systems, …nancial systems and databases that stores personal information. The preservation of the information held by these systems is often a critical success factor for the organisation and its stakeholders to succeed in their goals. End-users or anyone that are involved in the day-to-day use of these systems expect that the sensitive information they provide to the system are adequately protected. De…nition Security critical information system is an information system where there are assets with values for which it is critical to preserve one or more of the security attributes of (modi…ed from [15]). De…nition Con…dentiality (or secrecy) means that information is made available or disclosed only to authorised individuals, entities or processes [54]. De…nition Integrity means that information is not destroyed or altered in an unauthorised manner and that the system performs its intended function in an unimpaired manner free from deliberate or accidental unauthorised manipulation of the system [54]. De…nition Availability means that system services are accessible and usable on demand by an authorised entity [54]. De…nition Authenticity ensures that the identity of a subject or resource is the one claimed [54]. De…nition Accountability Accountability means that actions of an entity may be traced uniquely to the entity [54].
24
3. Security in Information Systems
De…nition Non-repudiation is the ability to prove that an action or event has taken place in order to prevent later repudiation of this event or action [54]. De…nition Reliability is the ability of an item to perform a required function under stated conditions [96] (Please note that the use of the term “item” intentionally allows for the calculation of reliability for individual components or for the system as a whole.). A security threat denotes a potential action that violates one or more security attributes of an information system by exploiting vulnerabilities in the information system. A security attack is the employment of a security threat. Such threats and attacks denote unauthorised use of an information system and can be either intentional or unintentional (accidental). Furthermore, a security attack might be initiated by both external and internal users of an information system. In fact, research indicates that about 80% of all security breaches are caused by insiders, meaning a company’s own employees. Security attacks can be either active or passive [95]. In an active attack the intruder engages in tampering with the information being exchanged either through modi…cation of data streams or through creation of false data streams. Active attacks target the integrity, availability and authenticity of assets and the accountability and non-repudiation of the identity and actions of the authorised users of a system. In a passive attack the intruder observes the information passing through a communication channel without interfering with its ‡ow or content. Passive attacks a¤ect the con…dentiality of assets.
3.1 Security standards and regulations Security management standards aid in the overall and detailed management of security in an organisation. In this work the most relevant standards within the security domain are the ISO/IEC 17799:2000 Information Technology – Code of Practice for information security management [55], ISO/IEC TR 13335:2001 Information Technology –Guidelines for management of IT Security [54] and the Australian/New Zealand standard for risk management AS/NZS 4360:2004 [4]. However, it is important to note the distinction between security management and security risk management. The …rst do not necessary include any use of structured risk analysis methods while the latter does. Security management is often aided by the use of checklists, vulnerability analysis and other similar security analysis. Risk analysis in the context of this work refers to safety analysis methods adapted to the security domain, such as those described in the CORAS framework [97].
3.1 Security standards and regulations
25
The security management standard ISO/IEC 17799 provides recommendations for information security management and supports the people in an organisation that are responsible for initiating, implementing or maintaining security in an organisation. The standard aid in developing organisational-speci…c security standards and hence ensures e¤ective security management in practice. The standard also provides guidelines about how to establish con…dence in inter-organisational matters. The security management standard ISO/IEC 13335 provides guidance on how to manage IT security. Here, the main objectives are to de…ne and describe the concepts associated with the management of IT security, to identify the relationships between the management of IT security and management of IT in general, to present models for reasoning about IT security and to provide general guidance on the management of IT security. AS/NZS 4360 is a widely recognised and used standard within the risk assessment and management domain. The standard is a general risk management standard that has been tailored for security risk assessment and management in the CORAS framework [97]. The standard includes a risk management process that consists of …ve assessment sub-processes and two management sub-processes, a detailed activity description for each sub-process, a separate guideline companion standards and general risk management advice. More information on risk management and AS/NZS 4360 is in Chapter 5. The last category of security standards relevant for this work is security evaluation standards. ISO 15408:2005 Common Criteria for Information Technology Security Evaluation [15] is an example of a security evaluation standard. Such standards with their associated evaluation techniques and guidelines have been around since the beginning of the 1980s. The oldest known standard for evaluation and certi…cation of information security of IT products is the Trusted Computer System Evaluation Criteria (TCSEC) [24]. The standard was developed by the US Department of Defense (DoD), issued in 1985 and evaluates systems according to the six prede…ned classes: C1, C2, B1, B2, B3 and A1. These classes are hierarchically arranged with A1 as the highest level and C1 is the lowest level (actually TCSEC groups these classes into four categories: A, B, C and D, but category D is not used for certi…cation). Each class contains both functional and assurance requirements. The functional requirements are divided into authentication, role-based access control, obligatory access control and logging and reuse of objects. TCSEC is also known as the Orange Book and was developed with military IT systems in mind. The standard was to some extent also used to evaluate industrial IT products but was shown to be too cost and resource demanding and thus not su¢ ciently e¤ective in an industrial setting.
26
3. Security in Information Systems
As a response to the development of TCSEC the United Kingdom, Germany, France and the Netherlands produced their own national evaluation criteria. These were harmonised and in 1991 published under the name Information Technology Security Evaluation Criteria (ITSEC) [25]. ITSEC certi…cation of a software product means that users can rely on an assured level of security for any product they are about to purchase. As for TCSEC, ITSEC certify products according to prede…ned classes of security (E0, E1, E2, E3, E4, E5 and E6). A similar activity was also undertaken in Canada by the Communications Security Establishment (CSE), which is an intelligence agency of the Canadian government charged with the duty of keeping track of foreign signals intelligence. The Canadian initiative led to the Canadian Trusted Computer Product Evaluation Criteria (CTCPEC) [39]. CTCPEC was published in 1993 and combines the TCSEC and ITSEC approaches. However, TCSEC, ITSEC and CTCPEC did not su¢ ciently address the needs from industry and the International Organization for Standardization (ISO) started combining these e¤orts into one industrial adapted version called the Common Criteria (ISO 15408). This work started in 1990 and led to the publication of the Common Criteria version 1.0 in 1995. The Common Criteria has since then largely taken over for TCSEC, ITSEC and CTCPEC. The idea behind the Common Criteria was to merge the three existing approaches into a world wide framework for evaluating security properties of IT products and systems. The standard incorporates experience from TCSEC, ITSEC, CTCPEC and other relevant standards and provides a common set of requirements for the security functions of IT products and systems. As for its predecessors certi…cation is done according to prede…ned levels. In the Common Criteria these are called evaluation assurance levels (EAL) and there are seven EALs: EAL1, EAL2, EAL3, EAL4, EAL5, EAL6 and EAL7 where EAL 7 is the highest level and includes requirements for the use of formal methods during the development of the IT product. The Common Criteria also provide a program called Arrangement on the Recognition of Common Criteria Certi…cates in the …eld of IT Security (CCRA) and an evaluation methodology called Common Methodology for IT Security Evaluation (CEM). These two together ensure the equality and quality of security evaluations such that results from independent evaluations can be compared and hence aid decision makers (customers) in choosing among security solutions. More information on CCRA and CEM is given in Chapter 4. A common problem for most security evaluations however is the large amount of information involved. The result of evaluations is also subject to bias as the evaluation is done by one or a few evaluators. However, these evaluators must usually be certi…ed to perform the evaluation but that does not prevent the
3.1 Security standards and regulations
27
evaluation from involving a high degree of subjectivity. It is these problems that the AORDD framework, and in particular the AORDD security solution tradeo¤ analysis described in Part 4 of this work and the trust-based information aggregation schema described in Part 5 of this work, is meant to aid.
4. Common Criteria for Information Technology Security Evaluation
The current version of the Common Criteria is version 3.1 [15] which was published in September 2006. As with its preceding versions, version 3.1 consist of four parts: Common Criteria Part 1, Common Criteria Part 2, Common Criteria Part 3 and the Common Methodology for Information Technology Security Evaluation (CEM), with the associated numbers CCMB-2006-09-001, CCMB-200609-002, CCMB-2006-09-003 and CCMB-2006-09-004 respectively. Here, Common Criteria Parts 1 to 3 contain the general model, the security functional components and the security assurance components and targets mainly developers and consumers of IT products. The CEM is a guidance tool for a Common Criteria evaluator that also provides useful information and guidance for developers in preparing information for the evaluation and for consumers in getting an insight into the activities leading to the evaluation conclusion and on how to read and interpret the evaluation result. The Common Criteria provides a methodology and process that allows for comparability between results of independent security evaluations. This is the main contribution of the Common Criteria to the security evaluation domain. The standard does this by providing a common set of requirements for the security functionality of IT products and for the assurance measures that are applied to these products during evaluation. In addition, the Common Criteria o¤ers constructs for consumers to specify their security requirements and evaluation results formulated such that it helps a consumer to determine whether a particular IT product ful…ls their security needs. During a Common Criteria evaluation the IT product is denoted Target of Evaluation (ToE). A ToE can consist of any speci…ed combination of hardware, …rmware or software, the development environment of these and the operational environment that these are intended to work in or evaluated for. Hence, a ToE is a speci…c con…guration of an IT product. It should be noted however that the procedures and techniques used for accreditation of IT products according to the evaluation results are outside the scope of the Common Criteria and are handled by separate evaluation authorities. Guidance on certi…cation and accreditation
30
4. The Common Criteria
and a set of experience and interpretation documents for all parts of a Common Criteria evaluation and certi…cation are available for download from the Common Criteria portal (see http://www.commoncriteria.org). There are three groups with general interest in a Common Criteria evaluation and these are consumers, developers and evaluators. Consumers can use Common Criteria evaluations and Common Criteria information to assist in procurement of IT products. This means that a consumer can have alternative IT products to choose between and would like to identify which of the alternatives that are best-…tted to his or her needs. Thus, consumers can use the Common Criteria to compare di¤erent IT products con…gured into ToEs in a Common Criteria evaluation. Consumers may also use Protection Pro…les (PP) to specify their security requirements (also called needs). A PP is a particular set of security requirements speci…ed for a type or group of IT Products that can either be certi…ed separately or used as a requirement speci…cation. Developers use the Common Criteria to assist in the identi…cation of security requirements and to package information on the security of their IT product to aid consumers in their procurement (or rather convince a consumer to purchase their product). The above is achieved by following the general guidelines given in Common Criteria Part 1 and the guidelines for selection and assignment of the security functional components in Common Criteria Part 2. An evaluator uses the Common Criteria to aid in deriving and formulating judgments about the conformance of a ToE to its security requirements. The Common Criteria also gives the evaluator guidelines on which actions to carry out during a Common Criteria evaluation. Generally, an evaluator is supported by the security assurance components in Common Criteria Part 3 and the evaluation methodology in CEM.
4.1 Relevant parts of Common Criteria terminology As discussed earlier the security domain is not consistent in the use of and ascribed meaning of the concepts involved in assessing, managing and evaluating the security of information systems. Therefore, this section provides the Common Criteria security evaluation concepts relevant for this work. This is to aid in the understanding of the focus and contribution of this work. The de…nitions are taken from Common Criteria v3.1 Part 1. Please note that a de…nition of the concept ‘asset’is not included in the de…nition list below as it has been de…ned earlier. Any concepts used by this work not given in the below de…nition list are de…ned when …rst used. There are also concepts where the ascribed meaning in
4.2 Evaluation and certi…cations according to the Common Criteria
31
this work di¤ers from that of the Common Criteria. Any such situation is clearly stated throughout this work. De…nition Development environment is the environment in which the ToE is developed [15]. De…nition Evaluation authority is a body that implements the Common Criteria for a speci…c community by means of an evaluation scheme and thereby sets the standards and monitors the quality of evaluation conducted by bodies within that community [15]. De…nition Evaluation scheme is the administrative and regulatory framework under which the Common Criteria is applied by an evaluation authority within a speci…c community [15]. De…nition Operational environment is the environment in which the ToE is operated [15]. De…nition Security Target (ST) is an implementation-dependent statement of the security needs for a speci…c TOE [15]. De…nition Protection Pro…le (PP) is an implementation-independent statement of security needs for a TOE type [15]. De…nition Target of Evaluation (ToE) is a set of software, …rmware and/or hardware possibly accompanied by guidance [15]. De…nition User is any external entity (human user or machine user) to the ToE that interacts (or may interact) with the ToE [15]. It should be noted from the de…nition of ToE and the earlier de…nition of IT system (product) and information system that a ToE does not fully address all perspectives of an information system. A ToE covers parts or whole of the computerised part of an information system. As discussed earlier an IT system is the computerised part of an information system and hence in this work an information system covers the ToE, the user, the development environment and operational environment and has a broader scope than the Common Criteria. Details are given in Parts 3 and 4 of this thesis.
4.2 Evaluation and certi…cations according to the Common Criteria The Common Criteria recognises two types of evaluations: (1) ST/ToE evaluation and (2) PP evaluation. In case of an ST/TOE evaluation particular parts of or
32
4. The Common Criteria
Objectives
Requirements
Specifications
Mechanisms
Fig. 4.1. ST, PP and ToE in relation to phases of a development process
the whole IT product are de…ned into a ToE. In case of a PP evaluation particular parts of or the whole IT product type is de…ned into a ToE type. A PP is an implementation-independent version of a particular IT product type, such as Smart Cards. This means that a PP can be looked upon as a template for a type of IT products. Figure 4.1 illustrates the process of a Common Criteria evaluation in relation to a standard development process while Figure 4.2 shows the relationship between PP, ST and ToE. The important factor to note in this context is that the result of either a PP or ST/ToE evaluation is stored for later reuse in a PP and ToE registry respectively. As discussed earlier the Common Criteria does not directly deal with the certi…cation and accreditation process. This is done by local evaluation authorities usually on a country-wise basis using their local evaluation scheme. However, CEM is a common methodology for the Common Criteria evaluation process and provides general guidelines that these local evaluation schemes can be based upon. CEM is mutually recognised across the existing local evaluation schemes and thus contributes to enhancing the ability of consumers to compare alternative solutions. However, there are activities in an evaluation process that require subjective interpretation and opinion and thus are hard to “objectively”compare. In Norway the evaluation scheme is held by the Norwegian Certi…cation Authority for IT Security (SERTIT) operated by the Norwegian National Security Agency. This means that SERTIT is the authority issuing Common Criteria certi…cates to IT products in Norway and hence de…nes the certi…cation and accreditation methodology and process for the evaluation scheme in Norway. In practice this
4.2 Evaluation and certi…cations according to the Common Criteria
Evaluate ST
PP Evaluation Results
Evaluated PP
33
PP Registry
Evaluate ST
ST Evaluation Results
Evaluated ST
Evaluate ST
ToE Evaluation Results
Evaluated ToE
ToE Registry
Fig. 4.2. Relationship between PP, ST and ToE in Common Criteria (page 45 in Part 1 of [15])
means that SERTIT is responsible for all evaluation done within the Norwegian scheme. SERTIFF is also responsible for issuing accreditations for evaluators and thus determines who can be quali…ed evaluators in Norway. To be a quali…ed evaluator under the SERTIT scheme potential evaluators need to undertake a trial evaluation to prove their ability to understand the Common Criteria and the CEM. Quali…ed evaluators are called EVIT and accredited as a laboratory according to the Norwegian standard NS-ISO 17025 [78]. There are two o¢ cial evaluators in Norway per 30 June 2006 and these are Norconsult AS and Secode Norge AS. CCRA is the arrangement on the recognition of Common Criteria certi…cations in the …eld of IT security and is an international regulatory framework for evaluator schemes that works towards establishing certi…cation frameworks so that certi…cates from di¤erent evaluation schemes can be mutually recognised (meaning internationally recognised between the member CCRA certi…cation authorities). CCRA was established on 23 May 2000. As of 5 June 2007 there are 12 certi…cate authorisation schemes recognised by CCRA. These are the certi…cate schemes of Australia and New Zealand (Australasian Information Security Evaluation Program (AISEP)), Canada (Canadian Common Evaluation and Certi…cation Criteria Scheme), France (French Evaluation and Certi…cation Scheme), Germany (German Evaluation and Certi…cation Scheme), Japan (Japanese Evaluation and Certi…cation Scheme), the Republic of Korea (Korea IT Security Evaluation and Certi…cation Scheme (KECS)), the Netherlands (Netherlands Scheme for Certi…cation in the Area of IT Security (NSCIB)), Norway (Norwegian Certi…cation
34
4. The Common Criteria
Authority for IT Security (SERTIT)), Spain (Organismo de Certi…cacíon de la Seguridad de las Tecnologías de la Información), the United Kingdom (UK IT Security Evaluation and Certi…cation Scheme) and the United States (Common Criteria Evaluation and Validation Scheme (CCEVS)). In addition, there are 11 countries that are in the process of setting up or getting acceptance for their local schemes. These are called certi…cation consuming by the CCRA and include: Austria, the Czech Republic, Denmark, Finland, Greece, Hungary, India, Italy, Singapore, Sweden and Turkey.
4.3 Performing a Common Criteria evaluation A Common Criteria evaluation usually involves the developer and the evaluator. In some cases the consumer is known and requests the evaluation. In addition there are cases where the entity paying for the evaluation is external to the developer and therefore called the sponsor. An example of such is when the consumer is the Norwegian military authorities with the Norwegian Government paying for the evaluation. In this case the Norwegian Government is called the sponsor. The developer is always the entity that has or is developing the IT product that the evaluator evaluates using the local evaluation scheme. Since it is a particular con…guration of an IT product that is of interest in a Common Criteria evaluation the evaluation target and context are speci…ed into a ToE or type of ToE. This means that one IT product might lead to several ToEs. Note that each ToE has a development and operational environment associated to it. A Common Criteria evaluation is performed by the evaluator using Common Criteria Part 3; security assurance components. Part 3 provides a set of assurance components that de…nes a set of evaluation tasks structured into groups of components that target a particular security level and which the evaluator and the developer needs to execute. These groups of components are called Evaluation Assurance Levels (EAL). Recall that there are seven EAL levels where EAL 1 provides the lowest level of assurance and EAL 7 provides the highest level of assurance or con…dence in that the assets of the ToE are su¢ ciently protected. Before an evaluation can be carried out there are speci…c pieces of information that the developer needs to provide. These pieces of information can be derived by the developer using the Common Criteria Part 3 to guide the development of the ToE. By doing so the developer are able to prepare the necessary development documents and to perform the required analysis for a Common Criteria evaluation, such as vulnerability analysis to provide the necessary evidence that the ToE posses the required security attributes. The general idea is that the developer
4.3 Performing a Common Criteria evaluation
35
needs to provide any piece of information that is required for the evaluator to gain the necessary con…dence in the security abilities of the ToE. The evaluator uses Common Criteria Part 3 to check the development deliverables and perform additional analyses depending on which EAL the ToE targets. Generally, the Common Criteria o¤ers a well-founded, well-tested and structural industry standard means of evaluating IT products. However, the standard has not gained as wide use as anticipated. Although this is improving, for example through the adaptation of the Common Criteria in ETSI TISPAN (see http://portal.esti.org), it might be too large a framework for systems with rapid and ad-hoc development processes, short TTM, tight budget constraints and short life-time. Web-based systems, such as some e-commerce systems, are examples of systems that might fall out of the market before a Common Criteria evaluation are completed. This does not mean that the Common Criteria is not relevant for these systems. On the contrary, the very existence of these systems depends on their security level. There is a need for methodology and tool support to make the Common Criteria applicable in practice for these systems. This has partly been addressed by the AORDD Security Solution Trade-O¤ Analysis developed in this work. Details are given in Part 4.
5. Risk Assessment and Management of Information Systems
The [risk assessment] approach adopted should aim to focus security e¤ort and resources in a cost-e¤ective and e¢ cient way [1] Security is traditionally maintained through security policies and security mechanisms. Security policies specify roles related to who, what and when of an information system, meaning which users (who) can perform which actions (what) at which points in time (when). Thus, security policies give procedures and rules for the authorised use of an information system and are often on a conceptual or enterprise level of abstraction. Security mechanisms are the concrete security controls implemented in a system, such as …rewalls, …ltering on Internet gateway, encryption of communication and data and anti-virus software. The purpose of these mechanisms is to protect data, software and hardware from malicious attackers by preventing them from exposing it, altering it, removing it or in any way obstructing authorised behaviour in the system and normal internal system behaviour. Security mechanisms thus implement the security policies. An important perspective to remember in this context is that it is possible to employ and su¢ ciently maintain the strongest available protective security mechanisms against the outsiders (unauthorised entities of the system) and still end up with a weak system due to the lack of proper protection against insiders (authorised entities) and lack of fail-secure and fail-safe mechanism to protect the system from committing suicide. There is also the perspective of insiders and outsiders working together to break the security mechanism of an information system. There are many reasons why information systems are not secure. One major reason is the complexity of today’s information systems and the need for continuous maintenance, which means that all systems need at least one system administrator with a username and password to perform every action possible on the information system. This raises the issue of a healthy delegation of responsibility with a clear de…nition of the roles involved. For such separation of concerns to work it must be properly maintained and revised regularly and employed in such a way that it does not introduce new vulnerabilities. This calls for the use of proper
38
5. Risk Assessment and Management of Information Systems
risk control. Risk management and risk assessment are techniques that can be used to identify, monitor and control the risk level of an information system. There are several principles about how risk assessment can be performed. These can be roughly classi…ed into three main types: rule based, risk based (probabilistic) and judgment based (expert judgment). Rule based risk assessment covers all approaches where an assessor or evaluator checks a system against a set of criteria or guidelines given by standards and/or checklists. These criteria or checklists thus represent rules that a system should comply with. Hence, these criteria or guidelines are considered “best practice”and by following these rules the system is su¢ ciently protected. This imply that the potential risks in a system are known and rarely change. Probabilistic risk assessment targets both known and unknown undesired events (risks) and focuses on identifying and assessing the probability of these events. However, it is important to distinguish between the frequentist (classical or “objective”) and the Bayesian interpretation of probability [105, 16, 31, 32]. In classical interpretations it is assumed that there exists a true value P which denotes the probability of the occurrence of a given event A. The true value P is unknown and needs to be estimated. The classical interpretations only allow the use of empirical data from actual use of the system or similar systems to estimate P . Hence, estimation cannot be done based on any subjective data (also called interpreted data) as this is considered to be uncertain data. The uncertainty in classic interpretation is related to how close the calculated value of P , called P 0, is to the true value of P . The perspective of uncertainty is understood di¤erently in subjective interpretation. Here the data sources express their subjective uncertainty regarding future observable events. The probability in this case expresses the expert’s or subject’s uncertainty for P and thus there is no meaning in talking about the uncertainty of the probability itself [31, 32]. The latter is called judgment based risk assessment or subjective expert judgment. Subjectivity is not a new subject in risk assessment and management. It has been discussed within the reliability domain since the 1970s [31, 32]. There have also been activities on the area of aggregating subjective expert judgment, such as guidelines and questionnaires for collecting relevant information from experts [17, 79]. It is this subjective interpretation of probability that this work makes use of in the trust-based information aggregation schema described in Part 5. Details on subjective expert judgment are given in Chapter 7.
5.1 Security (risk) assessment
39
5.1 Security (risk) assessment Risk assessment is often referred to as risk analysis. However, this work distinguish between the two terms and understands risk analysis as referring to the analysis of consequence and frequency of a potential threat or undesired event/behaviour. Risk assessment is seen as referring to the whole process of identifying, analysis, evaluating and treating risks. The reader should note however that risk assessment is di¤erent from risk management in that risk management refers to monitoring, communicating, consulting and controlling that the results of a risk assessment is employed and maintained in practice. Risk assessment is a one-time activity while risk management is a continuous activity and involves several risk assessments. When risk assessment is used to assess security critical systems or examine the security level of a system it is often referred to as security risk assessment or simply security assessment. Similarly, risk management is often called security management whenever used for managing results from security assessments. The purpose of any risk assessment is to identify potential threats or undesired events/behaviour and assess their degree of criticality to the system. Hence, security assessment provides relevant and necessary information to support decision makers in choosing a security solution, meaning a solution to the security threats posed upon an information system by reducing or removing the criticality that these represent. Decision makers can also use these results when prioritising di¤erent sets of solutions, also called countermeasures, into an e¤ective and cost-friendly overall security strategy. The intention of security (risk) assessment is not to obtain a completely secure system but rather to ensure the employment and maintenance of a correct or rather an acceptable level of security. Assessment activities also contribute to increased knowledge and insight into the system and the dependencies and interrelations between the system and its environment. This is an important issue in a security solution decision-making context but also motivates and increases the awareness of the importance of systematic security follow-ups. 5.1.1 Performing security assessment Performing security assessment is a multidisciplinary task. The process requires knowledge of the technical and operational perspectives of an information system and on the circumstances that may result in undesired system behaviour. Experts in the area of performing security assessment are also required, that is experts with knowledge of the assessment techniques and methods and the mathematical/statistical concepts needed for carrying out the tasks involved. Due to
40
5. Risk Assessment and Management of Information Systems
the increased complexity of information systems and the inherent problem with accidental complexity and poor user interfaces there is also a need for experts in the area of behaviour and organisational perspectives, that is experts that have knowledge of human reactions and work capacity under stress. Some kind of a model of the information system is often used to direct the assessment activities. A model in this context refers to a representation of the information system at some level of abstraction. Such a model can be either graphical or mathematical. However, establishing a mathematical description is necessary if the intention is to perform calculations of the input data at some point during the assessment. This does not mean that security assessments performed without extensive use of models or with inaccurate models is useless and provide no useful results. The result from a security assessment is not only dependent on the model but also on the composition of the assessment team and the information sources used to evaluate or estimate the involved variables. What should be noted though is that the results from a security assessment performed based on a particular model are no more accurate than the model itself. Additionally, when security assessment is used as an integrated part of the development, such as in the CORAS approach, the result is also a¤ected by the degree to which the actual implementation of the system relates to the models that the security assessment was performed on. If the system is not implemented as described by the models, the security assessment results might be of little or no relevance. There are many ways to perform a security assessment but most security assessment processes goes through the three phases: planning, execution and use. A general description of these three phases is given below, this is taken from Aven (1992) [5]: 1. Planning Objectives System de…nition Time planning 2. Execution System description De…nition of system failure Assumptions Causal Analysis Data collection and analysis Presentation of results
5.2 AS/NZS 4360:2004 Risk Management
41
3. Use Reliability evaluation Decisions The planning phase deals with the preparatory activities that are important for a successful result of a security assessment. This phase is used to de…ne what the assessment will include and what is out of scope, the goal with the security assessment and a plan for the use of the results from the assessment. Activities involved in this phase are: identify the objectives of the assessment, de…ne the scope of the assessment and creating plans for who does what at which time and a description of the expertise needed for each of the involved tasks. The execution phase deals with the actual execution of the security assessment. This means actively using the plans made during the planning phase to direct the tasks of the security assessment. At this point in a security assessment it is important to keep in mind the objectives and scope of the security assessment. The phase starts by creating a clear and unambiguous description of the system being analysed and by linking this description to the objectives and scope of the security assessment as de…ned in the planning phase. The next activity concerns the de…nition of types of system failures, which means providing a rough description of the expected normal and potential abnormal behaviour of the information system. Then the assumptions associated with the assessment need to be unambiguously described. This includes among other things to describe the possible interpretation of the security threat to make sure that all involved stakeholders understand and agree on the circumstances for interpreting the assessment results. The phase ends by carrying out the analysis tasks, collecting the results and formulating the results so that they can be presented to the target audience. The use phase deals with the application of the results from the execution phase and on how these results can be used to support and direct the decisions that need to be made. This involves qualitative or quantitative evaluation of potential security solutions to the identi…ed security risks, identifying a treatment plan, allocating resources, etc.
5.2 The Australian/New Zealand Standard for Risk Management The Australian/New Zealand Standard for Risk Management AS/NZS 4360:2004 [4] provides a generic framework for the process of managing risks. The standard divides the elements of the risk management process into seven sub-processes
42
5. Risk Assessment and Management of Information Systems
ESTABLISH THE CONTEXT
IDENTIFY RISK •What can happen? •When and where? •How and why?
MONITOR AND REVIEW
COMMUNICATE AND CONSULT
§The internal context §The external context §The risk management context §Develop criteria §Decide the structure
ANALYSE RISKS Identify existing controls Determine likelihood
Determine consequence
Determine level of risk
EVALUATE RISKS §Compare against criteria §Set risk priorities
Treat Risks
yes
no TREAT RISKS §Identify options §Assess options §Prepare and implement treatment plan §Analyse and evaluate residual risk
Fig. 5.1. AS/NZS 4360:2004 Risk management process
where …ve are sequential and related to risk assessment activities and two are in parallel with the other …ve and cover the risk management part of the process. An overview of the process is given in Figure 5.1. As for the general security assessment process outlined in the previous section the …rst sub-process of AS/NZS is used to de…ne the context for the assessment. This sub-process also deals with establishing the criteria for what constitute acceptable and unacceptable risk. This is called de…ning the risk acceptance criteria.
5.2 AS/NZS 4360:2004 Risk Management
43
During the second sub-process the potential threats, vulnerabilities and their associated impacts are identi…ed. The results from sub-process 2 are then analysed and evaluated in two subsequent sub-processes. The …fth and last sub-process in the risk assessment part of the process deals with identifying and evaluating potential treatments to the identi…ed risks. The two parallel sub-processes cover the risk management perspective of the process and focus on the communicating and consultation with the involved stakeholders, such as the decision maker and the monitoring and reviewing of the execution and results of each of the risk assessment sub-processes. The following gives a brief description of the activities involved in each sub-process. Establish the context The activities of the …rst sub-process of the risk assessment part of the AS/NZS 4360 risk management process focuses on the context that the organisation operates in. The sub-process is divided into …ve activities: Establish the external context focuses on de…ning the external environment in which the organisation operation. This includes among other thinfs a speci…cation of the organisation’s strengths and weaknesses, key business drivers and external stakeholders. Establish the internal context aims at understanding the organisation and its capabilities, including its culture, business goals, objectives, structure and strategies. Establish the risk management context involves describing the goals, objectives, strategies, scope and parameters involved in a directed and proper identi…cation, analysis, evaluation, treatment and management of the potential risks. Develop risk evaluation criteria involves establishing a clear de…nition of what constitute acceptable risk and what constitute unacceptable risk in terms of acceptance criteria. The important factor to note in this context is that acceptable risk will not be treated and hence the de…nition of the risk evaluation criteria should be executed with care. The criteria may be a¤ected by legal requirements, the perceptions of external and internal stakeholders or by organisational policies. De…ne the structure deals with dividing the assessment and management activities into sets of elements that allow a structured and logical way of assessing and managing the risks. Risk identi…cation The second sub-process of the risk assessment part of the AS/NZS 4360 risk management process identi…es the risks that need to be managed. Systematic methods for risk identi…cation, such as HazOp, FTA, FME(C)A, Markov analysis and CRAMM, should be applied at this stage. Proper execution of the identi…-
44
5. Risk Assessment and Management of Information Systems
cation of risks is a critical success factor to the success of the risk assessment and management as potential risks that are not identi…ed at this stage are excluded from further analysis. The process is divided into two activities: What can happen, where and when identi…es the potential threats, vulnerabilities and subsequent unwanted incidents arising from these. Why and how can it happen is directed towards identifying the possible causes initiating the identi…ed threats and describing scenarios to demonstrate how the threat can be materialised. Risk analysis Based on information from sub-processes 1 and 2 the impacts and likelihood of all identi…ed threats are assessed. The objective of sub-process 3 of the risk assessment part of the AS/NZS 4360 risk management process is thus to derive the risk level of each risk identi…ed during risk identi…cation. This is necessary in order to separate the acceptable risks from the risks requiring treatment. Risk is analysed by combining estimates of the consequence and the likelihood of the identi…ed threats in the context of existing control measures. The analysis can be either qualitative or quantitative depending on the amount and type of data available. Qualitative analysis uses descriptive scales to describe the magnitude of potential consequences and the likelihood that those consequences will occur while quantitative analysis uses numerical values for both measures. The subprocess is divided into the following activities: Evaluate existing controls looks into which security mechanisms that are already in place in the system and the relevant system environment. This involves identifying the existing management strategies both in terms of technical solutions and procedures. Determine consequence and likelihood is the activity where the qualitative or quantitative analysis of consequence and likelihood of the identi…ed threats is performed. Estimate level of risk takes the likelihood and consequence from previous activity and estimates the risk level. The risk level can be expressed both qualitatively and quantitatively depending on the output from the previous activity. This means that if the consequence and likelihood from the prevision activity is expressed as qualitative values the risk level is expressed as a qualitative value and visa versa. Risk evaluation In sub-process 4 of the risk assessment part of the AS/NZS 4360 risk management process the risks are evaluated by comparing the risk level with the risk evaluation criteria established in the …rst sub-process. Based on the results of the evaluation it is decided whether a risk is perceived as acceptable or not. The
5.2 AS/NZS 4360:2004 Risk Management
45
risks identi…ed to be in need of treatment are then assigned a treatment priority. From this stage on the risks considered to be acceptable are no longer parts of the assessment. Nevertheless, these risks should be monitored to ensure that they remain acceptable. Risk treatment The last sub-process in the risk assessment part of the AS/NZS 4360 risk management process concerns the treatment of the risks. In this sub-process the focus is on …nding alternative treatment solutions to the risks in need of treatment, meaning the risks identi…ed as not acceptable in the previous sub-process. There are generally four main treatment strategies [4]: (1) Avoid the risk. (2) Transfer the parts of or the complete risk to a third party. (3) Reduce the likelihood of the risk. (4) Reduce the consequence of the risk. Determining which treatment strategy to choose and the …nancial and security impact of this strategy is derived through a series of treatment activities. Treatment activities speci…ed in ANS/NZS 4360 are the following: Identify treatment options include the identi…cation of the treatment strategy and the identi…cation of alternative treatment options within the boundaries of the treatment strategy. Note that treatment options are identi…ed and evaluated both for risks with negative impact and for risks with positive impact Assess treatment options evaluates and compares the bene…ts of implementing a particular treatment option from the set of alternative treatment opinions identi…ed in the previous activity with the cost of employing the treatment option in the system. This activity also recommends a treatment option or usually a set of treatment options by taking both the …nancial and the risk acceptance criteria into consideration. The general rule given is to choose treatment option(s) so that the risk is made as low as reasonably practicable (ALARP). Prepare and implement treatment plans looks at the results from the previous activity and develops a plan for how to prepare and implement the treatment option in the system and/or the system environment. This activity includes resource allocation, distribution of reponsibilities, performance measures and reporting and monitoring requirements. Monitoring and Review The monitoring and review sub-process is one of the two risk management subprocesses speci…ed in AS/NZS 4360. In this sub-process stakeholders involved in managing the risks monitor and review the execution of the treatment implementation plan. The sub-process runs in parallel with the …ve risk assessment sub-processes and monitors and reviews the results from all risk assessment activities as well as ensuring that continuous attention is given to the system and that
46
5. Risk Assessment and Management of Information Systems
there is protection of the system against potential risks. Risk management works best if strategies for managing risks and for monitoring the practical implications of the risk management strategy are clearly described. For a treatment implementation plan to remain relevant the plans need to be reviewed and updated regularly. Communication and Consultation Communication and consultation is the second risk management speci…c subprocess included in the AS/NZS 4360 risk management process. As discussed earlier the success of any risk assessment or management plan and activity is highly dependent on the ability of the involved stakeholders, experts, users and other interested parties ability to communicate. This is also crucial in risk management. If the managers and the people developing the system and employing the treatment options do not communicate and consult to a su¢ cient level throughout the life-cycle of a system the ability of the management strategy to succeed in its mission is dramatically reduced. Being in interaction, being in control, having a proper overview of the implications of all actions, etc. is not just important in risk management, it is a necessity. The communication perspective is also important in relation to the potential consumers in order to establish and maintain mutual respect and con…dence. Also, a continuous improvement of the risk management plans and strategies require proper communication and consultation to ensure that the risk management plan remains relevant for those involved and not only for the managers.
5.3 CCTA risk analysis and management methodology (CRAMM) CCTA Risk Analysis and Management Methodology (CRAMM) [8] is developed by the British Government’s Central Computer and Telecommunications Agency (CCTA) as a recommended standard for risk analysis of information systems within healthcare establishments in the UK. This approach incorporates perspectives taken in …nance risk management approaches and are tailored for assessing risks to medical and health related IT system. However, due to the structured and general process adapted the approach also represents a general, structured and consistent approach to computer security management of all types of information systems. CRAMM is also used as the basis for many risk assessment and management methodologies and frameworks, such as the CORAS framework, and is the …rst risk assessment methodology that successfully and in large-scale adapted an asset-centric perspective on risk assessment.
5.4 The CORAS approach
47
The …rst version of CRAMM was issued as a set of paper-based forms. Later CRAMM was supported by software tools and now it is fully computerised. CRAMM consists of three stages: (1) Asset identi…cation and valuation. (2) Assessment of threats, which is similar to the identi…cation and analysis of risks activities in the AS/NZS 4360 risk management process. (3) Assess vulnerabilities and suggests countermeasures. CRAMM has 10 prede…ned asset tables to support the identi…cation and valuation of assets. Furthermore, the asset tables are structured into asset categories that are linked to lists of known vulnerabilities and threats for each asset category. The CRAMM software tool lists these to you automatically based on the result of the asset identi…cation and valuation in stage 1 of CRAMM. Furthermore, there are also sets of associated countermeasures to each of the threats and vulnerabilities stored in respective repositories in CRAMM. The CRAMM software tool also suggests countermeasures automatically based on information such as the set of assets identi…ed, the values assigned to these assets and the identi…ed threats and vulnerabilities. However, there is a prede…ned balance between physical, personnel, procedural and technical countermeasures that is tailored for medical systems within the CRAMM software tool. This makes the latter feature less valuable to other types of information systems. To make CRAMM e¤ective for other types of information systems all decisions made must be recorded and reviewed and the associated repositories updated to re‡ect the e¤ects of these decisions. Hence, the software tool needs to learn from experience. The CORAS approach makes use of the asset-driven approach of CRAMM and has adopted the asset valuation technique of CRAMM. More details on the CORAS approach is given in the following.
5.4 The CORAS approach to assessing and managing security risks IST-2000-25031 CORAS: A platform for risk analysis of security critical systems [19] was a Fifth Framework European Commission IST-project that ran from 2000-2003. The aim of the CORAS project was to develop a framework for model-based risk assessment of security critical systems. The main result from the CORAS project is the methodology for model-based risk assessment that has four supporting pillars: (1) The risk documentation framework based on RM-ODP. (2) The risk management process based on the AS/NZS4360 risk management process. (3) The integrated risk management and system development process based on the Uni…ed Process (UP). (4) The platform for tool inclusion
48
5. Risk Assessment and Management of Information Systems RM-ODP
System documentation framework
RUP AS/NZS 4360
Risk management process
Model-based risk management
System development and maintenance process
Platform for toolinclusion based on data integration XML
Fig. 5.2. The …ve main components of the CORAS framework
based on data-integration using XML. However, the main bene…ts of the CORAS approach is the tailoring of a set of risk assessment methods from the safety domain for the security domain, as well as the focus on integrating risk management into the system development process. The latter ensures that risks are handled throughout the development process at the right time and for the correct cost. Figure 5.2 gives an overview of the CORAS framework [97]. The CORAS framework is model-based in the sense that it gives detailed recommendations for modelling both the system and the risks and treatments identi…ed during the security (risk) assessment using the Uni…ed Modeling Language (UML). This means that the CORAS framework provides support, guidelines and UML modelling elements which extend the value of both system development and risk assessment activities in three dimensions [97]: (1) To improve precision of descriptions of the target system. (2) As a media for communication between stakeholders involved in a risk assessment. (3) To document risk assessment results and the assumptions on which these results depend. Details are in Stølen et al. (2002) [97]. Also, the risk assessment methodology in CORAS integrates techniques from partly complementary risk assessment methods. These include HazOp, FTA,
5.4 The CORAS approach
49
FMECA, Markov analysis and CRAMM. Like CRAMM the CORAS methodology is asset-driven, which means that the identi…cation of assets is the driving task in the risk assessment process. Actually, if no assets are identi…ed there is no need to carry out the risk assessment. 5.4.1 CORAS risk management process The CORAS risk management process is based on the AS/NZS 4360:1999 risk management process and the recommendations in ISO/IEC 17799-1:1999 [55]. The underlying terminology of the CORAS risk management process is supported by the two standards: ISO/IEC TR 13335-1 [54] and IEC 61508:1998 Functional safety of electical/electronic/progammable electronic safety-related systems [51]. As for AS/NZS 4360 the CORAS risk management process consists of seven sub-processes where …ve are sequential risk assessment related sub-processes and two are parallel risk management related sub-processes. In order to adapt the standard for use in the security domain CORAS decomposed the …ve sequential sub-processes into activities as shown in the activity list below. For each sub-process the CORAS methodology provides guidelines with respect to which models should be constructed and how these models should be expressed to support the risk assessment activities. The main di¤erence from the AS/NZS 4360 risk management process is that the CORAS risk management process has a stronger focus on assets and that their process is asset-driven. The risk management process is therefore extended by relevant activities for asset identi…cation and valuation. As for CRAMM the identi…cation and valuation of assets guides the risk assessment process. More details are in Stølen et al. (2002) [97] and the other publications from the project. Please see [19] for details.
50
5. Risk Assessment and Management of Information Systems
Sub-process 1: Identify Context Activity 1.1: Identify areas of relevance Activity 1.2: Identify and value assets Activity 1.3: Identify policies and evaluation criteria Activity 1.4: Approval Sub-process 2: Identify Risks Activity 2.1: Identify threats to assets Activity 2.2: Identify vulnerabilities of assets Activity 2.3: Document unwanted incidents Sub-process 3: Analyse Risks Activity 3.1: Consequence evaluation Activity 3.2: Frequency evaluation Sub-process 4: Risk Evaluation Activity 4.1: Determine level of risk Activity 4.2: Prioritise risks Activity 4.3: Categorise risks Activity 4.4: Determine interrelationships among risk themes Activity 4.5: Prioritise the resulting risk themes and risks Sub-process 5: Risk Treatment Activity 5.1: Identify treatment options Activity 5.2: Assess alternative treatment approaches
6. Towards Quantitative Measure of Operational Security
The fact that most security evaluation and assurance approaches are qualitative, subjective and resource demanding and the need for easily accessible techniques that provide comparability between security solutions has raised the need for techniques with the ability to quantify security attributes of information systems. This relates both to security requirements in Quality of Service (QoS) architectures and as input to design and architecture trade-o¤ analysis to support the choice of security solutions such as security mechanisms to comply with an established security policy. Early research in this area focused on state transition models such as Markov or semi-Markov models. In the dependability domain these techniques are used to measure values such as mean time between failures (MTBF) and to quantify frequency and consequence of undesired events. However, the dynamic nature of security attacks makes these models intractable due to the problems with state explosions. To express the complete state space involved in a security solution decision situation for an information system it is necessary to consider not only hardware, operating system and application/services fault but also the survivability of the system in terms of withstanding intentional and accidental security attacks. In Littlewood et al. (1993) [74] the …rst step towards operational measures of computer security is discussed. The authors point to the lack of quantitative measures available to determine the security level of a system under operation, called operational security, and suggest a model that relates security assessment to traditional probability theory. Note that operational security relates to the ToE working in the operational environment in a Common Criteria context. The main idea is to reuse the knowledge and methods from the reliability domain and tailor these for the security domain. This requires re…ning the concepts involved, as well as a rede…nition of the input space and usage environment. The main di¤erence between the security and the reliability domain is that the input space not only covers system internal inputs but also external inputs, such as those coming from intentional attacks to security critical information systems. The
52
6. Towards Quantitative Measure of Operational Security
same applies to the usage environment where the population of attackers and their behaviour comes in addition to normal system operation. The operational measures of security discussed in the paper are the e¤orts and time that the attacker need to invest to perform a security attack in terms of Mean E¤ort to Security Failure and Mean Time to Security Failure . In Ortalo et al. (1999) [80] the authors discuss a quantitative model to measure known Unix security vulnerabilities using a privilege graph. The privilege graph is transformed into a Markov chain based on the assumption that the probability of a successful attack given an elementary attack and the associated amount of efe fort e spent is exponentially distributed. The e¤ort e is expressed as P (e) = 1 where 1= is the mean e¤ort to successful elementary security attack. Furthermore, the model allows for the evaluation of operational security as proposed in [74]. In Jonsson and Olovsson (1997) [62] the authors present and discuss a quantitative analysis of attacker behaviour based on empirical data collected from intrusion experiments using undergraduate students at Chalmers University in Sweden. The results of the experiment indicated that typical attacker behaviour is comprised of three phases: the learning phase, the standard attack phase and the innovative attack phase. The authors also found that the probability for successful attacks is small during the learning and innovative phases while the probability is considerably higher during the standard attack phase. For the standard attack phase the probability for successful attacks was found to be exponentially distributed. In Madan et al. (2000) [75] the authors demonstrate an approach for quantifying security attributes of software systems using stochastic modelling and Markov theory. In this paper the authors consider security to be a QoS attribute and interpret security as preserving the con…dentiality and integrity of data and the avoidance of denial of service attacks. The authors model the combination of attacker behaviour and the response from the system to the attack as a random process using stochastic modelling techniques. The stochastic model is used to analyse and quantify the security attributes of the system, such as the Mean E¤ort to Security Failure and Mean Time to Security Failure as …rst introduced in [74]. The authors argue that qualitative evaluation of security is no longer acceptable and that it is necessary to quantify security in order to meet contracted levels of security. Furthermore, the authors compare intrusion tolerance with fault tolerance and pinpoints that it can be assumed that once a system has been subjected to a security attack an intrusion tolerant system responds to this security threat in a manner similar to the actions initiated by a fault tolerant system. Such situations can be modelled using the stochastic modelling techniques
6. Towards Quantitative Measure of Operational Security
53
Markov chains and semi-Markov processes. However, the authors did not look into the problem of state explosion and how to handle this issue in practice. In Wang et al. (2003) [104] the state transition approach described in [75] is extended. The paper points to the weakness of Markov models by discussing the di¢ culty of capturing details of real architectures in a manually constructed Markov model. The authors advocate the use of higher level formalism and make use of Stochastic Petri Nets (SPN) to model the behaviour of an intrusion tolerant system for quantifying security attributes. The SPN model is then parameterised and transferred into a continuous-time Markov chain. This model contains the behaviour of two main entities: the attacker behaviour and the response from the system to an attack. As in [75] security is considered a QoS attribute. The model also handles simultaneously co-existence of several vulnerabilities in a system. The example system used to demonstrate the approach both in [104] and [75] is the SITAR intrusion tolerance system. In Singh et al. (2003) [92] the authors describe an approach for probabilistic validation of an intrusion-tolerant system. Here, the authors use a hierarchical stochastic activity net (SAN) model to validate intrusion tolerant systems and to evaluate the merits of several security design choices. The proposed model is composed of sub-models of management algorithms, replicas and hosts where the hosts are structured into application domains of di¤erent sizes. The management sub-model controls the initiation of new replicas and the removal of host and even whole domains. Issues discussed in the paper are the number of hosts that can be handled by a domain and how to manage a corrupted host. The intrusiontolerant system includes an intrusion detection system (IDS) to detect corrupted hosts. However, as for IDS intrusion-tolerant systems are subject to the problem of false positives. The above described work represents state of the art in quantifying operational security. The AORDD security solution trade-o¤ analysis bene…ts from these pieces of work and have incorporated the notion of operational security level both in the structure and in the set of variables in the trade-o¤ analysis and associated trade-o¤ tool. Details are in Part 4.
7. Subjective Expert Judgment
Uncertainty is what is removed by becoming certain and certainty is achieved through a series of consistent observations. In subjective interpretation of probability uncertainty expresses the degree of belief of a particular subject. For example, expert i believes that the number of DoS attacks per month for a .NET e-commerce system is between 2 and 20 and the most likely around 10. To further specify the uncertainty con…dence intervals and …ner granulated uncertainty functions can be used. However, this is only allowed in the Bayesian interpretation of probability and not in the truly subjective interpretation, which is used in this work. Probability becomes purely subjective when a true value does not exist (it has not yet or cannot be observed directly). In such cases the focus is put on observable values that are unknown at the time of the assessment but that can be observed some time in the future. The future observable values are expressed as the subjective estimate of what the expert thinks will be the outcome. This does not refer to the actual value and is rather an expression of how uncertain the expert is about what will be the actually outcome. Note that the expert provides his or her opinion based on his or hers set of relevant experience, knowledge and recommendations provided by one or more external sources that the expert trusts. How to measure trust and how to aggregate these three categories of information in the context of this work is discussed in Part 5 and demonstrated in Part 6 of this thesis. An expert’s uncertainty is described by a subjective probability distribution for uncertain quantities with values in a continuous range. The Triangular distribution is the most commonly used distribution for modelling expert opinions [102]. This is de…ned by its minimum value (a), most likely value (b) and maximum value (c). Ideally, any probability distribution should be available to the experts when expressing their belief. However, experience has shown that simple probability distributions are more tractable and even more importantly understandable for the experts. The latter is important as it has been observed that poor perfor-
56
7. Subjective Expert Judgment
1. System OK
2. System Degraded
3. System NOT OK
Fig. 7.1. Example case description using a state transition diagram
mances by experts are often not due to lack of expertise but rather to the lack of training in subjective probability assessment [38, 17]. When expert judgments are cast in the shape of distributions of uncertain quantities the issue of conditional dependence is important. Quanti…ed uncertainty in an uncertainty analysis is always conditional upon something and it is essential to make clear the conditional background information. This is the role of the case structure, which describes the areas of interest or problem that the experts are to assess. The case structure both describes the problem in question and is used to derive the questionnaire for the elicitation variables in subjective expert judgments. These variables are essential in the expert opinion aggregation and discussed, along with the questionnaire, further in Section 7.1. Gossens et al. (2000) [38], Cooke and Gossens (2000) [17] and Øien and Hokstad (1998) [79] describe the procedure guides for structured expert judgment elicitation. The main structure of such procedures is usually a variant of the following three steps: (1) Preparation for elicitation, which includes identifying and selecting experts and describe the area of interest. (2) Elicitation, which is the actual collection of expert judgments. (3) Post-elicitation, which includes among other things the aggregation and analysis of expert opinions. In the following a brief example of the techniques for the three steps is given. Further details and speci…c expert elicitation techniques can be found in the above references. Figure 7.1 shows an example case description. Here, the problem to that the experts shall assess (area of interest) is modelled in terms of three states expressed in a state transition diagram. The three states are: (1) System OK, (2) System degraded and (3) System NOT OK. State 1 denotes all situations where the system is operating according to speci…cations. State 2; system degraded, includes all situations where the system is under attack and is usually modelled more …nely granulated. State 3 models the situation of a successful attack, meaning that the system has been compromised. Example of information of interest for this case description is the probability of a system to be in the degraded and NOT OK state; states 2 and 3 respectively. The Triang(a,b,c) distribution is used to elicit expert judgments and the questionnaire derived from the case description are:
7. Subjective Expert Judgment
57
Probability of being in state 1 a. What is the minimum probability that the system is in state 1? b. What is the most likely probability that the system is in state 1? c. What is the maximum probability that the system is in state 1? Probability of being in state 2 a. What is the minimum probability that the system is in state 2? b. What is the most likely probability that the system is in state 2? c. What is the maximum probability that the system is in state 2? Probability of being in state 3 a. What is the minimum probability that the system is in state 3? b. What is the most likely probability that the system is in state 3? c. What is the maximum probability that the system is in state 3? Expert elicitation targeting estimation of the cost associated with the di¤erent states would give the following questionnaire: Cost related to state 1 a. What is the minimum cost of being in state 1? b. What is the most likely cost of being in state 1? c. What is the maximum cost of being in state 1? Cost related to state 2 a. What is the minimum cost of being in state 2? b. What is the most likely cost of being in state 2? c. What is the maximum cost of being in state 2? Cost related to state 3 a. What is the minimum cost of being in state 3? b. What is the most likely cost of being in state 3? c. What is the maximum cost of being in state 3?
58
7. Subjective Expert Judgment
Table 7.1. Answer table for Question 1 in the questionnaire for Expert i Question 1 Expert i Triang(a,b,c)
x
f (x)
Min (a) Most likely (b) Max (c)
Both the questionnaire for probability and cost elicitation can be tailored to a particular undesired event called misuse in this work or security mechanism or control called security solution in this work. This makes it possible to aid the choice of security solution for a particular con…guration of the information system, called ToE in the Common Criteria, and provides information that can be used to support the choice of security solution. The latter is the objective of this work and have been materialised in the AORDD security solution trade-o¤ analysis and trade-o¤ tool described in Part 4. Details of decision-support for the choice of security solution is given in Parts 3 and 4 of this work, Houmb et al. (2005) [44] enclosed as Appendix B.3 and Houmb et al. (2006) [48] enclosed as Appendix B.2. The Triang distribution is given as Triang(a,b,c) where a=minimum, b=most a) likely and c=maximum, with the probability density function f (x) = (b 2(x a)(c a) in the interval [a; c]. Table 7.1 shows an example answer table for Question number 1 in the above questionnaire for Expert number i. In expert elicitation such a table is …lled out for each combination of question and expert and the probability density function (pdf) is calculated to derive the shape of the distribution. Figure 7.2 shows an example Triang(a,b,c) distribution for Question 1 in the questionnaire for three experts. As can be seen in this …gure the result from the expert elicitation is widely distributed and there seems to be little consensus between the experts. Some common reasons for such situations is that the area of interest are new and little explored, that one or more of the experts do not have a su¢ cient amount of relevant knowledge and experience in the area or that one or more of the experts did not understand the statistical implications of their answers. The last can be treated by adding feedback meetings to the expert elicitation process. In these meetings the risk analyst interprets the contextual meaning of the answers from all the experts and gives each expert feedback on the contextual implications of his or her opinions. The risk analyst also often presents an overview of the answers given by all involved experts. Then, based on the feedback given and the overview of information provided by the other
7. Subjective Expert Judgment
59
Fig. 7.2. Example of Triang(a,b,c) distribution for three experts
involved experts each expert is given the ability to adjust their answers such that it better re‡ects their actual belief. The example in Figure 7.2 shows that it is of vital importance to calibrate the experts in expert elicitation. This is done using empirical control, such as that incorporated in rational consensus described by Cooke and Goossens (2000) [17]. When performing empirical control it is important to re‡ect on the concept of when a problem is actually an expert judgment problem. Expert judgments should not be used for problems that are physically measurable or for problems that have no answers, such as meta-physical problems. A problem is suited for expert judgment if there is relevant scienti…c expertise. This entails the existence of theories and measurements relevant to the area of interest but where the quantities themselves cannot be measured in practice. For an expert judgment problem there will usually be relevant experiments that in principle can be used to enable empirical control. However, such experiments will most often not be performed because of lack of resources or strict time constraints. This does not mean that information cannot be elicited, just that it is too costly and time demanding to perform the experiments. In such cases empirical control is achieved based on prior relevant experience where the analyst reasons about the soundness of the results from the expert elicitation by comparing the experts with each other taking their knowledge and experience into mind and by comparing the results with whatever observable information that is available. Empirical control can also be obtained by looking into the degree of consensus of the information elicited from the sets of experts involved. If the consensus is low a new expert elicitation should be performed. Additionally, empirical control can be executed using robustness and discrepancy analysis on the expert elicitation results as described in Goossens, Cooke and Kraan (1998) [37].
60
7. Subjective Expert Judgment
There are three additional factors that must be taken care of during elicitation of expert judgment and these are scrutability, neutrality and fairness. Scrutability or accountability is of great importance and means that all data including details of the experts and the tools used must be open to peer review and that the results must be reproducible by competent reviewers. Neutrality is also important. This means that all elicitation and evaluation methods must be constructed such that they encourage experts to state their true opinions. Underestimation and overestimation should be taken into account in relation to neutrality. Underestimation means that the expert has little con…dence in his or her experience and knowledge and consequently gives pessimistic information. Overestimation is the opposite and means that the expert has great con…dence in his or her expertise and knowledge and consequently provides optimistic information. Additionally, there is the issue of disregarding known and important information when assessing the problem area as discussed in Kirkebøen (1999) [71]. Fairness means that experts should not be prejudged prior to processing the results of their assessment.
7.1 Aggregation techniques for combining expert opinions After the elicitation of expert judgment the results are examined in order to decide on a suitable expert judgment aggregation technique. This is step 3 in the structured expert judgment elicitation described above. This decision can be aided by the use of robustness and discrepancy analysis as shown in Figure 7.3. Robustness and discrepancy analysis is performed to assess the robustness of the combined result from the expert judgment, to examine the consensus among the experts and to examine whether some of the expert opinions are of greater importance than others Robustness and discrepancy analysis can be done on both the expert judgment and on the calibration variables. Such an analysis is performed by removing expert judgments or calibration variables from the data set one at the time and then recalculate the result to account for the relative information loss that the information removal has on the original result. Calibration variables in subjective expert judgments are the variables that are used to derive the appropriate expert opinion weighting scheme. These variables serve a threefold purpose in expert elicitation (modi…ed from Goossens, Cooke and Kraan (1998) [37]): (1) To quantify experts’performance as subjective assessors. (2) To enable performanceoptimised combinations of expert distributions. (3) To evaluate and validate the aggregation of expert judgments.
7.1 Aggregation techniques for combining expert opinions
61
Fig. 7.3. Robustness analysis used to derive the weighting schema
Generally, there are two main types of expert aggregation techniques: (1) Equal weighted combination and (2) Performance-based weighted combination. The latter includes a wide variety of weighting schemas but the easiest way to aggregate expert judgments is the equal weighted combination. However, experience has shown that performance-based weighting schemas generally outperform the equal weighting schema [17]. The main reason for this is that experts as a group often show poor performance due to group dynamic problems [17]. Another observation made during expert elicitation by Cooke and Gossens (2000) [17] is that a structured combination of expert judgment may show satisfactory performance even though the experts individually perform poorly. The main reason for this is because performance-based weighting schema will assign low weights to these experts to counter for their poor performance. The trust-based information aggregation schema described in Part 5 of this work is a performance weighting schema for aggregating disparate information as input to the AORDD security solution trade-o¤ analysis and trade-o¤ tool described in Part 4.
8. Bayesian Belief Networks (BBN)
Bayesian Belief Networks (BBN) has proven to be a powerful technique for reasoning under uncertainty and have successfully been applied when assessing the safety of systems as discussed in [21], [23], [29], [91] and [30]. The …rst major contribution to this paradigm of uncertainty modelling was by Pearl (1988) [83] and Lauritzen and Spiegelhalter (1988) [73]. Today, BBN is used to aid decision makers in domains such as medicine, software, mechanical industry, economy and military. In the medical domain BBN is used for supporting decisions in the diagnosis of muscle and nerve diseases, in antibiotic treatment systems and in diabetes advisory systems. In the software domain BBN is used to aid in software debugging, printer troubleshooting, safety and risk evaluation of complex systems and for the help facilities in Microsoft O¢ ce products. In the mechanical industry BBN is used to aid diagnosis and repair of on-board unmanned underwater vehicles, in systems for control of centrifugal pumps and in systems for process control in wastewater puri…cation. In the …nancial domain BBN is used to aid credit application evaluation and portfolio risk and return analysis and in the military domain BBN is used in the NATO Airborne Early Warning system. A Bayesian Belief Network (BBN), also called Bayesian Network (BN) or belief network, is tailored to model situations involving uncertainty. Several circumstances can give rise to this uncertainty. When choosing between alternative security solutions, which is the objective of this work, uncertainty involves a wide variety of factors, such as incomplete understanding of a security problem or the behaviour of a software system and its security (system) environment, incomplete knowledge of the e¤ect of a security incident or the inherent vulnerabilities of the system, inconsistent information on the behaviour of the system or the e¤ect that some security solution (security mechanism, process, procedure etc.) has on the system behaviour or any combination of the above. In the AORDD security solution trade-o¤ analysis described in Part 4 and in the trust-based information aggregation schema described in Part 5 there are several types of information sources with variable levels of trustworthiness in-
64
8. Bayesian Belief Networks (BBN)
volved. These information sources are critical in the AORDD framework, which is the security solution decision support approach developed in this work. In the AORDD framework each information source provides qualitative and/or quantitative information on the uncertain circumstances of future potential misuses and the e¤ect that alternative security solutions may have on these misuses. Without such information it is di¢ cult to identify the best-…tted security solution among alternatives. However, combining disparate information and aggregating uncertainty is a rather challenging task as there are multi-dimensional dependencies involved. The latter makes BBN an excellent implementation language for the AORDD security solution trade-o¤ analysis and the trust-based information aggregation schema described in Parts 4 and 5 of this work. The problematic part of modelling uncertainty is that the outcome of an event is dependent on many factors and on the outcome of other events. Hence, there are complex dependency relationships that need to be accounted for. This is handled by the underlying computation model of BBN, which is based on Bayes rule and …rst introduced as a methodology for modelling problems involving uncertainty in the late 1980s. Bayes rule calculates conditional probabilities and given the two variables X and Y the probability P for the variable X given the variable Y can be calculated from: P (XjY ) = P (Y jX) P (X)=P (Y ). By allowing Xi to be a complete set of mutually exclusive instances Bayes formula can be extended to calculate the conditional probability of Xi given Y . The latter form the basic for computation engines in BBN tools, such as the HUGIN tool [50] used to implement the AORDD security solution trade-o¤ analysis and the trust-based information aggregation schema described in Parts 4 and 5 of this work. Details on Bayes rule is available at the Serene website [91] and in Vose (2000) [102] or similar textbooks on probability theory. When modelling a problem or the variables involved in a case description, as described in Chapter 7, BBN is represented as a directed acyclic graph (DAG) together with an associated set of probability tables. A DAG consists of nodes representing the variables involved and arcs representing the dependencies between these variables. Nodes are de…ned as stochastic or decision variables and multiple variables are often used to determine the state of a node. Each state of each node is expressed using probability density functions (pdf). Probability density expresses the con…dence in the various outcomes of the set of variables connected to a node and depends conditionally on the status of the parent nodes at the incoming edges. This …ts well with what is needed to model expert opinions as described in Chapter 7. There are three types of nodes in a DAG: (1) Target node(s), (2) Intermediate nodes and (3) Observable nodes. Target nodes are nodes about which the objective of the network is to make an assessment (the question that needs an answer).
8. Bayesian Belief Networks (BBN)
65
Firewall down
ftp fork attack
Virus attack
Fig. 8.1. Example BBN for ‘…rewall down’
An example of such a node is the node ‘Firewall down’ as shown in the example BBN in Figure 8.1. Intermediate nodes represent variables that connect the observable nodes with the target nodes. These nodes usually represent events or similar factors which there exist limited information or beliefs on. The associated variables are hidden variables. Typically hidden variables represent issues or perspectives that increase or decrease the belief in the target node. Observable nodes are nodes that represent events where evidence or information on these events can be directly observed or obtained in other ways. In the example BBN there are no intermediate nodes and two observable nodes, namely ‘ftp fork attack’and ‘Virus attack’. The directed arcs between the nodes denote the causal relationship between the underlying variables. Evidence or information is thus entered at the observable nodes and propagated through the network using these causal relationships and a propagation algorithm based on the underlying computational model of BBN. As described above the nodes represent stochastic or decision variables. Furthermore, a variable can be either discrete or continuous. For example, the target node of the example BBN in Figure 8.1 is ‘Firewall down’. This node is a discrete variable with the two associated values ‘true’and ‘false’. The arcs in the example BBN represent causal relationships between the observable nodes and the target node. Suppose that the associated variable with the observable node ‘ftp fork attack’also is discrete with values ‘true’and ‘false’. Since the …rewall being down can cause an ‘ftp fork attack’the relationship between the two variables is modelled as a directed arc from the node ‘Firewall down’to the node ‘ftp fork attack’ where the direction of the arc represents the causal direction of the relationship. In the example BBN in Figure 8.1 this means that the ‘…rewall is down’ does not imply that an ‘ftp fork attack’ will de…nitely happen but that there is an increased probability that this attack will occur. In a BBN this causal relation is
66
8. Bayesian Belief Networks (BBN)
Table 8.1. Node probability table for ‘ftp fork attack’ Firewall down
True
False
True
0.8
0.1
False
0.2
0.9
ftp fork attack
model in the probability table for each node. For the node ‘ftp fork attack’the probability table (also called the Node Probability Table or NPT) might look like that of Table 8.1. The example NPT represents the conditional probability of the variable ‘ftp fork attack’ given the variable ‘Firewall down’; P (‘ftp fork attack’j‘Firewall down’). The possible values (true or false) for ‘ftp fork attack’ are shown in the …rst column. Note that there is a probability for each combination of events (four in this case) although the rules of probability mean that some of this information is redundant. There might be several ways of determining the probabilities in an NPT such as that in the NPT above where the probabilities are based on previously observed frequencies of times when the ‘Firewall is down’. Alternatively, if no such statistical data are available subjective probabilities estimated by experts can be used. The strength of BBN is that they can accommodate subjective probabilities and probabilities based on empirical data. As limited empirical information is available for choosing among alternative security solutions this is a most desirable feature in this work. The BBN method is applied whenever using BBN as a decision making tool. The application of the BBN method consists of three main tasks: Construction of the BBN topology Elicitation of probabilities to nodes and edges Making computations Construction of the BBN topology where a BBN topology is a hierarchy of DAGs linked together, is done by examining the variables involved and their relationships and by modelling these explicitly as nodes and arches in a hierarchy of DAGs. Elicitation of probabilities to nodes and edges involves the collection and aggregation of evidence/information, such as elicitation of expert opinions as described in Chapter 7. The probabilistic relationship between the nodes in a DAG is described using node probability tables (NPT) where variables can be independent or dependent. Examples of independent variables are observable nodes that are d-separated from all other nodes in the topology. Details on d-separation is
8. Bayesian Belief Networks (BBN)
67
found in Jensen (1996) [59]. Collecting evidence for the observable nodes in a BBN topology may not be straightforward. This problem was discussed in Chapter 7 and will be discussed further in Parts 4 and 5 of this work. Making computation means propagating information and evidence entered into the observable nodes of the BBN topology. These pieces of information is propagated to the target node of the topology through the intermediate nodes. Propagation is done by updating the conditional probabilities on the edges of the topology taking the new evidence into consideration. There exist e¤ective algorithms used for evidence propagation, such as Bayesian evidence propagation and the HUGIN propagation algorithm. Details are in Jensen (1996) [59]. For more information on BBN and in particular the highly relevant work on application of BBN for software safety assessment the reader is referred to Gran (2002) [40] and the SERENE project (http://www.hugin.dk/serene/) [91].
9. Architecture/Design trade-o¤ analysis
The two most commonly used software architectural trade-o¤ analysis methods are the Architecture Trade-o¤ Analysis Method (ATAM) [70] and the Cost Bene…t Analysis Method (CBAM) [69]. Both ATAM and CBAM were developed by the Software Engineering Institute (SEI) at Carnegie Mellon. There are also several other methods available that build on parts of these two methods. However, in this work the focus is put on ATAM and CBAM as representatives of relevant trade-o¤ analysis for the AORDD security solution trade-o¤ analysis.
9.1 Architecture Trade-o¤ Analysis Method (ATAM) ATAM focuses on providing insight into how quality goals interact with and trade-o¤ against each other. ATAM consists of a set of steps that aids in the eliciting of quality requirements along multiple dimensions, in analysing the e¤ects of each requirement in isolation and in understanding the interactions of these requirements. The result of an ATAM is a set of potential architectural decisions and a description of how these decisions are linked to business goals and desired quality attributes of the future or existing system. There are four phases in ATAM: (1) Presentation, (2) Investigation and Analysis, (3) Testing and (4) Reporting. In the presentation phase the context and goals of the particular trade-o¤ context is presented and an introduction to ATAM as a method is given. In the investigation and analysis phase the current situation is examined and potential architectural approaches are identi…ed and evaluated by looking at their associated quality attributes. In the testing phase the architectural approaches are analysed in more detail and the associated scenarios are identi…ed and prioritised. In the reporting phase the result from the three previous phases are packaged and presented to the appropriate stakeholders and decision makers. An overview of the four phases and their associated steps are given below.
70
9. Architecture/Design trade-o¤ analysis
1. Presentation Present ATAM. In this step the evaluation leader gives a brief introduction to ATAM to the assembled participants by focusing on establishing a common set of expectations and by answering questions from the participants. Present business drivers. In this step a project spokesperson (ideally the project manager or future/current consumer(s)) describes the business goals that motivate the development e¤ort and hence the primary architectural drivers, such as high availability, time to market or high security. Present architecture. In this step the architect describes the current architecture of the system by focusing on how it addresses the business drivers. 2. Investigation and Analysis Identify architectural approaches. In this step the architect identi…es and describes alternative architectural approaches. Note that the architectural approaches are not analysed at this point. Generate quality attribute utility tree. In this step the quality factors that comprise system utility, such as performance, availability, security, modi…ability, usability, etc., are elicited and speci…ed as scenarios annotated with stimuli and responses and then prioritised. These pieces of information are modelled in a utility tree, which is a hierarchic model of the driving architectural requirements. Analyse architectural approaches. In this step the architectural approaches that address the involved quality factors are elicited and analysed (e.g. an architectural approach aimed at meeting performance goals will be subjected to a performance analysis) based on the high-priority factors identi…ed in the previous step. During this step the architectural risks, the sensitivity points and the trade-o¤ points are also identi…ed. 3. Testing Brainstorm and prioritise scenarios. In this step a larger set of scenarios for each architectural approach is elicited in an brainstorming session preferably involving the entire group of stakeholders. This set of scenarios is then prioritised using a voting process involving the entire stakeholder group. Analyse architectural approaches. This step reiterates the analysis of the architectural approaches step from the investigation and analysis activity for the group of highly ranked scenarios identi…ed in the previous step. These scenarios are considered to be test cases and the analysis may uncover
9.2 Cost Bene…t Analysis Method (CBAM)
71
additional architectural approaches, risks, sensitivity points and trade-o¤ points. 4. Reporting Present results. In this step the results and collected information from the previous steps of ATAM (approaches, scenarios, attribute-speci…c questions, the utility tree, risks, non-risks, sensitivity points and trade o¤s) are collected and put into an easily understandable format to be presented to the decision maker or similar.
9.2 Cost Bene…t Analysis Method (CBAM) CBAM is an extension of ATAM that takes both the architectural and the economic implications of decisions into consideration when evaluating alternative architectures. CBAM focuses on how an organisation should invest its resources to maximise gains and minimise risks and o¤ers a set of techniques for assessing the uncertainty of the judgments involved in assessing costs and bene…ts for each alternative architecture. CBAM begins where ATAM concludes and depends on the artefacts produced by ATAM. ATAM uncovers the architectural decisions made and links these to business goals and quality attribute response measures. CBAM builds on these pieces of information by eliciting the costs and bene…ts associated with the decisions. As the architectural solutions have both technical and economic implications the business goals of a software system should in‡uence the architectural solution used by software architects or designers. The technical implications are the characteristics of the software system (namely the quality attributes) while the direct …nancial implications are the cost of implementing the system. However, the quality attributes also have …nancial implications as the bene…ts are measured as …nancial return on investment derived from the system. When the ATAM is applied to a software system the result is a set of documented artefacts. These are the following: A description of the business goals that are critical for the success of the system. A set of architectural views that document the existing or proposed architectures. A utility tree that represents a decomposition of the quality goals of the stakeholders for each architecture that starts with high-level statements of quality attributes and ends with speci…c scenarios.
72
9. Architecture/Design trade-o¤ analysis
A set of architectural risks that have been identi…ed. A set of sensitivity points, which are architectural decisions that a¤ect some quality attribute measure of concern. A set of trade-o¤ points, which are architectural decisions that either positively or negatively a¤ect more than one quality attribute measure. ATAM also identi…es the set of key architectural decisions that are relevant to the quality attribute scenarios elicited from the stakeholders. These decisions result in speci…c quality attribute responses, such as levels of availability, performance, security, usability and modi…ability. Each decision also has associated costs. This means that using redundant hardware to achieve a desired level of availability has one cost and check-pointing to a disk …le has another cost. Furthermore, both architectural solutions will result in (presumably di¤erent) measurable levels of availability. It is these …nancial considerations that CBAM addresses. CBAM is performed in two iterations: (1) Establish an initial ranking and (2) Incorporating uncertainty. An overview of the two iterations of CBAM is given below. Iteration I: Establish an initial ranking In the …rst iteration of CBAM a series of 9 steps are executed to establish an initial ranking of the result from ATAM. This intial ranking is later re…ned in the second iteration of CBAM. These steps serve to reduce the size of the decision space, re…ne the scenarios, collect su¢ cient information for decision making and to establish an initial ranking of architectural strategies derived using ATAM. Step 1: Collate scenarios. This step collates the scenarios elicited during the ATAM exercise and asks stakeholders to contribute with new scenarios if such exist. Then the scenarios are prioritised in relation to satisfying the business goals of the system and the top one-third of the scenarios are chosen for further study. Step 2: Re…ne scenarios. This step re…nes the scenarios from Step 1 by focusing on their stimulus/response measures. Then for each scenario the worst, current, desired and best-case quality attribute response level is identi…ed and documented. Step 3: Prioritise scenarios. In this step 100 votes are allocated to each stakeholder and each of these are asked to distribute the votes among the scenarios by considering the desired response value for each scenario. The votes are then summed and the top 50% of the scenarios are chosen for further analysis. This is done by assigning a weight of 1.0 to the highest rated scenario and then rating the other scenarios in relation to this scenario. The result of this voting is the scenario weights used to calculate the overall bene…t of an architectural solution.
9.2 Cost Bene…t Analysis Method (CBAM)
73
Step 4: Assign utility. In this step the utility for each quality attribute response level (worst-case, current, desired or best-case) is assigned to all scenarios. The quality attributes of concern in this context are those identi…ed in the previous step. Step 5: Develop architectural strategies for scenarios and determine their expected quality attribute response levels. In this step the architectural strategies addressing the top 50% from Step 3 is developed further to determine the expected quality attribute response levels that will result from implementing the di¤erent architectural strategies. Given that an architectural strategy may a¤ect multiple scenarios, this calculation must be performed for each a¤ected scenario. Step 6: Determine the utility of the expected quality attribute response level by interpolation. In this step the elicited utility values is used to determine the utility of the expected quality attribute response level. The calculation is performed for each a¤ected scenario. Step 7: Calculate the total bene…t obtained from an architectural strategy. In this step the utility value of the “current” level is subtracted from the “expected” level and normalised using the votes from Step 3. Then the bene…t of a particular architectural strategy is summed over all scenarios and all relevant quality attributes. Step 8: Choose architectural strategies based on Return On Investment (ROI) subject to cost and schedule constraints. In this step the cost and schedule implications of each architectural strategy is determined. Then the ROI value for all remaining architectural strategies are calculated as a ratio of bene…t to cost and ranked according to their ROI values. These architectural strategies are then selected from the top of the rank list and down until the budget or schedule is exhausted. Step 9: Con…rm the results with intuition. In this step the chosen architectural strategies are evaluated to examine if they seem to align with the business goals of the organisation. If that is not the case, issues that may have been overlooked during the analysis should be taken into consideration and reiteration of some of the previous steps might be necessary. If signi…cant issues exist it might be necessary to reiterative all nine steps. Iteration II: Incorporating uncertainty A more sophisticated and realistic version of CBAM are achieved by expanding on the steps of CBAM iteration 1. This is done by incorporating uncertainty. This version of CBAM is covered by iteration 2 of CBAM. When incorporating uncertainty information about risk estimation and uncertainty and the allocation of development resources are added into the result from iteration 1. Each category of relevant information may potentially a¤ect the investment decisions
74
9. Architecture/Design trade-o¤ analysis
under consideration. Therefore, the way each of the nine steps of iteration 1 is augmented must be considered carefully for correctness and for practicality. The stakeholder weights in iteration 2 of CBAM are assigned by voting using utility scores. Utility is measured as the relationship between a score and the best score possible, which is usually set to equal 100%. Utility scores are then assigned to each architectural scenario from iteration 1 given in terms of worst case, current, desired and best. Utility scores are given to both scenarios and architectural strategies. To eliminate and prioritise scenarios the stakeholders vote individually or together and the total sum of votes for all scenarios is normalised over 100%. This is to force the stakeholders to prioritise among the alternatives and to avoid them giving votes to an architectural strategy independent of the other architectural strategies involved. The AORDD security solution design trade-o¤ analysis described in Part 4 is a security speci…c design trade-o¤ analysis. This trade-o¤ analysis incorporates ideas from both ATAM and CBAM but is extended to include security solution and misuse-speci…c parameters in addition to the economic implications from CBAM and other relevant development, project and …nancial perspectives as input to the trade-o¤ analysis. The analysis is also extended to incorporate the notion of operational security level, as discussed in Littlewood et al. (1993) [74], to evaluate the operational security level of an information system.
Part III
Security Solution Decision Support Framework
10. The Aspect-Oriented Risk Driven Development (AORDD) Framework
The security solution decision support approach developed in this work is called the Aspect Oriented Risk Driven Development (AORDD) framework. The AORDD framework combines the risk driven development (RDD) work of the CORAS project with the aspect-oriented modelling (AOM) work of the AOM group at Colorado State University (CSU) (see http://www.cs.colostate.edu/ ~france/#Projects). The framework bene…t from techniques in ATAM, CBAM, subjective expert judgment, security assessment and management, the Common Criteria, operational measures of security and BBN and is tailored for aiding decision makers or designers and the like in choosing the best-…tted security solution or set of security solutions among alternatives. The context of this work is security solution decisions for information systems in general and e-commerce systems in particular. Figure 10.1 illustrates the AORDD framework and its seven components which are: 1. An iterative AORDD process. 2. Security solution aspect repository. 3. Estimation repository to store experience from estimation of security risks and security solution variables involved in the trade-o¤ tool BBN topology of component 5. 4. RDD annotation rules for security risk and security solution variable estimation. 5. The AORDD security solution trade-o¤ analysis and trade-o¤ tool BBN topology. 6. Rule set for how to transfer RDD information from the annotated UML diagrams into the trade-o¤ tool BBN topology. 7. Trust-based information aggregation schema to aggregate disparate information in the trade-o¤ tool BBN topology.
78
10. The AORDD Framework AORDD Framework Security aspect repository
RDD annotation rules
Estimation repository
AORDD security solution trade-off analysis
RDD information input rule set
AORDD Process Trust-based information aggregation schema
Fig. 10.1. The seven components of the AORDD framework
The main components of the AORDD framework are component 5: the AORDD security solution trade-o¤ analysis and component 7; the trust-based information aggregation schema. The …ve other components in the framework are supportive components for component 5 and 7. This means that they either provide the underlying process or techniques necessary to support the identi…cation of the best-…tted security solution among alternative security solutions, which is the task of components 5 and 7. What is important to note for the AORDD framework is that it can be used in all phases of the life-cycle of a system and that it is a general security solution decision support framework. The latter means that the approach in principle is applicable for all types of information systems. However, as mentioned earlier this work has only looked into the use of the AORDD framework for supporting security solution decisions in e-commerce systems where the focus has been on the design phase of a development. Details are in Part 6 of this thesis. Security solution decisions in the design phase of a development are called security design decisions. In such decisions separation of concerns is important to distinguish between the alternative security solutions so that they can be evaluated against each other. In the AORDD framework separation of concern is supported by the AORDD security solution trade-o¤ analysis by a¢ liating AOM techniques in combination with RDD techniques. AOM techniques o¤er the ability to separate security solutions to security problems and challenges of an information system from the core functionality of the information system. AOM achieves this by modelling each alternative security solution as an separate and independent security solution aspects and by gathering the core functionality of the system in
10. The AORDD Framework
79
what is called the primary model. This clear separation makes it possible to evaluate one security solution at a time and to observe in practice how the di¤erent alternatives a¤ect the core functionality of the system. For this to be e¤ective in practice e¤ective and tool-supported composition techniques, security veri…cation and composition analysis is necessary. The AORDD framework makes use of the AOM technique developed at CSU, which includes composition techniques and to some extent tool-support for composing security solution aspects with the core functionality of an information system modelled in the primary model. The security veri…cation approach used in the AORDD framework is the UMLsec approach developed by Jürjens (2005) [67]. The UMLsec approach is tool-supported and proven to be fairly e¤ective and accurate. Details are in [67]. It should be noted however that thus fare the AORDD framework has only used the UMLsec approach to verify the security attributes of the security solution aspects and not the …nal composed model. Techniques for analysing the composed model to check that no security design ‡aws arise as a result of the composition and that the resulting model preserve the security attributes of the security solution has not been explored to much extent thus far. The latter is on-going work and the initial ideas are described in Georg, Houmb and Ray (2006) [35]. Information on AOM and AOM techniques can be found in [33, 34, 98] and the references therein. Additionally, Houmb et al. (2006) [48] in Appendix B.2 provides a brief introduction to AOM and describes the role of AOM in the AORDD security solution trade-o¤ analysis. Details on the AORDD framework and its components are in Houmb and Georg (2005) [42], Appendix B.1. Houmb et al. (2006) [48] in Appendix B.2 gives an overview of a specialised version of the AORDD framework called the Integrated Security Veri…cation and Security Solution Design Trade-O¤ Analysis (SVDT) approach.
11. The AORDD Process
The underlying methodology of the AORDD framework is the AORDD process. The AORDD process [47] is based on the CORAS integrated system development and risk management process [97], structured according to the phases of the Rational Uni…ed Process (RUP) [86] and the viewpoints of the Reference Model for Open Distributed Processing (RM-ODP) [56]. As for the CORAS integrated system development and risk management process, the whole or a part of an information system con…gured into a ToE is designed, analysed and composed according to a particular RM-ODP viewpoint in all iteration of the AORDD process. (Note that the ToE is called Target of Assessment (ToA) in CORAS). Hence, security assessment is an integrated activity of the development that drives all iterations of the AORDD process. Security as a quality attribute of the ToE is by this addressed as early as possible and hopefully at the right time for a reasonable price. More information on how to integrate security assessment into the development of an information system is given in Stølen et al. (2002) [97]. Rather than describing all perspectives of the AORDD process the following description is focused on providing an overview of the AORDD process and to explain how it di¤ers from the CORAS integrated system development and risk management process. Readers are referred to Stølen et al. (2002) [97] for other details. The AORDD process di¤ers from the CORAS process in that it provides techniques, syntax and some semantic for describing security solutions (called treatment options in CORAS) as security solution aspects and for composing the security aspects with a primary design model. This is then used as input to the AORDD security solution trade-o¤ analysis in sub-process 5. Modelling the security solutions as security solution aspects ease the task of developing and evaluating alternative security solutions in the risk treatment subprocess (sub-process 5) of the CORAS risk management process, which is part of the CORAS integrated system development and risk management process. This also enhances software evolution and increases reusability. However, as the CORAS risk management process and the underlying CORAS MBRA method-
82
11. The AORDD Process
ology do not include guidelines for evaluating alternative security solutions and identifying the most e¤ective set of security solutions for a security problem or challenge, which is a critical success factor for cost-e¤ective development of security critical information systems, these issues need to be addressed explicitly in the AORDD process. Thus, the AORDD process provides activities, techniques and guidelines that assist a decision maker, designer or the like in choosing from alternative security solutions. The AORDD process also o¤ers guidelines on how to estimate the involved variables in security solution decision support. Figure 11.1 illustrates the iterative nature of the AORDD process while Figure 11.2 gives an overview of the activities involved in the requirement and design phases. The AORDD process consists of a requirement phase, a design phase, implementation phase, deployment phase and a maintenance phase. Development spirals from requirements to maintenance and in each phase development activities are structured into iterations. Work moves from one phase to the next after …rst iterating through several sub-phases that end with acceptable analysis results. It should be noted that the analysis activity in AORDD di¤ers from the assessment activity, as shown in Figure 11.1. In the AORDD process assessing risks concern identifying potential security problems and to identify and evaluate alternative security solutions to solve the security problem or challenge while the analyse activity refers to the veri…cation and analysis of the composed models to identify design ‡aws. Details on the latter is in Georg, Houmb and Ray (2006) [35]. As can be seen in Figure 11.1 each phase and all iterations in each phase includes a security assessment activity. This security assessment activity is where the security risks to a ToE (or information system) is identi…ed and where the alternative security solutions to solve the security risks are analysed. As described in Chapter 5 security assessment is a specialisation of risk management for the security domain that was adapted into a MBRA domain for security critical information systems by the CORAS project. In the AORDD framework the risk assessment process of CORAS has been augmented with activities to support and execute the AORDD security solution trade-o¤ analysis. The activities of the security assessment step in the AORDD process is as following: Sub-process 1: Context identi…cation – Activity 1.1: Identify purpose and scope of assessment – Activity 1.2: Describe the target of evaluation (ToE), business perspectives and the security environment
11. The AORDD Process
83
Requirements Phase assess risks
Design Phase analyze
specify requirements
Maintenance Phase analyze
specify design
assess risks
assess risks
analyze
specify changes iterative development
implement analyze
deploy assess risks assess risks
analyze
Implementation Phase
Deployment Phase
Fig. 11.1. Outline of the AORDD process
Specify sec.req Req. risk assessment Solutionas req. Trade-off decision Refine and update
Choose a part Specify design Design risk assessment Solutionas design
Implementation
Choosea part Specify funtional req. req
iterate
Elaboration Design
Inception Requirement
iterate
Trade-off decision Refine and update
Security Solution Aspect Fig. 11.2. Overview of the activities of the requirement and design phase of the AORDD process
84
11. The AORDD Process
– Activity 1.3: Identify system stakeholders – Activity 1.4: Identify assets and have stakeholders assign values to assets – Activity 1.5: Describe the asset-stakeholder graph – Activity 1.6: Describe relevant security policies (SP) – Activity 1.7: Identify and describe the security risk acceptance criteria (SAC) Sub-process 2: Risk identi…cation – Activity 2.1: Identify security threats to assets from the security environment – Activity 2.2: Identify vulnerabilities in ToE, security policies, security processes, security procedures and the security environment – Activity 2.3: Document misuse scenarios and group misuses into misuse groups Sub-process 3: Risk analysis – Activity 3.1: Estimate impact of misuse – Activity 3.2: Estimate frequency of misuse Sub-process 4: Risk evaluation – Activity 4.1: Determine level of risk for each set of impact and frequency – Activity 4.2: Evaluate risks against the security risk acceptance criteria (SAC) – Activity 4.2: Categorise risks in need of treatment into risk themes – Activity 4.3: Determine interrelationships among risk themes – Activity 4.4: Identify con‡icts among risk themes – Activity 4.5: Prioritise risk themes and risks – Activity 4.6: Resolve identi…ed con‡icts Sub-process 5: Risk treatment – Activity 5.1: Identify alternative security solutions and group these into security solution sets – Activity 5.2: Identify e¤ect and cost of all alternative security solutions – Activity 5.3: Model all security solutions as security solution aspects using RDD modelling elements – Activity 5.4: Compose security aspects with primary model and compose RDD information
11. The AORDD Process
85
– Activity 5.5: Evaluate and …nd the best-…tted security solution or set of security solutions using the AORDD security solution trade-o¤ analysis The main di¤erence from the activities of the CORAS security assessment process is the re…nement of the activities in sub-process 1, the use of the concept misuse rather than unwanted incident in sub-process 2, a clear separation of potential con‡icts among risk themes and risks in sub-process 4 and a re…nement and extension of the activities of sub-process 5. It is in sub-process 5 that the security solution decision support is made explicit by use of the AORDD security solution trade-o¤ analysis to support the choice of security solution or set of security solutions among alternatives. As can be seen in Figure 11.2 the security assessment step in the requirement speci…cation phase is done using the functional and security requirements as the ToE. The result of this activity is a set of unresolved security problems or challenges. These problems are either solved in sub-process 5 of the respective iteration or transformed into security requirements for the next iteration. In the design phase the security risk assessment is done using the available design speci…cation as the ToE. Similar to the requirement phase the security problems or challenges identi…ed are either solved as a security solution design decision in sub-process 5 of the security assessment step of a particular iteration or transformed into security requirements in the next iteration. This means that whenever new security requirements are introduced the relevant parts of the information system goes through a new requirement security risk assessment before proceeding to the next development phase. Details on the AORDD process are in Houmb et al. (2004) [47]. Details on the AORDD security solution trade-o¤ analysis are in Part 4, Houmb et al. (2006) [48] in Appendix B.2 and Houmb et al. (2005) [44] in Appendix B.3. Details on the AORDD framework are in Houmb and Georg (2005) [42], Appendix B.1.
Part IV
AORDD Security Solution Trade-O¤ Analysis
12. The Role of Trade-O¤ Analysis in Security Decisions
In security assessment and management there are no single correct solution to the identi…ed security problems or challenges but rather choices and tradeo¤s. The main reason for this is that information systems and in particular security critical information systems must perform at the contracted or expected security level, make e¤ective use of available resources, comply with standards and regulation and meet end-users’expectations. Balancing these needs while also ful…lling development, project and …nancial perspectives to an information system such as budget and TTM constraints require decision makers, designers and the like to evaluate alternative security solutions to their security problems or challenges. As described in Chapter 10 (Part 3) choosing among alternative security solutions is part of the risk treatment sub-process of the security assessment activity in the AORDD process. The technique used to perform this activity is the AORDD security solution trade-o¤ analysis. This analysis takes security, development, project and …nancial perspective into mind during its evaluation of how well a particular security solution …ts with the set of stakeholder and system goals and expectations and the requirements posed upon an information system. This is measured as a security solution …tness score, but before discussing the details of how to use the AORDD security solution trade-o¤ analysis to derive this …tness score, it is important to clearly de…ne and explain the ascribed meaning to the concepts trade-o¤ analysis and security solution in the context of the AORDD framework. This is to enable reproducibility of this work. De…nition Trade-o¤ Analysis is making decisions when each choice has both advantages and disadvantages. In a simple trade-o¤ it may be enough to list each alternative and the pros and cons. For more complicated decisions, list the decision criteria and weight them. Determine how each option rates on each of the decision score and compute a weighted total score for each option. The option with the best score is the preferred option. Decision trees may be used when options have uncertain outcomes [101].
90
12. The Role of Trade-O¤ Analysis in Security Decisions
De…nition Security solution is any construct that increases the level of con…dentiality, integrity, availability, authenticity, accountability, non-repudiation, and/or reliability of a ToE. Examples of security solutions are security requirements, security protocols, security procedures, security processes and security mechanism, such as cryptographic algorithm and anti-virus software. As can be seen by the above de…nitions trade-o¤ concerns decisions where there are alternative solutions that all have both advantages and disadvantages in terms of the goals involved. To aid such decisions it is necessary to measure the alternatives against each other by means of comparable relative weights derived using a set of decision criteria. This means that the estimation techniques used must produce comparable weights for the alternative security solutions. Estimation techniques can be either qualitative or quantitative. In the context of the AORDD framework these are used to measure the degree that a security solution addresses the set of decision criteria involved in a security solution decision. For the security assessment activity in the AORDD process decision criteria are called trade-o¤ parameters and includes security risk acceptance criteria, standards, policies, laws and regulation, priorities, business goals, TTM, budget, the e¤ect that a security solution have on the security problem or challenge that it is a solution to and the resources needed for employment and proper maintenance of the security solution. Details are in Chapter 13. The AORDD framework measures security in terms of the seven security attributes con…dentiality, integrity, availability, authenticity, accountability, nonrepudiation and reliability. This means that the AORDD security solution tradeo¤ analysis can use these seven security attributes to measure the decision score for each of the decision variables mentioned above. When deriving the …tness score of a security solution using the AORDD security solution trade-o¤ analysis each of these decision scores are combined into a total decision score. This total decision score measures the perceived level of ful…lment of the stakeholder and system goals and expectations and the requirements posed upon an information system for an security solution relative, to the other alternative security solutions. Details are in Chapter 13. However, as discussed in Chapter 5 there is usually a great deal of uncertainty involved in security solution trade-o¤ analysis as little hard or empirical data or evidence on the actual e¤ect and cost of a particular security solution exists. There are many reasons for this, one being the instability of the security environment of an information system and that information systems tend to vary from each other to such a degree that experience on one cannot directly be reused on the other. Other sources of uncertainty in a security solution trade-o¤ context are the lack of overview of the factors involved in the security solution decision and
12. The Role of Trade-O¤ Analysis in Security Decisions
91
that new security solutions are introduced faster than their actual e¤ect in various situations are demonstrated. Thus, the AORDD security solution trade-o¤ analysis needs to deal with disparate information and uncertainties. Recall from Chapter 5 that uncertainty in this work is interpreted according to the subjectivistic interpretation of probability. Note that uncertainty usually cannot be completely dealt with, as this implies deriving at a state where there is certain which security solution alternative is the better. Thus the goal of the AORDD security solution trade-o¤ analysis is not to remove uncertainty, but to derive at a state where there are clear indications that one or a few of the alternative security solutions are better suited than others.
13. AORDD Security Solution Trade-O¤ Analysis
The AORDD security solution trade-o¤ analysis is part of the risk driven development (RDD) strategy in the AORDD framework. In this context RDD means that identifying, analysing and evaluating security risks is the driving factor in the development process. This RDD strategy is incorporated into the activities of the AORDD process and used to decide whether to move from one development iteration or phase to the next in the AORDD process. The role of the security solution trade-o¤ analysis in the AORDD framework is to evaluate alternative security solutions to the identi…ed security risks in all iterations and phases of the AORDD process. This refers to Activity 5.5; Evaluate and …nd the best-…tted security solution or set of security solutions using the AORDD security solution trade-o¤ analysis, of the security assessment activity of the AORDD process. Details are in Chapter 11. There are several ways to measure what is the …ttest security solution amongst alternatives. In the AORDD framework this is done using a …tness score derived from decision variables addressing the following high level perspectives: security level and relevant development, project and …nancial goals. This means that the …tness score is an expression of how well a security solution meets the contracted, expected or required security level and the relevant development, project and …nancial perspectives for the ToE or the information system. The AORDD security solution trade-o¤ analysis deals with this by separating the analysis into two phases: (1) Evaluate security risks against the security risk acceptance criteria and (2) Trade-o¤ alternative security solutions by means of relevant development, project and …nancial perspectives. Figure 13.1 gives an overview of the groups of inputs and outputs of the twophase trade-o¤ analysis while Figure 13.2 shows the security assessment concepts involved in the trade-o¤ analysis. There are also development, project and …nancial perspectives involved and these are represented by the ‘trade-o¤ parameters’ in Figure 13.1 and discussed in detail in Section 13.2. The …rst phase of the AORDD security solution trade-o¤ analysis is called riskdriven analysis. The risk-driven analysis involves the evaluation of the set of
94
13. AORDD Security Solution Trade-O¤ Analysis
security risk acceptance criteria Risk-driven analysis
list of security risks in need of treatment
alternative security solutions
trade-off parameters Trade-off analysis
best “fitted”security solution or set of security solutions
Fig. 13.1. The two phases of the AORDD security solution trade-o¤ analysis
identi…ed misuses and their associated risk levels, which are the result of subprocesses 2, 3 and 4 of the AORDD process, against the relevant set of security risk acceptance criteria, such as those identi…ed in sub-process 1 of the AORDD process. The result of this phase is a list of security risks in need of treatment. This means that the risk-driven analysis covers sub-processes 1, 2, 3 and 4 of the AORDD process, as described in Chapter 11. The list of security risks in need of treatment, the set of alternative security solutions and the trade-o¤ parameters which are the relevant development, project and …nancial perspectives involved, are the inputs to the second phase of the AORDD security solution trade-o¤ analysis. Here, the security risks are the problems or challenges that need to be solved, the security solutions are the alternative ways of solving the problems and the trade-o¤ parameters are the decision variables. The outputs from the second phase are the best-…tted security solution or set of security solutions. This means that Phase 2 is where the security solutions are traded-o¤. This is done by deriving the relative …tness score for each security solution and then comparing these to identify the best-…tted security solution or set of security solutions. As for Phase 1 there are security assessment concepts involved and these are shown in Figure 13.2. More details on both phases are given in the following.
13.1 Phase 1: Risk-driven analysis
95
Phase 2
Phase 1 Relates to
Risk Acceptance 1
Risk
1
1
Misuse 1..* 1 1
1 Frequency 1
1
Reduces
1..*
Impact Reduces
1
1..*
Security Solution
Fig. 13.2. The security assessment concepts involved in Phase 1 and 2 of the AORDD security solution trade-o¤ analysis
13.1 Phase 1: Risk-driven analysis The activities in the risk-driven analysis are supported by standard vulnerability assessment and vulnerability scans, other types of security analysis and standard risk assessment methods, such as those in the CORAS framework. In the AORDD framework no constraints are put on the selection of the methods used as long as the output is a list of security risks in need of treatment, as shown in Figure 13.2. However, the AORDD process o¤ers a structured approach to derive these pieces of information through the activities of sub-processes 2, 3 and 4 in its security assessment activity, as described in Chapter 11. In addition, security risk acceptance criteria are needed. These are derived in activity 1.7 of the AORDD security assessment activity. Hence, the relevant activities from the AORDD security assessment activity for Phase 1 is the following: Sub-process 1: Context identi…cation – Activity 1.7: Identify and describe the security risk acceptance criteria (SAC) Sub-process 2: Risk identi…cation
96
13. AORDD Security Solution Trade-O¤ Analysis
– Activity 2.1: Identify security threats to assets from the security environment – Activity 2.2: Identify vulnerabilities in ToE, security policies, security processes, security procedures and the security environment – Activity 2.3: Document misuse scenarios and group misuses into misuse groups Sub-process 3: Risk analysis – Activity 3.1: Estimate impact of misuse – Activity 3.2: Estimate frequency of misuse Sub-process 4: Risk evaluation – Activity 4.1: Determine level of risk for each set of impact and frequency – Activity 4.2: Evaluate risks against the security risk acceptance criteria (SAC) – Activity 4.2: Categorise risks in need of treatment into risk themes – Activity 4.3: Determine interrelationships among risk themes – Activity 4.4: Identify con‡icts among risk themes – Activity 4.5: Prioritise risk themes and risks – Activity 4.6: Resolve identi…ed con‡icts The above activity list involves a set of concepts and these are the pieces of information involved in Phase 1 of the trade-o¤ analysis. These concepts are security threat, vulnerability, misuse, misuse frequency, misuse impact, security risk and security risk acceptance criteria, as shown in Figure 13.3. Figure 13.3 shows parts of the AORDD concept-relation model described in Houmb and Georg (2005) [42], Appendix B.1. In the following the assumption is that the output from sub-processes 2 and 3 of the AORDD security assessment activity are sets of vulnerabilities, security threats, misuses, misuse frequency and misuse impact. These pieces of information are necessary in order to derive the risk level of the ToE and for evaluating which of the security risks that needs to be treated. In the AORDD security assessment activity deriving the security risks is the task of sub-process 4 where a security risk is derived for each misuse by combining the misuse frequency with one of the misuse impacts. This means that one misuse leads to one or more security risks depending on the number of associated misuse impacts. As both misuse frequency and misuse impact can be described either as a qualitative value or as a quantitatively value the resulting risk level can also be measured either qualitatively or quantitatively. However, to combine misuse frequency and
13.1 Phase 1: Risk-driven analysis
97
Cause of system impact Cause of impact
SecurityThreat Threat
Unwanted MisuseIncident * 1
Vulnerability
*
1..* Relates to
Security Risk Acceptance criteria 1..*
1..*
1
Security Risk 1
Has
Misuse Frequency Frequency
1
1 Has Misuse Impact
Fig. 13.3. Concepts involved in Phase 1 of the AORDD security solution trade-o¤ analysis
misuse impact into a security risk both values need to be in the same format or transformed in such a way that they can be combined. When qualitative values are used for all involved concepts it is called qualitative risk evaluation. Qualitative risk evaluation usually involves two sets of qualitative scales that are combined into a qualitative scale describing the risk level of a security risk. For example, if the misuse frequency is measured according to the qualitative scale {incredible, improbable, remote, occasional, probable and frequent} and the misuse impact is measured according to the qualitative scale {negligible, marginal, critical and catastrophic} the resulting security risk may be measured according to the qualitative scale {low, medium, high, extreme and catastrophic}, denoting the level of risk. The way this is done in practice is to combine the two input qualitative scales into a risk matrix with misuse impact values on the vertical scale and misuse frequency values on the horizontal scale. Each cell in the risk matrix then denotes a risk level, which in this context is according to the qualitative scale {low, medium, high, extreme and catastrophic}. Examples of qualitative scales for misuse impact, misuse frequency and risk level are in AS/NZS 4360:2004 [4].
98
13. AORDD Security Solution Trade-O¤ Analysis Impact
Security Threat
Misuse
Loss
L1
I1 I2
L2
I3
L3
Fig. 13.4. Example of a risk model
Misuse frequency and misuse impact can also be expressed as quantitative values and in such cases misuse frequency are either given as the number of occurrences within a certain time frame or as a probability measure, such as for example the probability for the misuse to occur within a certain time frame. Quantitative misuse impact values may be measured using several units, including …nancial loss, loss of reputation etc. When both misuse frequency and misuse impact are given as quantitative values it is called quantitative risk evaluation. Quantities risk evaluation di¤ers from qualitative risk evaluation in that quantitative misuse frequency and impact values are directly computable and thus the risk level are directly derived as the product of the two. However, probability as an expression of misuse frequency can be given according to the classical or the subjective interpretation of probability. Classical interpretation in the case of quantitative risk evaluation means that there is a probability P for an event e to occur within the time frame t. This P is interpreted as a true value of the actual event e and the uncertainty of how close P is to the true value is modelled by associating con…dence intervals. Interpreting quantitative misuse frequency values in the subjectivist way means that P is considered as a belief in the occurrence of the event e expressed using some probability distribution, such as the Triang distribution. In this case it is not the true value of P that is expressed but an expert’s or other information source’s uncertainty on the occurrence of event e within time frame t. The same is the case for subjective interpretation of quantitative misuse impact values. Furthermore, it does not always make sense to directly multiply the misuse frequency and misuse impact values to obtain the risk level in quantitative risk evaluation. The reason might be that the impacts of particular misuses are dependent on each other. In such cases the risk level can be derived by examining the misuse frequency and misuse impact values separately before combine them in a risk model, such as the one shown in Figure 13.4. In the risk model in Figure 13.4, loss related to a particular security threat are expressed by the impact space f(I1 ; F1 ); (I2 ; F2 ); :::; (In ; Fn )g where Fi is the occurrence rate or occurrence probability for the misuse leading to the impact Ii .
13.1 Phase 1: Risk-driven analysis
99
This results in the set of losses fL1 ; L2 ; :::; Li g and measures such as statistical expected loss can be used to express the risk level. Statistic expected loss is determined by summing over the impact space by multiplying each loss in the set fL1 ; L2 ; :::; Li g with its associated impact, as shown in Equation 13.1. ‘Statistical expected loss’= (I 1 F 1 )
L1 +::: + (I i F i ) Li +::: +(In F n) Ln
(13.1)
Using risk models and expressing risk level using intuitive measures like statistical expected loss makes the results from the risk-driven analysis in Phase 1 of the trade-o¤ analysis easily accessible for the decision makers. These measures are concrete and enable the decision makers to directly compare the alternative security solutions by means of the e¤ect on the impact space and the statistical expected loss. There are also risk evaluation situations where there are insu¢ cient information to asses the impact, the frequency or both. In such situations it becomes particularly valuable to use the subjective interpretation of probability as this opens for the use of subjective expert judgments. Examples of such are the Markov like analysis described in Houmb, Georg, France, Reddy and Bieman (2005) [43]. 13.1.1 The relationship between vulnerability, security threat, misuse and security risk in AORDD The AORDD security assessment activity performs two types of identi…cation activities during sub-process 2. These are vulnerability analysis and security threat identi…cation. This separation of identi…cation activities is according to AS/NZS 4360:2004 and the the Common Criteria and is done to distinguish between problems with the ToE or its security environments, from the events that might exploit these problems in an undesired manner. This means that a vulnerability is understood as a weakness in the ToE or the ToE security environment that can be misused and a security threat is the event that performs the misuse of the weakness in the ToE or the ToE security environment. De…nition Vulnerability is a weakness in the ToE and/or the ToE security environment that if exploited a¤ ects the capabilities of one or more of the security attributes con…dentiality, integrity, availability, authenticity, accountability, non-repudiation or reliability of one or more assets (modi…ed from AS/NZS 4360:2004 [4]).
100
13. AORDD Security Solution Trade-O¤ Analysis Misuse Security threats
Security vulnerabilities
Fig. 13.5. Relation between security threat, security vulnerability and misuse
De…nition Security Threat is a potential undesired event in the ToE and/or the ToE security environment that may exploit one or more vulnerabilities a¤ ecting the capabilities of one or more of the security attributes con…dentiality, integrity, availability, authenticity, accountability, non-repudiation or reliability of one or more assets (modi…ed from AS/NZS 4360:2004 [4]). The result of a security threat exploiting a vulnerability is some undesired event. This undesired event is called a misuse. It is important to note however that misuses can only occur if both a vulnerability and a security threat exist and if the vulnerability is exploitable by the security threat. This means that the set of potential misuses is a sub set of the set of vulnerabilities and that the set of potential security threats and hence M = ST \ SV where M is the set of misuses, ST is the set of security threats and SV is the set of security vulnerabilities, as shown in Figure 13.5. The undesirability of a misuse is always towards one or more of the system assets as the AORDD process and the AORDD framework is asset-driven. The way assets can be a¤ected is that their values are either reduced or increased. In the AORDD framework asset value reduction results from some loss in the capabilities of one or more of the security attributes of a ToE while asset value increase results from some gain in the capabilities of one or more of the security attributes of a ToE. The actual asset value loss or gain is not the misuse, but rather the impact of the misuse. These issues are elaborated on in the following. De…nition Misuse is an event that a¤ ects one or more of the security attributes con…dentiality, integrity, availability, authenticity, accountability, non-repudiation or reliability of one or more assets.
13.1 Phase 1: Risk-driven analysis
101
Threat is initiated
[vulnerability exist]
[safeguard exist]
[safeguard does not exist] [vulnerability does not exist] Threat exploits vulnerability
Threat is prevented by Safeguard
Misuse occurs
Fig. 13.6. Overview of how misuses happen and how they can be prevented
As misuses leads to impacts that can be negative or positive, the resulting security risk can also be either negative or positive. Exploring the positive e¤ects of misuses are often referred to as opportunity analysis and commonly used in the …nance and stock trade domain. However, this issue will not be elaborated on in this work as it was not part of the scope of this work. Assuming that misuses have negative impact on asset values it is important to know how to prevent, detect or act on misuses. Figure 13.6 illustrates the general principle of how misuses are created and how they can be prevented. As can be seen in the …gure there are situations where security threats are identi…ed but where there does not exists any vulnerabilities for the security threat to exploit and hence no misuse can occur. In such situations no treatment is needed as there are no events or impact to reduce or prevent. Also, if there already exist practice, procedure or security mechanism in the ToE and/or the ToE security environment that are able to prevent the security threat from exploiting the vulnerability no misuse will occur. Such existing security threat protections are called safeguards. De…nition Safeguard is an existing practice, procedure or security mechanism in the ToE and/or the ToE security environment that reduces or prevents security threats from exploiting vulnerabilities and thus reduces the level of risk (modi…ed from ISO 13335 [54]). In addition to the above mentioned cases there might be situations where a security threat is not able to exploit a vulnerability even though no safeguards
102
13. AORDD Security Solution Trade-O¤ Analysis
exists. The reason for this might be that the magnitude of the security threat is not big enough to launce the exploit. In such cases the exploit might be launched if several security threats are initiated simultaneously and where the combination of these breaks the exploit limit. This is best modelled using Petri Nets (PN) or similar dynamic modelling behaviour semantic. An example of a Coloured Petri Nets (CPN) model that capture the perspective of misuse comprised of several simulations security threats initiated by several attackers is described in Houmb and Sallhammar (2005) [46]. Furthermore, there are also cases where a security threat exploits a vulnerability and initiate a chain of misuses resulting in a misuse hierarchy, as illustrated in Figure 13.7. In the case of a misuse hierarchy there is always either a single security threat or several simultaneously security threats that initiate the chain of events. This security threat is referred to as a basic security threat. An example of a misuse hierarchy security attack is the "ILOVEYOU" virus. This virus exploited a vulnerability in the email client Microsoft Outlook so that when a user opened the email with the virus, the virus used the address book in Microsoft Outlook and the users’email account to propagate the virus. For some companies many of these address book entries where address lists and internal contacts and the amount of email sent within and out of the SMTP server in some of these companies triggered the exploit of a vulnerability in some Virus walls and resulted in the Virus wall either letting all emails pass through without cheeking for viruses or that emails got stuck in an never-ending sending queue on the Virus wall. As described earlier, a security risk is usually measured as the combination of one misuse frequency and one misuse impact. In the AORDD framework additional concepts related to operational security level are also included. These are mean time and e¤ort to misuse and called MTTM and METM. In the misuse hierarchy this means that there is a set of misuse frequency, misuse impact, MTTM and METM for each level in the hierarchy. As the occurrence of a misuse in the layer above in the misuse hierarchy is dependent on the occurrence of all misuses in the layers below the misuse frequency for each level is a multiple of the misuse frequency for the current layer and all layers below.
MF j=
j Q
M F i M F (i
1)
(13.2)
i=1
where M Fj is the misuse frequency for the current layer j, M Fi is the misuse frequency for layer number i and M F(i 1) is the misuse frequency for layer number (i 1). The associated de…nitions are given below:
13.1 Phase 1: Risk-driven analysis
103
Misuse occurs
Misuse occurs
Misuse occurs
Basic threat
Vulnerability exist
Vulnerability exist
Vulnerability exist
Fig. 13.7. Illustration of a misuse hierarchy
De…nition Basic Security Threat is the initial security threat that exploits one or more vulnerabilities in the ToE or the ToE security environment and leads to a chain of misuses. De…nition Misuse Frequency is a measure of the occurrence rate of a misuse expressed as either the number of occurrences of a misuse in a given time frame or the probability of the occurrence of a misuse in a given time frame (modi…ed from AS/NZS 4360:2004 [4]). De…nition Misuse Impact is the non-empty set of either a reduction or an increase of the asset value for one asset. De…nition Loss is a reduction in the asset value for one asset. De…nition Gain is an increase in the asset value for one asset. De…nition Security Risk is the combination of exactly one misuse frequency, one misuse impact, one mean time to misuse (MTTM) and one mean e¤ ort to misuse (METM) (modi…ed from AS/NZS 4360:2004 [4] by taking in the concepts for operational security level from Littlewood et al. [74]).
104
13. AORDD Security Solution Trade-O¤ Analysis
13.1.2 Deriving the list of security risks in need of treatment De…nition Security Risk Acceptance Criteria is a description of the acceptable level of risk (modi…ed from AS/NZS 4360:2004 [4]). The security acceptance criteria are derived in activity 1.7 of the AORDD security assessment activity. Such criteria are descriptions of what is an acceptable level of risk for a particular ToE. These criteria are usually given by the set of stakeholders involved in the security assessment and management and most preferable the decision maker. The reason for this, is that the stakeholder responsible for an eventual damage or paying for the security solution aiming at preventing, detecting or removing the security risk should also decide on the acceptable potential damage. This potential damage should also be evaluated in relation to the cost associated with the potential security solutions. It is however often di¢ cult for any stakeholder to set the acceptance level before some information on the potential damage is available. In practice this means that such criteria often are negotiated between the stakeholders during the risk evaluation phase of a security assessment, which refers to sub-process 4 of the security assessment activity in the AORDD process. The acceptance criteria can also be derived from relevant standards, company security policies and business goals. In the AORDD framework the security risk acceptance criteria are recommended derived as part of the context identi…cation in sub-process 1. However, security risk acceptance criteria information is also supported as dynamic and negotiable information in the AORDD security solution trade-o¤ analysis. This means that the criteria may be updated whenever more information becomes available throughout the development or assessment of a ToE and that it can be a negotiation variable while trading of security solutions in Phase 2 of the trade-o¤ analysis. The latter is described in Section 13.2. In Phase 1 of the trade-o¤ analysis the security risk acceptance criteria available at the time is used to evaluate which security risks are acceptable and which are not acceptable. The main goal of this task is to partition the set of resulting security risks from sub-process 4 of the AORDD security assessment activity into the subset of security risks that must be treated and the subset of security risks that can be discarded from further consideration. An example of a security risk acceptance criteria used to partition risk levels is that all risks with levels greater than or equal to risk level ‘HIGH’ must be treated. In this context treated means reducing the risk level to lower than ‘HIGH’. Note that in this example all security risks with the risk level lower than ‘HIGH’ are disregarded and not included in the trade-o¤ analysis performed in Phase 2 of the AORDD security solution trade-o¤ analysis. Also note that the security risk acceptance criteria should be formatted to be comparable with the security risks, as discussed ear-
13.2 Phase 2: Trade-o¤ analysis
105
lier. For example if the security risks are given in terms of a risk matrix using the qualitative risk level scale {low, medium, high, extreme, catastrophic}, the security risk acceptance criteria should preferable also be given according to this scale. If that is not possible the acceptance criteria must be interpreted or transformed before they can be used to separate the acceptable security risks from the unacceptable security risks. Similarly, for quantitative security risk measures the security risk acceptance criteria should be expressed as a comparable quantitative value of acceptable risk level. The same goes for risk models producing measures such as statistical expected loss where the security risk acceptance criteria should preferable be expressed as maximum and minimum acceptable statistical loss.
N SR = SR \ SAC ASR = SR SR \ SAC
(13.3) (13.4)
where N SR is the set of non-acceptable security risks, ASR is the set of acceptable security risks, SR is the set of security risks and SAC is the set of security acceptance criteria.
13.2 Phase 2: Trade-o¤ analysis Phase 2 of the AORDD security solution trade-o¤ analysis concerns the evaluation and choice of security solutions from a set of alternatives. This covers sub-process 5; the risk treatment sub-process, of the AORDD security assessment activity discussed in Chapter 11 and are called trade-o¤ analysis as it is in this phase that the alternative security solutions are traded o¤. The main goal of Phase 2 is to identify and evaluate alternative security solutions to the resulting list of security risks from Phase 1 and the expected output is a rated list of security solutions for each of the security risks transferred from Phase 1. It is this rated list that the decision maker uses as support when deciding on which security solution to employ in the ToE. More details are given in Houmb et al. (2005) [44] enclosed as Appendix B.3. The task of Phase 2 in relation to security assessment is to handle risk treatment. Risk treatment is an activity that is included in most security assessment approaches, such as the CORAS approach and CRAMM. However, there is one main di¤erence between the risk treatment strategy of the AORDD security solution trade-o¤ analysis and other security assessment approaches and this is the detailed and structured support for dynamically trading o¤ alternative security
106
13. AORDD Security Solution Trade-O¤ Analysis
solutions based on security perspectives and development, project and …nancial perspectives. Actually, the AORDD security solution trade-o¤ analysis focuses only on the risk treatment part of a security assessment. In the following the activities of sub-process 5 is given and the concepts involved in Phase 2 of the AORDD security solution trade-o¤ analysis is discussed. The activities of sub-process 5 of the security assessment activity in the AORDD process are the following: Sub-process 5: Risk treatment – Activity 5.1: Identify alternative security solutions and group these into security solution sets – Activity 5.2: Identify e¤ect and cost of all alternative security solutions – Activity 5.3: Model all security solutions as security solution aspects using RDD modelling elements – Activity 5.4: Compose security aspects with primary model and compose RDD information – Activity 5.5: Evaluate and …nd the best-…tted security solution or set of security solutions using the AORDD security solution trade-o¤ analysis Activity 5.1 identi…es alternative security solutions to one or more of the security risks transferred from Phase 1. In the AORDD framework this activity is partly handled by the security aspect repository, which stores experience from earlier security solution decision situations and partly by domain knowledge and subjective expert judgment. However, this activity is often not straightforward. See Houmb et al. (2006) [48] in Appendix B.2 and Georg, Houmb and Ray (2006) [35] for details. The way activity 5.1 is performed in practice is to …rst identify the alternative security solutions, then check to what degree each security solution meets the expected security requirements, before verifying that the security solution does not contain ‡aws or vulnerabilities and that all involved security requirements still holds also after each security solution is employed in the ToE and …nally that the core functionality of the ToE is not substantially a¤ected. This is done for all security risks in the outputted list of security risks from Phase 1 and used to identify alternative sets of security solutions. In this context a set of security solutions is one unique con…guration of security solutions that together solves some or all security risks in the resulting list of security risks from Phase 1. As security solutions often are not independent of each other the dependencies between the security solutions in a set must also be considered. This is discussed to some degree in Matheson, Ray, Ray and Houmb (2005) [22]. Note that it
13.2 Phase 2: Trade-o¤ analysis
107
is also possible to evaluate security solutions for one security risk at the time. Note also that the sub activities of activity 5.1 is handled by other parts of the AORDD framework and in particular the RDD annotation rules for security risk and security solution variable estimation, the UMLsec security veri…cation technique of Jürjens [67] and AOM composition techniques, such as that discussed in Straw et al. (2004) [98]. In activity 5.2 the associated cost and treatment e¤ect of each security solution identi…ed in activity 5.1 is examined and estimated. Note that both the security solution cost and the security solution e¤ect are variables to the trade-o¤ analysis in Phase 2, as shown in Figure 13.9. As the values of these variables in many cases is unknown or at least uncertain they need to be estimated. In the AORDD framework the treatment e¤ects of a security solution is assessed using AOM composition, as discussed in Georg, Houmb and Ray (2006) [35]. In addition to the AOM composition subjective expert judgment and domain knowledge can be used to assess this variable. The security solution cost is often harder to estimate as there are many factors involved in estimating cost of future events. The latter is further elaborated on in Section 13.2.3. In activity 5.3 each security solution is modelled as a UML security solution aspect and annotated with RDD modelling elements. The RDD modelling elements relevant for Phase 2 are the misuse and security solution variables shown in Figure 13.8. Details on the RDD UML Pro…le can be found in Houmb, Georg, France, Reddy and Bieman (2005) [43], Georg, Houmb and Ray (2006) [35] and Georg, Houmb and France (2006) [36]. Note that the terms in Figure 13.8 have been de…ned earlier and are given in complete in Appendix A; AORDD concepts. In activity 5.4 the security solution aspects are composed with the core functionality of the ToE and the e¤ects that each security solution has on the ToE are observed. The RDD information in the security solution aspects and the primary model for the ToE is also composed, as discussed in Georg, Houmb and Ray (2006) [35]. To validate that no new design ‡aws or other vulnerabilities has emerged as a direct or indirect result of the composition, it is necessary to follow all composition activities with testing and veri…cation activities. This issue is discussed in some detail in Houmb et al. (2005) [44] in Appendix B.3 and Georg, Houmb and Ray (2006) [35]. In activity 5.5, each of the security solutions are evaluated in terms of their …tness to the decision factors involved in a particular security solution decision situation. These factors are called the decision criteria and examples of such are the security requirements that the security solutions need to meet and the development, project and …nancial perspectives that the ToE must adhere to. The main aim of this activity is to derive the …tness score for each alternative security solution or each security solution set in terms of the above mentioned decision criteria.
108
13. AORDD Security Solution Trade-O¤ Analysis
Unwanted MisuseIncident * 1
Vulnerability Vulnerability
1 1..* Prevents
Safeguard
*
1 1..* Own
Protects 1..*
1..* Risk Risk 1
Stakeholder
1
1
1..*
Value
Security Mechanism 1
1 May reduce
1 1
May increase
1
Asset 1..* Contains 1
Target of Evaluation 1
Has
Frequency Frequency 1 Reduces
1 Has
1
Impact Impact
1..*
Loss 1
1 Reduces 1..*
Gain
Relates to 1..* Information System
1..* Security Solution
Fig. 13.8. Concepts involved in Phase 2 of the AORDD security solution trade-o¤ analysis
This is done to enable a relevant comparison of the alternative security solutions. However, no matter which variables are involved when evaluating security solutions against each other, the decision maker needs some type of measurable and relational expression as output from the trade-o¤ analysis in Phase 2. These expressions can be either qualitative or quantitative, provided that they are in a relational form and that they can be directly compared. In the AORDD framework the security solutions are measured in terms of their …tness to the decision criteria and called security solution …tness scores. Figure 13.9 gives an overview of the inputs and outputs of Phase 2 of the AORDD security solution trade-o¤ analysis. The parameters on the left side of the …gure (solution e¤ect, solution cost, misuse frequency and misuse impact) are input parameters, which means that they are the information that is traded o¤. The parameters on the right side of the …gure (security risk acceptance criteria, standards, policies, laws and regulation, priorities, business goals, TTM and budget) are the decision criteria, which in Phase 2 are called the trade-o¤ parameters. The trade-o¤ parameters are the information that is used to trade-o¤ the input parameters. As can be seen in Figure 13.9, the trade-o¤ analysis evaluates alternative solutions by comparing their security solution …tness score. In the …nance and investment domain, alternatives are often measured in terms of Return On Investments (ROI). It would also be preferable to use a similar notion in this work, such as Return on Security Investments (ROSI), but there are no stable de…nition and models for computing ROSI that are commonly accepted within the
13.2 Phase 2: Trade-o¤ analysis
109
Risk level variables Misuse impact Misuse frequency METM MTTM
Trade-off parameters
Security solution variables
Budget
Security solution effect
Security acceptance criteria
Time-To-Market (TTM) Security solution cost
Trade-Off Analysis
Priorities
Security Solution Fitness Score
Fig. 13.9. The input and outputs of Phase 2 of the AORDD security solution trade-o¤ analysis
security domain and those that exist does not cover the necessary factors involved in this work. In this work it is not su¢ cient to only consider the …nancial perspectives, as the …tness score is rather an aggregate of the abilities of a security solution to meet all relevant perspectives. These perspectives are the above mentioned decision criteria and expressed as security requirements and project, development and …nancial perspectives, such as TTM, budget constraints, laws and regulations, policies, etc. However, before the abilities of a security solution can be evaluated, the input variables to the trade-o¤ analaysis, such as the misuse impact and security solution e¤ect, must be estimed. In the AORDD framework misuse impact and security solution e¤ect is measured in terms of their in‡uence on the values of the system assets. Thus, before the input variables to the trade-o¤ analysis can be estimated the system assets must be identi…ed and valued. This is done in sub-process 1 of the AORDD security assessment activity, as discussed in Chapter 11. In the following the relationship between the asset values and the misuse impact and security solution e¤ect is discussed.
110
13. AORDD Security Solution Trade-O¤ Analysis
13.2.1 Identifying and assigning values to assets To estimate the misuse impact and the security solution e¤ect the system assets needs to be identi…ed and assigned values to. This is done as part of the context identi…cation (sub-process 1) in the AORDD security assessment activity and more speci…cally activity 1.4. As it is the stakeholders that assign values to the assets, the relationship between assets and stakeholders and the scope of the assessment also needs to be determined. These issues are all taken care of in sub-process 1 of the AORDD security assessment activity. Sub-process 1: Context identi…cation – Activity 1.1: Identify purpose and scope of assessment – Activity 1.2: Describe the target of evaluation (ToE), business perspectives and the security environment – Activity 1.3: Identify system stakeholders – Activity 1.4: Identify assets and have stakeholders assign values to assets – Activity 1.5: Describe the asset-stakeholder graph – Activity 1.6: Describe relevant security policies (SP) – Activity 1.7: Identify and describe the security risk acceptance criteria (SAC) Assets relate to the ToE and the ToE is parts of or the complete information system that is being assessed. Note that a ToE can include anything from hardware to humans. However, in this context assets are entities that are of security interest, meaning that some stakeholder is interested in that the con…dentiality, integrity, availability, authenticity, accountability, non-repudiation or reliability attributes of the entity is preserved at a particular level. This level refers to the desired asset value. To simplify the asset valuation the AORDD framework provides asset categories and some asset valuation guidelines. The asset categories in the AORDD framework are modi…ed from CRAMM to …t the AORDD security solution trade-o¤ analysis and includes the following: personal safety, personal information, company information, legal and regulatory obligations, law enforcement, commercial and …nancial interest, company reputation, business strategy, business goals, budget, physical, data and information, organisational aspects, software and other. Below is a short description of each asset category, along with some examples of each. More details are in the CRAMM toolkit (information can be found at http://www.cramm.com) and the CRAMM user guide [103]. Personal safety assets are entities that a¤ect the well-being of humans. Examples of such include applications that handles medical records, such as a Telemedicine
13.2 Phase 2: Trade-o¤ analysis
111
system that either transfers, stores or processes sensitive medical information, air tra¢ c control applications etc. Personal information assets are pieces of information in the ToE that one or more stakeholders consider to be of a private or sensitive character. Examples of such include salary, age, health-related information, bank account number, liquidity and other similar types of information. Company information assets are pieces of information in the ToE that a company considers to be sensitive and of a company con…dential character. Examples of such includes user credentials for accessing business critical systems such as username and passwords, business results that are not public, liquidity and other similar types of information. Legal and regulatory obligations assets are entities that are a¤ected or controlled by legal and regulatory body. Examples of such are the tra¢ c information in a Telecommunication network in Norway, which is regulated by Ekomloven and controlled by Post- og Teletilsynet. Law enforcement assets are entities that is a¤ected or regulated by law. Examples of such are the EU data retention directive (2006/24/EC) [28], which enforces retention of tra¢ c and subscriber data for Police crime investigations for Telecommunication providers. The Directive determines the date when all affected providers of services, as speci…ed in the Directive, must provide a solution that meets the requirements stated in the Directive. In this case both the information systems involved and the information stored, by these systems might be considered as assets. Commercial and …nancial interest assets are entities that are of value to ensure the …nancial stability of a company. Examples of such include stock exchange related information, quarterly results before they are public etc. Company reputation assets are entities that might lead to a reduction in the company reputation if they are revealed to unauthorised parties. Examples of such include security incident reports, information on identity theft from their customer database, etc. Business strategy assets are entities that in some way are critical for the day to day execution and maintenance of the business strategy. Examples of such includes business process descriptions, internal control etc. Business goals assets are entities that in some way are critical for the achievement of the business goals. This is di¤erent from the business strategy in that the goal is the description of what the company strives to achieve in short and longterm while the business strategy is the tool used to achieve the business goals. Examples of such include business goal description of various types.
112
13. AORDD Security Solution Trade-O¤ Analysis
Budget assets are entities that in some way are related to the budget of a company or speci…c parts of a company. Examples include any information used to derive the budget for the di¤erent parts of a company, details on the budget process etc. Physical assets are entities that represent physical infrastructure that the company owns or in some way have at their disposal. Examples include buildings, servers, routers, workstations, network cables etc. Data and information assets are entities in the data and information set contained or controlled by a company with some value to one or more stakeholders. Examples include identities of the customers, information on which products customers have procured and when, health-related information, billing information etc. Organisational aspects assets are entities that in some way denote or represent the how, who, when and why for an organisation and that are of some value to one or more stakeholders. Examples of such are the structure of an organisation, issues related to restructuring of the organisation, the day to day work processes in the organisation etc. Software assets are entities that are contained in the software portfolio of a company. Examples of such are domain speci…c applications, software licenses, inhouse code and components etc. The asset category ‘other’ covers all entities that have some value to one or more stakeholders and that are not naturally contained in the above mentioned categories. Examples of such could be entities that are comprised of two or more asset categories. For more information on assets and how to specify and group assets, the reader is referred to CRAMM [103] and CORAS [20]. Some details on how to value assets is given in the following. Asset valuation and asset valuation categories. For all asset categories in the AORDD framework, the asset valuation is given according to the seven security attributes con…dentiality, integrity, availability, authenticity, accountability, non-repudiation and reliability. Hence, the asset value for each asset are derived by summing over all values for all security attributes.
7 X AV j = av i
(13.5)
i=1
where AV is the asset value for asset number j, avi is the security attribute value for security attribute number i and i denotes the security attribute for which the value is given for.
13.2 Phase 2: Trade-o¤ analysis
113
Table 13.1. Example asset value table Asset Value
Commercial and Economic Interests
1
Of interest to a competitor but of no commercial value
2
Of interest to a competitor with a value of NOK10,000 or less
3
Of value to a competitor of the size NOK10,001 to NOK100,000
4
Of value to a competitor of the size NOK100,001 to NOK1,000,000
5
Of value to a competitor of the size NOK1,000,001 to NOK10,000,000
6
Of value to a competitor of the size more than NOK 10,000,000
7
Could substantially undermine economic and commercial interests
8
No entry
9
Would be likely to cause substantial material damage to economic and commercial interests
10
Would be likely to cause severe long-term damage to the economy of the company
It is the stakeholders of a ToE that assigns the values to the ToE assets. This task is however sometimes di¢ cult to perform in practice. To make the asset valuation feasible for the stakeholders the AORDD framework allows the stakeholder to interpret the asset value as: the degree of importance that the preservation of each of the security attributes has for a particular asset. To further assist the stakeholder, the AORDD framework has adopted two asset valuation schemes: (1) asset values on the scale 1-10 and (2) asset values on the qualitative scale {low, medium, high}. The …rst is the asset valuation scheme used in CRAMM, only modi…ed to …t the AORDD framework. Table 13.1 shows a modi…ed version of the CRAMM asset valuation table for the asset category ‘Commercial and economic interests’. More details are given in the CRAMM toolkit and CRAMM user guide [103]. Type 2 asset valuation schema involves valuing an asset in relation to a qualitative scale. An example of such is when each stakeholder assigns a qualitative value for each security attribute according to an appropriate qualitative scale, such as for
114
13. AORDD Security Solution Trade-O¤ Analysis
Table 13.2. Example of qualitative scale evaluation Name
Value
Stakeholder
x
Stakeholder category
Decision-maker
Asset
password
Asset category
Data and information
Asset value con…dentiality
high
Asset value integrity
medium
Asset value availability
low
Asset value authenticity
N/A
Asset value accountability
N/A
Asset value non-repudiation
low
Asset value reliability
N/A
example {low, medium, high}. Table 13.2 shows an example of a qualitative scale type valuation for Stakeholder x. As can be seen in the table stakeholders are also assigned to stakeholder categories. This is done to ease the risk evaluation activities in the risk-driven analysis of Phase 1 of the following development iterations. Recall that Phase 1 of the AORDD security solution trade-o¤ analysis deals with prioritising security risks. Recall also that the AORDD process is iterative, which means that several iterations of the activities involved in Phase 1 and Phase 2 is usually undertaken during a development using the AORDD process, as described in Chapter 11. The result of the asset valuation activity is a set of tables like Table 13.2 for each stakeholder. As the asset values are not always given as quantitative values and as there often are more than one stakeholder involved in the asset valuation, Equation 13.5 can often not be directly applied to derive the asset value for an asset. Thus, the sets of tables must be aggregated for each asset over all stakeholders. In the AORDD framework a simple asset value aggregation schema where set by set of asset values from the stakeholder are inserted and combined by taking the arithmetic average for quantitative asset values or the median for qualitative asset values is used, as illustrated in Figure 13.10. The result is one asset value table, which is a composite of the aggregated asset values from the set of stakeholders involved. In addition, the stakeholders may have di¤erent trustworthiness associated with them. This is discussed further in the presentation of the trade-o¤ tool in Chapter 15 and the trust-based information aggregation schema described in Part 5.
13.2 Phase 2: Trade-o¤ analysis Personal safety Personal information Legal and regulatory obligations Company reputation Business strategy Organisational aspects
115
Company information Law enforcement
Commercial and economical interest Business goals Software
Budget
Physical
Data and information
Other
Asset Value Table
Fig. 13.10. Asset value table as a composite of the 15 asset valuation categories (sub variables)
13.2.2 Misuse impact and security solution e¤ect and their relation to asset value Misuse impact and security solution e¤ect is measured using the same scale as the valuation scale used for valuing the assets that these a¤ect. If the same scale is not used either the asset value or the misuse impact and the security solution e¤ect value must be transformed so that they can be compared. However, the reader should be aware of the problems involved in transforming values into a scale di¤erent from their original one. Figure 13.11 illustrates the 15 misuse impact categories. As for asset valuation two types of misuse impact scales are used and these are (1) quantitative scale from 1-10 in terms of seriousness and (2) the qualitative scale {low, medium, high}. In the trade-o¤ tool discussed in Chapter 15 misuse impact is represented as a value with the 15 misuse impact categories as sub-variables where all can be in either the state {low, medium, high} or a number in the range [1; 10]. As can be seen in Figure 13.11, the set of misuse impact sub-variable is aggregated into the misuse impact table. This aggregation is done for each asset that the misuse has an impact on. The resulting misuse impact is then aggregated with the original asset values for each a¤ected asset to derive the updated asset value, as illustrated in Figure 13.12. The aggregation technique used depends on the type of values given. If the asset value and misuse impact are given according a
116
13. AORDD Security Solution Trade-O¤ Analysis Commercial and economical interest Law enforcement Company reputation Legal and regulatory obligations Other Business strategy Business goals Company information Budget Personal information Physical Personal safety Organisational aspects
Data and information Software
Fig. 13.11. The 15 misuse impact sub variables and how to aggregate these into the misuse impact table
qualitative scale the rule is such that the lowest value of the two becomes the resulting asset value. For example, if the original asset value is ‘medium’and the misuse impact is ‘low’the result is a decrease in the asset value from ‘medium’ to ‘low’. If the quantitative scale is used the arithmetic average is used as the aggregation technique. Security solutions are introduced to prevent, reduce or detect and act on the potential decrease in asset value caused by a misuse. These solutions protect the assets of the ToE by either preventing the associated security threat, by removing the vulnerability that the security threat exploits or by doing a combination of preventing and removing so that the impact of a potential misuse is reduced to an acceptable level. The e¤ects of these security solutions are therefore measured in terms of regaining the asset value. Figure 13.13 shows the 15 security solution impact sub-variables and how these are aggregated into the security solution e¤ect table. The aggregation of the solution e¤ect sub-variables is performed in the same way as for the misuse impact sub-variables. The asset value reduction caused by the misuse impact brings the asset value to an unacceptable level and a security solution needs to be employed to bring the asset value back to an acceptable level. This is done by applying the values in the security solution e¤ect table on the updated asset value table from Figure 13.12. The result is an reupdated asset value table, as shown in Figure 13.14.
13.2 Phase 2: Trade-o¤ analysis Personal safety Personal information Legal and regulatory obligations Company reputation Business strategy Organisational aspects
117
Company information Law enforcement
Commercial and economical interest Business goals Software
Budget
Physical
Data and information
Commercial and economical interest
Law enforcement Company reputation
Physical
Data and information
Software
Legal and regulatory obligations Other Business strategy Business goals Company information Budget
Personal information
Personal safety
Updated Asset Value Table
Organisational aspects
Asset Value Table
Other
Fig. 13.12. The relation between misuse impacts, the original asset values and the resulting updated asset value table
13.2.3 Misuse and security solution costs Misuse cost is usually harder to estimate than security solution costs as it is often easier to see the potential costs of alternative solutions than to estimate the potential cost if a misuse occurred. A security solution has a procurement cost, licence cost and maintenance cost while misuses often have costs outside of what is obvious and a¤ects the resource usage to a larger degree than an controlled introduction of a security solution. This work has not examined factors in‡uencing the misuse cost in detail and have adopted the simplistic version of misuse cost estimation approach described in Sonnenreicht et al. (2006) [93]. In the AORDD framework misuse costs are measured in terms of one cost variable, namely productivity while security solution cost is measured using the four
118
13. AORDD Security Solution Trade-O¤ Analysis Commercial and economical interest Law enforcement Company reputation Legal and regulatory obligations Other Business strategy Business goals Company information Budget Personal information Physical Personal safety Organisational aspects
Data and information Software
Fig. 13.13. The 15 security solution e¤ect sub variables and how to aggregate these into the security solution e¤ect table
cost variables: procurement, employment, maintenance and productivity. Procurement cost covers all expenses related to procuring a security solution and involves the initial price for the security solution, cost associated with the necessary software licences, cost of regular software updates, cost of support agreement etc. Employment cost targets the phase between procurement and the normal operation of the security solution and covers all factors related to installing and product clearance of the security solution. This includes time, resources and budget necessary for tailoring the security solution to the ToE and its security environment. Maintenance cost targets the phase after the security solution is completely employed in its operational environment and until it is taken out of production. This means that this cost category covers the day-to-day operation and maintenance and includes costs such as the resources needed for maintenance, expected time that the system need to be down or run with reduced capabilities due to regular updates etc. Productivity is measured as described in Sonnenreicht et al. (2006) [93] and targets the extra hassle that comes as a result of either the occurrence of a misuse or the introduction of a security solution. As done in [93] the estimation of the time and thus money spent on reduced productivity is measured using a set of categories that are combined into misuse cost and security solution cost respectively. For misuse costs the following categories are supported in the AORDD framework:
13.2 Phase 2: Trade-o¤ analysis Personal safety Personal information Legal and regulatory obligations Company reputation Business strategy Organisational aspects
Company information Law enforcement
Commercial and economical interest Business goals Budget Software
Software
Data and information Personal safety
Organisational aspects
Legal and regulatory obligations Other Business strategy Business goals Company information Budget Personal information Physical
Commercial and economical interest
Law enforcement Company reputation
Physical
Data and information
Software
Legal and regulatory obligations Other Business strategy Business goals Budget Company information
Personal information
Personal safety
Updated Asset Value Table
Other
Organisational aspects
Commercial and economical interest
Physical
Data and information
Asset Value Table
Law enforcement Company reputation
119
Re-updated Asset Value Table
Fig. 13.14. The relation between asset value, misuse impact and security solution e¤ect
Application and system related crashes Email …ltering sorting and spam Bandwidth e¢ ciency and throughput Ine¢ cient and ine¤ective security policies Enforcement of security policies System related rollouts and upgrades from IT Security patches for OS and applications Insecure and ine¢ cient network topology Virus and virus scanning Worms
120
13. AORDD Security Solution Trade-O¤ Analysis
Trojan horses and key logging Spyware and system trackers Popups Compatibility issues (hardware and software) Permission based security problems (e.g. usernames and passwords) File system disorganisation Corrupt or inaccessible data Hacked or stolen system information and data Backup and restore Application usage issues For security solutions the following cost categories are supported in the AORDD framework: Application and system related crashes Bandwidth e¢ ciency and throughput Over-restrictive security policies Enforcement of security policies System related rollouts and upgrades from IT Security patches for OS and applications Trouble downloading …les due to virus scanning Compatibility issues (Hardware and Software) Too many passwords or other permission security problems For each of these categories an estimate of the time spent related to either a misuse or a security solution needs to be estimated. As it might be di¢ cult to estimate the time as a quantitative value both cost values can be estimated both quantitatively and qualitatively. This is the same as for misuse impact and security solution e¤ect and thus the same aggregation techniques apply.
14. Structure of the AORDD Security Solution Trade-O¤ Analysis
The structure of the underlying trade-o¤ analysis method and procedure for the AORDD security solution trade-o¤ analysis are such that they are easy to tailor, change and maintain. This ‡exibility is necessary to easily incorporate any updates from experience gained during the use of the AORDD security solution trade-o¤ analysis. To ensure the required level of ‡exibility, the trade-o¤ analysis method and procedure are built as a set of replaceable sub-components grouped into levels that are linked together through interfaces in such a way that the content of each level is independent of each other provided that the required output is delivered accordingly. This means that components can be changed independently of each other while interfaces are dependent on the outputs provided from the lower level and the inputs required by the higher level and thus are dependent on these two types of information. For example, a component in one of the layers of the trade-o¤ method can be replaced without having to update other parts of the method provided that no interfaces are changed, but if an interface is changed, all components associated with the interface might be a¤ected. Figure 14.1 illustrates the component-wise and hierarchical step-by-step structure of the underlying trade-o¤ method of Phase 2 of the AORDD security solution trade-o¤ analysis. The structure consists of four levels and follows the seven step trade-o¤ procedure described below. The AND gates in Figure 14.1 mean that all information coming in at the incoming arches are combined. The outgoing arches from an AND gate carries the result of the combination of the incoming information to the next level in the analysis. Each of the squares in Figure 14.1 represents a set of information, such as the set of information that contributes to the static security level. As the trade-o¤ tool directly implements the structure of the trade-o¤ analysis as shown in Figure 14.1 details of the content of each component and how information are AND-combined are described in relation to the trade-o¤ tool in Chapter 15. The seven step trade-o¤ procedure is as follows. Step 1: Estimate the input parameters in the set I where I = fM I; M F; M T T M; M ET M; M C; SE; SCg and M I is misuse impact, M F
122
14. Structure of the Trade-O¤ Analysis Static Security Level
Risk Level
Level 1
AND
“Current” Security Level
Solution Treatment Level
Level 2
AND
Trade-Off Parameters
Treatment Effect and Cost
Level 3
AND
Security Solution Fitness Score
Level 4
Fig. 14.1. Overview of the structure and the step by step procedure of the trade-o¤ analysis
is misuse frequency, M T T M is mean time to misuse, M ET M is mean e¤ort to misuse, M C is misuse cost, SE is security solution e¤ect and SC is security solution cost. The output from Phase 1 of the trade-o¤ analysis is a set of security risks in need of treatment. A security risk is a composite of misuse, misuse frequency, misuse impact, MTTM and METM and a particular security risk is the unique combination of exactly one misuse, one misuse frequency, one misuse impact, one MTTM and one METM. The misuse cost denotes the …nancial and other costs that comes as a direct or indirect consequence of the misuse and is handled separate from the other misuse variables. The security solution e¤ect and cost are derived in activities 5.1 and 5.2 of the AORDD security assessment activity and are part of Phase 2 of the AORDD security solution trade-o¤ analysis, as described in Section 13.2.
14. Structure of the Trade-O¤ Analysis
123
Step 2: Estimate the static security level by examining the relevant factors from the development of the ToE according to the security assurance components in Common Criteria Part 3 and the asset values of the involved ToE assets as described in Section 13.2.1. Note that it is the assurance components in Common Criteria Part 3 that is used and not the security functional components of Common Criteria Part 2. Recall that Common Criteria Part 2 and Part 3 are independent and that Part 2 contains classes of security functional components that address di¤erent factors of applying proper security functions to a system. Hence, this part provides support for the selection and composition of security solutions in a system. Common Criteria Part 3 however describes a set of classes of security assurance components that are used by an evaluator in a Common Criteria evaluation to establish the necessary con…dence in the security level of a system. This is done through examining the resulting ToE or ToE design and the development documentation provided by the developer. This is the same strategy for evaluating software quality as is used in the safety standards IEC 61508 Functional Safety of Electrical/Electronic/Programmable Electronic (E/E/PE) Safety-Related Systems [51] and DO-178B: Software Considerations in Airborne Systems and Equipment Certi…cation [89]. Similarly to the Common Criteria these two standards determine the quality of the end-product by examining the activities involved in the development. As standards tend to neither be easily accessible nor easy to interpret and employ in practice tools and methodology support are often helpful. An example of such for DO-178B is given in Gran (2002) [40], which describes a BBN topology for safety assessment of software based systems to support the DO-178B evaluation approach. Step 3: Estimate the operational risk level using appropriate security assessment methods and models such as the availability prediction model described in Houmb, Georg, France, Reddy and Bieman (2005) [43]. This prediction model is tailored for estimating the level of availability for an information system or ToE but is applicable for estimating other security attributes as well. In the trade-o¤ analysis method, the prediction model is extended to include variables related to Common Criteria Part 2, such as attacker abilities, in addition to METM, MTTM, MF and MI. Figure 14.2 shows the variables involved when estimating the risk level of a ToE in the trade-o¤ analysis method for the AORDD security solution trade-o¤ analysis. As can be seen in Figure 14.2 the operational risk level is derived by combining the existing security controls according to the recommendations in Common Criteria Part 2, the security risks identi…ed in the risk-driven analysis of Phase 1 of the AORDD security solution trade-o¤ analysis and the operational security level as described in Littlewood et al. (1993) [74]. It is important to note however that the main factor that separates the operational risk level from the static security
124
14. Structure of the Trade-O¤ Analysis Risk Level
Security risks
Misuse scenario
Misuse frequency
Existing Safeguards
Misuse impact
Operational security level
MTTM
Attacker motivation and motive
METM
Attacker resources
Attacker abilities
Attacker skills
Fig. 14.2. Variables involved in estimating the risk level of a ToE in the trade-o¤ analysis method
level in the trade-o¤ analysis method is that the static security level expresses the risk level associated with the development activities while the operational risk level expresses the security level of the ToE and its security environment in its operational environment. Thus, the static security level makes use of the idea of quality through development activities while the risk level targets the security level of the end-product employed in its security environment. Note that both future events and current events relevant for the operational risk level can be estimated when the subjectivistic approach is applied. Details on the subjectivistic approach is given in Chapter 7. The operational security measures included in the trade-o¤ analysis method are the Mean Time To Misuse (MTTM), the Mean E¤ort To Misuse (METM) and the attacker abilities. MTTM denotes the mean calendar time between successful misuses (security breaches) while METM denotes the mean calendar time that an attacker needs to invest in order to perform a misuse. Here, the attacker e¤ort depends on the abilities of the attacker, such as the attacker skills (novice, standard, expert) and the resources availability to the attacker. Hence, METM is dependent on the attacker abilities. MTTM and METM are estimated according to the security adaptation of reliability theory as discussed in Littlewood et al. (1993) [74]. The operational risk level also depends on the security functional components already employed in the ToE and the ToE security environment. In the trade-o¤
14. Structure of the Trade-O¤ Analysis
MC
MCn SC
125
SC
Fig. 14.3. The relation between misuse cost and security solution cost in the trade-o¤ analysis method
analysis method this is covered by the security functional component classes of Common Criteria Part 2, which includes Security Audit (FAU), Communication (FCO), Cryptographic Support (FCS), User Data Protection (FDP), Identi…cation and Authentication (FIA), Security Management (FMT), Privacy (FPR), Protection of the TSF (FPT), Resource Utilisation (FRU), TOE Access (FTA) and Trusted Path/Channels (FTP). Step 4: Estimate the security solution treatment level. The treatment level of a security solution is the composite of the security solution e¤ect and security solution cost. In the trade-o¤ analysis method, the security solution e¤ect is evaluated against the misuse frequency and impact while the resulting cost after employing the security solution in the ToE and/or the ToE security environment is computed by updating the misuse costs taking the security solution cost into mind, as illustrated in Figure 14.3. Step 5: Estimate the trade-o¤ parameters in the set T where T = fSAC; P OL; ST A; LR; BG; T T M; BU; P RIg and SAC is security acceptance criteria, P OL is policies, ST A is standards, LR is law and regulation, BG is business goal, T T M is time-to-market, BU is budget and P RI is priorities. As for the other variables involved in the trade-o¤ analysis method, there are also di¢ culties involved in estimating some of the trade-o¤ parameters. The two trade-o¤ parameters that should be straightforward to estimate are the budget and TTM. These two pieces of information should be as concrete as possible and can usually be derived from the development plan, schedule and budget and modelled either as a discrete value or as a probability distribution, dependent on the operational risk level and the security solution treatment level derived in Step 3 and 4 respectively. Security acceptance criteria are part of the context identi…cation of the AORDD security assessment activity. However, such criteria are often di¢ cult to assign during the early stages of a security assessment activity. Stakeholders often …nd it easier to relate to what is an acceptable and unacceptable risk when the list of
126
14. Structure of the Trade-O¤ Analysis
misuses and the security risks that these lead to becomes clearer. This risk picture seems to be a suitable abstraction level for stakeholders to relate to and hence, the stakeholders should be given the ability to express the security acceptance criteria also at the later stages in a security assessment activity. Policies cover any kind of relevant policies associated with the involved organisation(s). The current assumption in the trade-o¤ analysis method is that the relevant policies are security policies and that these are clearly speci…ed in terms of tge required level of con…dentiality, integrity, availability, authenticity, accountability, non-repudiation and reliability. As this is often not the case, the existing policies must be interpreted so that they can be expressed as required levels of each of the security attributes. This is done so these can be directly usable in the trade-o¤ analysis method. When several organisations are involved and/or several stakeholders are concerned with the same assets, policy statements across the organisations might con‡ict. In such cases, the con‡ict must be resolved as part of the trade-o¤ analysis. A practical trick in such cases is to rank stakeholder interest and use the resulting ranked list to negotiate the policy con‡ict. Laws and regulations include any relevant legal aspect that a¤ects the ToE or the ToE security environment. Examples of such are the EU directive on data retention (2006/24/EC) [28], which a¤ects all systems storing or processing traf…c data in the telecommunication domain, the Privacy directive [27] and the Personopplysningsloven (act relating to the processing of personal data) in Norway. As for policies, the relevant perspectives of the laws and regulations need to be expressed in terms of required level of con…dentiality, integrity, availability, authenticity, accountability, non-repudiation and reliability. Standards cover any security or other relevant standards that the ToE needs to comply with. Examples of such are the EALs in the Common Criteria and the security integrity levels (SIL) in IEC 61508 Functional safety of electical/electronic/programmable electronic safety-related systems. As for the policies and laws and regulations, standards need to be expressed in terms of required level of con…dentiality, integrity, availability, authenticity, accountability, nonrepudiation and reliability. Business goals are usually a bit more fuzzy than the above-mentioned trade-o¤ parameters. The reason for this is that many organisations do not have a clear goal for their security work. The security goal is often formulated in a highly abstract manner regarding how to ensure that the organisation’s information system is secure enough. Since being secure is a relative term, the trade-o¤ analysis requires precise formulations of the security goals of the involved organisations. Hence, the business goals for the security work must be expressed as aims to achieve a certain level of con…dentiality, integrity, availability, authenticity, accountability, non-repudiation and reliability.
14. Structure of the Trade-O¤ Analysis
127
The last trade-o¤ parameter in the set T is priorities. Priorities di¤er from the other trade-o¤ parameters in that it does not measure security in some way but rather provide a prioritised list of the requirements formulated by the other tradeo¤ parameters. Priorities are included to explicitly model the importance rank of each parameter in relation to the others. Hence, priorities contain a priority list of the other trade-o¤ parameters in the set T . Step 6: Derive security solution …tness score for the security solution by: (1) Derive the security level by combining the static security level and the risk level. (2) Evaluate the treatment level of the security solution. (3) Derive the treatment e¤ect of the security level from (1), by applying the result from (2), with the security level from (1). (4) Derive the treatment cost and e¤ect by examining the relative return on security solution investment, by comparing the relative di¤erence in security solution cost and misuse cost, in relation with the e¤ect that the security solution has on the misuse impact and frequency. (5) Compute security solution …tness score by evaluating the result of (4), using the set of trade-o¤ parameters. Step 7: Evaluate …tness score for each security solution against the other alternative security solutions in the set A of alternative security solutions. The aim of this step is to compare the …tness score for the alternative security solutions and identify the best-…tted security solution(s). In cases where the aim is to identify the overall best set of security solutions all involved security solutions need to be grouped into solution sets and the …tness score of these solution sets need to be compared.
15. The Trade-O¤ Tool
Phase 2 of the AORDD security solution trade-o¤ analysis is implemented as a BBN topology and called the trade-o¤ tool. BBN is chosen as the implementation language as it sophisticatedly handles large scale conditional probabilities and has, through practical application, proven to be a powerful technique for reasoning under uncertainty. The notion trade-o¤ analysis topology implies that the trade-o¤ tool is split into a set of Bayesian networks that interacts. Thus, the requirement for separation of concerns and independent levels with clear interfaces are achieved, as described in Chapter 14. Furthermore, the BBN topology also follows the trade-o¤ procedure described in Chapter 14. This means that the trade-o¤ tool can easily evolve as experience is gained and that it is easy to tailor the trade-o¤ tool to a particular context, such as making a company speci…c trade-o¤ tool version. Figure 15.1 shows the top-level network of the BBN topology of the trade-o¤ tool. The topology consists of four levels and follows the structure of the tradeo¤ analysis method and the step-wise trade-o¤ procedure described in Chapter 14. As can be seen in the …gure level 1 from the trade-o¤ analysis method structure is employed as the SSLE and RL nodes with associated subnets. Subnets are connected to the parent network through output nodes in the subnet and corresponding input nodes in the parent network. The latter are modelled as dotted line ovals in Figure 15.1 where the SSLE input node receives information from the associated SSLE subnet, the RL input node receives information from the associated RL subnet, etc. Subnets are generally a re…nement of an input node and models the details of the nodes containing sub-variables and the internal relations of these sub-variables. It is this hierarchy of subnets, with output nodes and parent networks with input nodes, that enable the propagation of information and evidence through the topology. Information and evidence are inserted into the observable nodes in the subnets and propagated through the output nodes in the subnets to the input nodes in the higher level networks. Hence, information or evidence are usually not inserted directly into the input node of the parent network. However, as all
130
15. The Trade-O¤ Tool
Fig. 15.1. The top-level network of the trade-o¤ tool BBN topology
networks in the BBN topology are self-su¢ cient evidence and information can be inserted at any level in the topology, provided that the level of abstraction is appropriate. Level 2 in the trade-o¤ analysis method is employed as the ‘security level’ and SSTL nodes in the top-level network. As can be seen in Figure 15.1 the SSTL node is a subnet while the security level node is a stochastic intermediate node. Being an intermediate node means that states of the variables of the security level node are dependent on the state of the variables in the two subnets SSLE and RL. In practice this means that before any security solutions are employed the security level of a ToE is derived by examining the risk level of the ToE and the existing safeguards in the ToE. The SSTL subnet models the sub-variables and their internal relations for the input node SSTL. As for the SSLE and RL subnet the SSTL subnet is connected to the top-level BBN by the corresponding output and input nodes. The SSTL subnet contains a set of sub variables used to determine the treatment level of a security solution. Level 3 in the trade-o¤ analysis method is employed by the subnet TOP, the stochastic intermediate node ‘treatment e¤ects and costs’and the two input nodes BU and TTM. The stochastic intermediate node ‘treatment e¤ect and cost’takes input from the SSTL subnet through the input node SSTL and the intermediate stochastic node ‘security level’ and computes the relative treatment e¤ect and cost for a particular security solution or set of security solutions. The relative treatment e¤ect and cost is measured in terms of how e¤ective the security so-
15.1 SSLE subnet
131
lution or security solution set treats the risk level of the ToE in relation to the associated costs of procuring and employing the security solution. The TOP subnet contains the trade-o¤ parameters and models the relations between the involved trade-o¤ parameters. It is these parameters that are used to trade-o¤ the security solutions against each other and thus used to determine how to rate a security solution. Nodes BU and TTM are part of the TOP subnet as well as being input nodes in the top-level network. The reason for separating these two trade-o¤ parameters and modelling them explicitly in the top-level network is that they are of particular importance when determining the …tness score of a security solution and thus needs to be linked directly into the …tness score utility function in level 4 of the trade-o¤ analysis method described in Chapter 14. Level 4 in the trade-o¤ analysis method is employed by the utility node ‘Fitness score utility’and the decision node ‘Fitness score’. The …tness score decision node is the target node of the network. This means that this node at all times holds the current …tness score of the security solution being evaluated. Details of how the trade-o¤ procedure is employed in the trade-o¤ tool are described and demonstrated using an example case study of the trade-o¤ tool in Section 18.1.
15.1 SSLE subnet In the trade-o¤ tool, the static security level is separate from the operational risk level of the ToE. The main reason for this separation of concern is to easy the evolving and maintenance of the trade-o¤ tool. Figure 15.2 shows the static security level (SSLE) subnet. The SSLE is the re…nement of the SSLE input node in the top-level network and hence feeds information into the SSLE input node in Figure 15.1. The concept ‘static’in this context refers to the fact that it denotes the security level of the system before any security risks and security solutions are taken into consideration. Hence, the static security level denotes the “original” security level. The SSLE subnet consists of two parts and these are: (1) The security assurance components of Common Criteria Part 3 and (2) Asset value. Part 3 of the Common Criteria contains sets of security assurance components and describes general development factors that in‡uence the quality of a system. To ease the security evaluation according to the Common Critera the security assurance components are grouped together into Evaluation Assurance Levels (EAL), as described in Chapter 4. Recall that the Common Criteria consist of four parts where Part
132
15. The Trade-O¤ Tool
Fig. 15.2. SSLE subnet
1 gives the general model for security evaluation, Part 2 contains the security functional components, Part 3 contains the security assurance components and Part 4 is the Common Evaluation Methodology (CEM), which gives evaluation guidelines to assist the Common Criteria evaluator. This is according to other relevant software and safety quality evaluation standards and best practices, such as IEC 61508, DO-178B and Capability Maturity Model (CMM). The SSLE subnet includes six of the assurance classes from Common Criteria Part 3. These are development (ADV), guidance documents (ADG), life cycle support (ACL), tests (ATE), vulnerability assessment (AVA) and composition (ACO). Part 3 has two additional classes: the Protection Pro…le Evaluation class (APE) and the security target evaluation class (ASE), but these are not included in the subnet as only the general development factors are relevant for Phase 2 of the AORDD security solution trade-o¤ analysis. Furthermore, Common Criteria Parts 3 consists of the four levels: classes, families, components and elements. Classes are used for the most general grouping of assurance components that share a common general focus. Families are groupings of components that share a more speci…c focus but that usually di¤er in emphasis or rigour. Components are atomic entities with a speci…c purpose that are constructed from individual elements. An element is the lowest level expression of requirements to be met in the evaluation, see [15] for details. The structure of the SSLE subnet follows the structure of Common Criteria Part 3 and thus has
15.1 SSLE subnet
133
four levels. As can be seen in Figure 15.2 each of the assurance classes included in the SSLE subnet are input nodes with associated subnets and each of these subnets have four levels. Level one is the SSLE subnet and includes the assurance classes. The other three layers for each assurance class models assurance families, assurance components and assurance elements respectively. In the following the focus is put on level 1. As discussed in Chapter 4 security evaluation according to the Common Criteria is about establishing con…dence in the quality of the end-product, here measured as the security level, through observing development factors. In the trade-o¤ analysis in Phase 2 of the AORDD security solution trade-o¤ analysis this con…dence level is measured using the three states: low, medium and high. This means that all nodes in the Common Criteria part of the SSLE subnet have these three states where the value of these states refer to the level of con…dence in the quality for the associated node. As all these nodes are stochastic variables the value of the states are expressed using probability distributions of the subjective belief of the evaluator or other experts assessing the development factors. Note that evidence or information can be inserted directly into the Common Criteria assurance input nodes if such information is available. However, as each of the Common Criteria assurance nodes are subnets that follow the guidelines of Common Criteria Part 3 the general recommendation is to insert evidence at the element or component level. The propagation of evidence and information in the Common Criteria assurance part of the SSLE subnet follows the guidelines for the EALs as given in Common Criteria Part 3. This means that the relationship between the variables within each subnet in each level of the Common Criteria assurance part is modelled to re‡ect the recommendations for the assurance components for each EAL. In the trade-o¤ tool this means that the trade-o¤ analysis method models the internal relations between the assurance components. This is done to re‡ect that an EAL has a list of assurance components from each assurance family that should be included. Note that the actual information propagation still is probabilistic and performed using the Hugin propagation algorithm contained in the HUGIN tool for the trade-o¤ tool. To simplify the model each involved node re‡ecting information that should be included in a particular EAL needs to be in the ‘high’ state with a probability of < 0:8 for it to be ful…lled. There are no requirements for the ‘low’ and ‘medium’ states. These rules are captured in the ‘CC EAL utility’ node in the SSLE subnet. The decision on which EAL the ToE might con…rm to, is determined by the rules modelled in the CC EAL utility node. Note that the use of the wording “might con…rm to”, as the aim is not to replace the Common Criteria evaluations but rather to incorporate the best practice and guidelines contained in the Common Criteria.
134
15. The Trade-O¤ Tool
The asset value node in the SSLE subnet is also an input node and has a subnet associated to it. This input node is used to aggregate the asset values for the assets in the ToE, according to the previously discussed asset valuation categories. More details are given in the following. The computation order for the SSLE subnet is that the Common Criteria assurance part and the asset value subnet are computed independently but before the SSLE decision node as their variables are independent and given as input to the latter. The static security level is then derived by combining the result from these two input nodes. 15.1.1 Aggregating asset value for the ToE in the SSLE subnet Assets and their values is the driving factor in many risk assessment methods, such as CRAMM, the CORAS framework and AS/NZS 4360. It is however not always clear how to perform the actual identi…cation and valuation of the assets. In this work the asset valuation technique of CRAMM is applied on a small scale. The complexity of asset valuation in a security assessment context is that there are multiple stakeholders involved. These stakeholders often have di¤erent and even con‡icting interests and hence there is a need to specify a prioritised list of these interests based on something. In the trade-o¤ analysis method and the trade-o¤ tool that something is an importance weight measuring the relative importance of a particular stakeholder interest in relation to the other stakeholder interest. The the weight assignment approach used is that of CBAM and the reader is referred to CBAM [69] for details. This valuation strategy is however not straightforward in practice as many situations end up in some sort of negotiation where the strongest stakeholder or the stakeholder picking up the bill gets his or her will. It is no di¤erent in the trade-o¤ tool except that the tool includes guidelines about how to measure the interests against each other using the notion of importance weights. Thus, the trade-o¤ tool takes the role of a negotiation tool in such situations. The way this works is that the risk analyst inserts the set of asset values into the trade-o¤ tool to re‡ect the importance weights and propagates the information. The e¤ect of the priorities on the security solution costs and risk level can then be observed and used to guide the asset valuation. This means that if a particular stakeholder interest leads to a high level of risk that requires an expensive security solution the stakeholder might reconsider and decide to take some risks, rather than protecting the asset(s) to the desired level. Figure 15.3 shows the asset value subnet.
15.1 SSLE subnet
135
Fig. 15.3. Asset value subnet
As can be seen in Figure 15.3 the ten asset valuation categories are modelled as observable nodes in the asset value subnet and thus information is inserted directly into these nodes. The stakeholder interest weight is represented by the stakeholder weight node and the stakeholder interest is represented by the combination of asset values given by a particular stakeholder. This means that one asset value con…guration represents one stakeholder interest and that the resulting asset value is an aggregate of all stakeholder interest that are derived in the decision node ‘Asset value’. This also means that the asset values from separate stakeholders should be inserted separately, as the trade-o¤ tool uses the importance weight of each stakeholder to aggregate asset values. This asset aggregation schema is called the importance weight asset aggregation schema and consists of three steps. (1) Determine the importance weight of each stakeholder. (2) Derive stakeholder interest, by computing the asset value and combining the asset value given by a stakeholder with the associated stakeholder importance weight for each stakeholder. (3) Derive the resulting asset value by aggregating the stakeholder interests over all stakeholders. The importance weight asset aggregation schema is executed by inserting one stakeholder interest at a time and then propagating this information to derive the asset value for the ToE for that particular stakeholder. This is done in the utility node ‘Asset value utility’ shown in Figure 15.3 and the resulting asset value for the ToE is output in the decision node ‘Asset value’. Step 3 is achieved by inserting one stakeholder interest at a time and using the asset value utility node to update the asset value for the ToE for each stakeholder interest. Please note that the importance weights are only valid for the context that they are assigned for. The weights are also relative, meaning that each stakeholder is
136
15. The Trade-O¤ Tool ToE internal influence Fault introduction
Application Failure
Operating System Failure
ToE risk level
ToE risk level
Hardware Failure ToE risk level
Environmental influence Fault introduction
ToE behaviour
service request
delivery of service reliability, availability
ToE risk level
ToE and the ToE security environment
Authorised User
Authorised User
service request
denial of service
ToE risk level
confidentiality integrity authenticity accountability non-repudiation
Unauthorised User
Unauthorised User
Fig. 15.4. The ToE risk level or operation security level of a ToE as a result of the environmental (security) and internal (dependability) in‡uence on the ToE
measured in relation to the other involved stakeholders for a particular context. The importance weights thus say nothing about the absolute importance of a stakeholder.
15.2 RL subnet The risk level (RL) subnet is used to derive the operational risk level of the security risks identi…ed. The risk level is also called the operational security level of the ToE and points to the security level of the ToE under operation that are subject to both in‡uence from its internal and external environment. The notion of operational security level was …rst discussed in Littlewood et al. (1993) [74] and describes the situation in a ToE at any point in time, taken all possible in‡uence from the ToE security environment into mind. To illustrate the set of in‡uences and how they a¤ect the system, the AORDD framework has re…ned operational security level into the concept ToE risk level. Figure 15.4 shows the factors that a¤ect the ToE risk level or the operational security level of a ToE. The model is based on the dependability framework in Avizienis et al. (2004) [6] and the integrated framework for security and dependability in Jonsson (1998) [61] and incorporates both security related factors and dependability or reliability factors. Please see Houmb and Sallhammar (2005) [46] for details. Figure 15.5 shows the RL subnet. This subnet provides input to the RL input node in the top-level network of the trade-o¤ tool BBN topology. The relevant in-
15.2 RL subnet
137
Fig. 15.5. RL subnet
formation for the RL subnet is the information used to derive the ToE risk level, as shown in Figure 14.2. These are the security risk concepts misuse frequency (MF) and misuse impact (MI), the existing safeguards, such as the security functional components of Common Criteria Part 2 and the operational security measures METM and MTTM. In addition, misuse cost (MC) is included and used to support the evaluation of relative treatment e¤ect and cost in level 3 of the trade-o¤ analysis method. As can be seen in Figure 15.5 the RL subnet has six observable nodes and three subnets associated to it. The observable nodes are the stochastic nodes MI, METM, MTTM, Attacker motivation, Attacker resources and Attacker skills. The three subnets are: MC, MI and the existing safeguards. The latter subnet will not be described in detail, as a number of methods exist to determine the strength of the existing safeguards in a ToE, such as the Common Criteria. States associated with this node are {low, medium, high}, meaning no safeguards, some safeguards and su¢ cient set of safeguards. MTTM points to the average calendar time that it takes from an attacker initiates the misuse until the misuse is successfully completed. METM points to the average calendar time it takes one attacker to initiate and complete a successful attack. Both these variables depend on the time it takes to mount the attack, the knowledge that the attacker has of the ToE and the abilities of the attacker(s). The latter is modelled as the intermediate node ‘Attacker ability’which has three incoming observable nodes, namely Attacker motivation, Attacker resources and Attacker skills. Misuse frequency (MF) is a qualitative or quantitative measure of the rate of occurrence of a misuse. When qualitative measures are used, they are called
138
15. The Trade-O¤ Tool
Fig. 15.6. Negative and positive misuse impacts
likelihood while a quantitative misuse frequency measure is usually expressed as either the probability of occurrence within a time unit or the number of events per time unit. Information on the frequency is inserted directly into the MF node in the RL subnet as MF is an observable node. More information on the concept of misuse frequency can be found in the CORAS framework, AS/NZS 4360 and the like. Misuse Impact (MI) is measured in terms of asset loss and asset gain. As discussed earlier one misuse can only have either negative or positive impact on one asset but the same misuse can have negative impact on one asset and positive impact on another asset. As for misuse frequency misuse impact can be measured in terms of qualitative and quantitative values. Figure 15.6 shows an example of a risk matrix composed of qualitative misuse impact and misuse frequency scales that covers misuse impact both as asset gain and asset loss. The misuse impact is an aggregate of all its negative and positive impacts on all a¤ected assets in the ToE and/or the ToE security environment. To make it feasible to measure the impact that one misuse has on the asset values in the trade-o¤ tool the misuse impact is categorised according to the asset valuation categories. This means that a negative impact increases the asset value, as the asset values are either given on the ordinal scale [1; 10] where 10 represents the worst case
15.2 RL subnet
139
Fig. 15.7. Misuse impact (MI) subnet
scenario for the asset or according to the qualitative scale {low, medium, high}. Similar, a positive impact moves the asset value one or more steps closer to the value 0 or the state ‘low’. Determining the misuse impact is done by aggregating over all negative and positive impacts. In the trade-o¤ tool this is done through aggregation by inserting one misuse impact at the time, recompiling the misuse impact and then inserting the next misuse impact etc. Figure 13.11 shows the misuse impact subnet. The third input node and subnet in the risk level subnet is the misuse cost (MC) subnet shown in Figure 15.8. Misuse cost is often hard to measure and particularly as a pure …nancial loss, as it is rarely possible to observe the direct link between the misuse and the …nancial perspectives. Often it is evident that there is a cost associated with the misuse but the magnitude of it is not. However, if such information is available it can be inserted directly into the MC node of the risk level subnet. If such information is not available the MC subnet is used to derive the misuse cost. In the MC subnet the cost of a misuse is measured in terms of the three variables: productivity, TTM and budget. Here, productivity includes factors like a stop in normal production for a shorter or longer period, delays in the production, increased hassle and loss of productivity for the end-user. TTM relates to delivery date for the system and is one of the factors that usually a¤ected as a result of a misuse. The cost associated with increased TTM may be hard to estimate and the qualitative scale {low, medium, high} is used to measure this sub variable. The same qualitative scale is used to measure potential increase in the budget and reduction in the productivity where the interpretation is that the misuse leads to a low, medium or high increase in the budget or reduction in the productivity.
140
15. The Trade-O¤ Tool
Fig. 15.8. Misuse cost (MC) subnet
The output node of the MC subnet is the decision node ‘Misuse Cost (MC)’. It is this misuse cost that is propagated through the MC decision node from the RL subnet to the RL node in the top-level network. The states of the decision node equal that of the three observable nodes of the MC subnet and hence the misuse cost can be low, medium or high.
15.3 SSTL subnet The security solution treatment level (SSTL) subnet in Figure 15.9 is the re…nement of the SSTL node in the top-level network of the trade-o¤ tool BBN topology. This subnet contains variables used to determine the treatment level of a security solution. This treatment level is then fed back to the top-level network and used to evaluate the treatment e¤ect and cost of the security solution in relation to the risks level and static security level of the ToE as described earlier. The SSTL subnet follows the same structure as the SSLE and RL subnet and consist of a set of stochastic observable nodes and intermediate nodes, an additional subnet, a decision support utility function node and an output decision node that is connected to the top-level network and hence carries the information from the SSTL subnet to the top-level network in the trade-o¤ tool. As can be seen Figure 15.9 the treatment level of a security solution is determined from the security solution cost (SC) and the security solution e¤ect (SE). Here, the e¤ect of a security solution is measured in terms of its e¤ect on the risk level variables METM, MTTM, MI and MF for the misuse that the security solution is intended to treat. This could be a security risk theme (group of misuses with their
15.3 SSTL subnet
141
Fig. 15.9. SSTL subnet
associated frequency, impact, MTTM and METM, which comprises a security risk), as discussed in the CORAS framework. There are several information sources available for determining the solution e¤ect, such as formal security veri…cation using UMLsec as shown in Houmb et al. (2006) [48] in Appendix B.2 and Houmb et al. (2005) [44] in Appendix B.3. There are also more informal ways of obtaining the information, such as subjective expert judgment. Possible information sources and aggregation techniques for various types of information (both observable and subjective expert judgments) is discussed further in Chapter 16. The states of all nodes involved in determining the solution e¤ect are modelled according to the qualitative scale {low, medium, high}. This means that if the node ‘SE on METM’ is in the state ‘low’ the security solution has a low e¤ect on the mean e¤ort to misuse and is not able to signi…cantly increase the e¤ort needed to complete the misuse. On the other hand, if this node is in the ‘high’ state the security solution signi…cantly increases the mean e¤ort that an attacker must invest to complete and succeed with the misuse and thus makes it more unlikely that the misuse can be completed successfully. The security solution cost (SC) is modelled as an input node with associated subnet in the SSTL subnet. The reason for this is the cost of a security solution may vary from domain to domain and hence are application, system and domain speci…c. Thus, the contained sub-variables contributing to the security solution cost are separated and put into a subnet. This subnet is called the security solution cost subnet and depicted in Figure 15.10. In the trade-o¤ analysis method and the trade-o¤ tool the cost of a security solution is measured as the combination of the four variables: procurement, employment, maintenance and productivity. Here, procurement covers the actual
142
15. The Trade-O¤ Tool
Fig. 15.10. Security solution cost (SC) subnet
cost of purchasing the solution (the price tag on the security solution). Employment costs are the costs related to tailoring the security solution to the particular context and for employing the security solution as part of the ToE and/or the ToE security environment. Maintenance costs cover expenses related to ensuring continuous normal operation of the security solution in the ToE after the solution is employed in the ToE and/or the ToE security environment. These include extra resources to update the security solution or to respond to user requests in relation to the functionality of the security solution. Productivity costs cover the costs related to the hassle that the security solution has on the end-users and their productivity, such as extra time needed to log-in, extra procedures needed to carry out etc. As for security e¤ect the state spaced used for all involved variables is {low, medium, high}. More details are given in the example run of the trade-o¤ tool in Section 18.1.
15.4 TOP subnet The TOP subnet re…nes the trade-o¤ parameter node in the top-level network of the trade-o¤ tool BBN topology. The TOP subnet includes the decision criteria or variables used to trade security solutions o¤ against each other and hence are the variables that model the preferences of the stakeholders or decision maker, such as that the budget being more important than TTM and similar. The tradeo¤ parameters included in the current version of the trade-o¤ tool are priorities, budget, business goals, standards, business strategy, law and regulations, TTM, policies and security risk acceptance criteria. The trade-o¤ parameter ‘priorities’
15.4 TOP subnet
143
Fig. 15.11. TOP subnet
di¤er from the other parameters by receiving input from the others and from that producing a prioritised list of trade-o¤ parameters. Figure 15.11 shows the TOP subnet. As can be seen in this …gure the target node of the TOP subnet is an output node that corresponds to the input node TOP in the top-level network. As discussed earlier, the target node of a BBN represents the objective of the assessment, which in this case is to derive a prioritised list of the trade-o¤ parameters. The TOP subnet also has two additional output nodes, namely TTM and BU. As for the TOP output node both BU and TTM have their associated input nodes in the top-level network that they fed information into. This construct by explicitly transferring budget and time-to-market information directly into the top-level network gives the ability to give budget and TTM double e¤ect when trading o¤ security solutions. The trade-o¤ variables each represent factors that in‡uences which security solution is best-…tted for a particular security solution decision situation. By allowing the prioritising of the trade-o¤ parameters the trade-o¤ tool ensures that a decision maker’s preferences or needs regarding the development factors actually in‡uence the outcome of the security solution evaluation. To support this prioritising the trade-o¤ parameter ‘priorities’ are modelled as a decision node with associated utility function. By using a utility and decision node pair construct to model priorities the preferences is explicitly modelled. As can be seen in Figure 15.11 the parameter priorities receive input from the other trade-o¤ parameters and derive the prioritised trade-o¤ parameters list using the node probability matrix of its utility node. This node probability matrix speci…es the relations between the states of all the other trade-o¤ parameters and makes the network ‡exible in tailoring the trade-o¤ tool and to quickly incorporate new trade-o¤ pa-
144
15. The Trade-O¤ Tool
rameters. Hence, the node probability matrix of the TOP priorities utility node can be used to make the BBN topology company, system and domain speci…c. In addition to the above-mentioned node probability matrix of the utility node, conditional expressions can be used to explicitly model precedence constructs and dependencies, such as if-then-else constructs. An example of such are: IF PRI.BU == ‘1’THEN TOP.BU=‘high’, which explicitly speci…es that budget is given a high priority whenever the budget is given the priority 1. In a Bayesian network or an in‡uence diagram all nodes have one or more states that they can be in. Which state a node is in at a particular point in time depends on the density probability function of the node and the states of other nodes connected to this node with incoming arches. As the TOP priorities decision node outputs a prioritised list of the other trade-o¤ parameters there is one corresponding state for each incoming trade-o¤ parameter in the TOP priorities node. The node BU denotes the budget available for mitigating security risks and is given as the interval [min; max] where min is the minimum budget available for mitigating security risks and max is the maximum budget available for mitigating security risks. The variable BG speci…es security speci…c business goals, such as that the con…dentiality of customer information is a critical business asset. BG is comprised of seven states: {Conf, Integr, Avail, NonR, Accnt, Auth, Relia} corresponding to con…dentiality, integrity, availability, authenticity, accountability, non-repudiation and reliability. These are the seven security attributes included in the de…nition of information security in the AORDD framework. The node STA is used to specify standards that the system must adhere to and the node BS covers security issues related to the business strategy expressed as the degree of importance of security as a quality measure for the business. LR covers laws or regulations for security issues that the system must comply by, such as the data privacy regulations in Personopplysningsloven (act relating to the processing of personal data) in Norway. SAC represents security risk acceptance criteria and are used to specify the acceptable risk level for the ToE and the node POL denotes the relevant security policies that the ToE should comply by. As for the BG node, the states of STA, BS, LR and POL are the seven security attributes. TTM is given as the interval [mindate; maxdate] where mindate is the earliest TTM date and maxdate is the latest TTM date. Table 15.1 shows the nodes and their states for the TOP subnet. The states assigned to the nodes in the trade-o¤ tool may di¤er and can be tailored to the information that is available. The state space described for the trade-o¤ tool in this chapter is an examples. In Section 18.1 the trade-o¤ analysis method and the trade-o¤ tool are demonstrated using the example state space described here. Part 6 also contains a discussion on how to tailor the trade-o¤ tool for a particular context while Chapter 16 looks into potential information
15.4 TOP subnet
145
Table 15.1. Nodes and their states in the TOP subnet Node/Variable
States
TOP
BU, TTM, Conf, Integr, Avail, NonR, Accnt, Auth and Relia
PRI
BU, BG, BS, LR, TTM, SAC, POL
BU
[min, max]
TTM
[mindate, maxdate]
SAC, STA, BG, BS and POL
Conf, Integr, Avail, NonR, Accnt, Auth and Relia
sources for the variables in the trade-o¤ tool. Note that the trade-o¤ tool has been developed using the action research based development process described in Part 1 and that parts of the results from the last case study by examples is given in Section 18.1. Details on the trade-o¤ tool and examples of its use can also be found in Houmb et al. (2006) [48] enclosed as Appendix B.2 and Houmb et al. (2005) [44] enclosed as Appendix B.3.
Part V
Aggregating Information in the Trade-O¤ Tool
16. Information Sources for Misuse and Security Solution Variable Estimation
The AORDD security solution trade-o¤ analysis makes use of misuse and security solution variables to estimate the impact and cost of a misuse and the e¤ect and the cost of a security solution. These are the inputs to the trade-o¤ tool and thus are necessary information to derive the best-…tted security solution or set of security solution. Furthermore, to trade o¤ the security solutions against each other the involved variables must be comparable and hence they must be either qualitatively or quantitatively measurable. Due to the lack of su¢ cient amount of empirical data to measure the misuse and security solution variables and due to the great deal of uncertainty involved in determining which security solution best …ts a particular security risk, there is a need to extend the trade-o¤ tool with techniques for aggregating whatever information available as input to the trade-o¤ tool. There are two main types of information sources that can be used to estimate misuse and security solution variables. These are: (1) Observable information and (2) Subjective or interpreted information. Observable information is also referred to as empirical information (or “objective” information) and includes information from sources that have directly observed or experienced a phenomenon. Such sources have not been biased by human opinions, meaning that the sources have gained knowledge or experience by observing events and facts. Interpreted information sources include sources that have indirectly observed phenomena or those that pose a particular set of knowledge and experience, such as subjective expert judgments.
16.1 Sources for observable information Observable information sources are most often represented using the classical interpretation of probability, meaning that these describe some event and the observed occurrence of this event. Here, uncertainty is associated with how representative the observations are of the actual facts. Observable information sources
150
16. Information Sources
includes among other things publicly available experience repositories, company con…dential experience repositories, domain knowledge (facts), recommendation or best practice, standards (a collection of best practice), results from risk assessment, results from formal security veri…cation, honeypot log-…les, Intrusion Detection Systems (IDS) log-…les and other type of log-…les, such as Firewall log-…les. Information from IDS and honeypots are real-time information sources and thus record information in real-time. Such sources are useful both for deriving the misuse scenario and for estimating misuse occurrence frequencies and security solution e¤ects. The latter can be done by employing two log periods, one before and one after the employment of a security solution. There are many ways that information can be obtained from real-time information sources and some examples are given in the following. The real-time observable information source Snort is a freeware IDS and frequently used both in academia and in industry. An example of output from Snort for the Internet worm CodeRed is: 10/30-11:47:14.834837 0:80:1C:CE:8C:0
!
! 0:10:60:DB:37:E5 typ e:0x800 len:0x3E 129.241.216.114:1203
129.241.209.154:139 TCP TTL:125 TOS:0x0 ID:45447 IpLen:20 Dgm Len:48 DF ******S* Seq:
0x6F12FE95 Ack: 0x0 W in: 0xFFFF TcpLen: 28 TCP Options (4) => M SS: 1260 NOP NOP SackOK.
The above is interpreted as following: {date}–{tim e} {source M AC address} ! {destination M AC address} {typ e} {length} {source address} ! {destination address} {protocol} {TTL} {TOS} {ID} {IP- length} {Datagram – length} {Flags}{Sequence numb er} {Acknowledgm ent} {W indow} {TCP–length} {TCP options}
The above information from Snort is an example of transport layer logging (layer 4 in the OSI reference model and layer 3 in the TCP/IP protocol stack), in this case TCP. As for anti-virus software Snort triggers alarms according to known signatures describing suspicious activity. By con…guring the logging mechanism, Snort can be set up to monitor particular attacks, such as speci…c Denial of Service (DoS) attacks. Due to its ‡exible con…guration abilities Snort has the ability to record potential impacts and frequency of DoS attacks and therefore represents an e¤ective and real-time gathers of information for estimating both misuse and security solution variables. However, for the logging to be e¤ective and accurate the IDS should be combined with a honeypot, such as the freeware honeypot Honeyd [77]. Such a con…guration gives a second layer of logging which is necessary due to the problem of false positives with IDS. Using both IDS and honeypot makes it possible to compare and calibrate the two information sources against each other to eliminate some of the false positives.
16.1 Sources for observable information
151
A honeypot is an information system resource whose value lies in all unauthorised or illicit use of that resource [94]. The advantages of an honeypot is its ability to capture new attacks and attack methods by observing, responding to and documenting interactions with its environment. Honeypots come in a wide range of types and more advanced types are able to capture more information than a simpler and low-interaction honeypot. Honeypots are able to capture attack information easily, as they are set up as resources that normally are not used by any authorised users. This limits the problem with false positives. It also means that any data sent from the honeypot indicates a successful attack which makes it easier to measure events such as the number of successful attacks within a particular time frame. There are three main categories of honeypots available. These are low-interaction, middle-interaction and high-interaction honeypots. The low-interaction honeypots have limited interaction with the attackers and hence are limited in their ability to detect more advanced and innovative attacks. Low-interaction honeypots can only simulate parts of an operating system and some applications. Middle-interaction honeypots are able to simulate an entire operation system and its belonging applications and hence provide more realistic information than the low-interaction honeypots. High-interaction honeypots are real system that usually are employed in parallel with the production system, only separated by an attack routing gateway called Honeywall. However, employing the honeypot as a real system involves the risk of attackers taking over the honeypot and using it as a gateway into the network. This problem has been further elaborated on in Østvang (2004) [81] and Østvang and Houmb (2004) [82]. Combing the two information sources IDS and honeypot gives the ability to test the e¤ect that a particular security solution has on a particular misuse in a realistic environment. Assume that a set of security solutions S are identi…ed as potential treatments for DoS attacks. Each security solution si where i points to a particular security solutions is employed into the Honeyd simulation environment for the logging period 4t. Here, 4t is de…ned as the time di¤erence between start time and end time of the logging. By taking each security solution through a series of logging periods an estimate for the anticipated number of DoS attacks can by derived by calculating the set average. From this the anticipated e¤ect on DoS attacks for each security solution can be derived and thus the solution …tness for DoS attacks have been observed. To make the evaluation as realistic as possible the logging period 4t should cover the same amount of time and be comparable as there are often di¤erences in number of attack tries during weekends than during week days. In the example given in Section 18.1 the e¤ect of two DoS security solutions for a .NET e-commerce system are measured using the combination of Snort and
152
16. Information Sources
Honeyd. This is done by simulating the employment of each security solution separately and then comparing the result of the logging with the result of the simulation of the .NET e-commerce system without any DoS solutions. By doing so a real-time simulation of future con…gurations of ToEs can be performed. The trick, in this context is that the alternative security solutions are included into the simulation environment so their actual e¤ect on preventing DoS attacks can be observed. Note that there are still problems creating a realistic and comparable context for the simulation. Log-…les from …rewalls, anti-virus …rewalls, Internet gateways (routers) etc. provide information such as the source and destination IP addresses and the accessed TCP port for all connection attempts. Such logging mechanism can also employ action rules, such as …ltering mechanisms on the IP and TCP levels. Here, …ltering means to con…gure the router with access lists containing either single IP addresses or ranges of IP addresses. The rules used are among others “access” and “deny”. In addition, …rewalls provide application layer …ltering in combination with the two other …ltering functions. In the trade-o¤ tool information on who tried to contact whom, at what time and for what reason is of interest. Such information can provide information on whether there has been an attempt of port scan or other DoS attacks that was not successfull due to the …ltering rules. These pieces of information are valuable for both the misuse and the security solution variables in the trade-o¤ tool. Virus and spyware scanners also use log-…les to record the result of their activities. In addition, these mechanisms have the capability to issue alarms and perform prescribed actions to remove the problem detected, such as removing a virus and closing a connection. A vulnerability scanner works in a similar way but has more options when it comes to the actions. It detects and proposes solutions to the vulnerabilities detected, if such solutions exist (such as a list of downloadable vulnerability …xes). These tools are all helpful in detecting vulnerabilities in the system and other relevant information for the misuse variables in the trade-o¤ tool. These tools can also be used to identify potential security solutions. Public repositories are used to store experience and best practise from various relevant activities that are publicly available. Examples of such are the quarterly reports from Norsk Senter for Informasjonssikring (NorSIS) in Norway, incident and security reports and white papers from CERT, NIST, NSA and CSO, reports from the Honeynet-project and other attack trend reports. A repository can also be speci…c to a company and in such cases they are called company experience repositories. Often these repositories contain company con…dential information and thus the access to them is restricted. The information that these two types of repositories contain is mostly related to the misuse variables in the trade-o¤ tool. However, the repositories might also provide input to the security solution
16.1 Sources for observable information
153
variables, such as suggested solutions to a particular security problem and examples of unsolved issues with these that reduce their ability to withstand certain attacks. Domain knowledge is similar to the experience repositories but represent established knowledge within a particular domain, such as the e-commerce domain. Information denoted domain knowledge is based on observations of multiple coherent events over a certain amount of time. Examples are lists of well-known vulnerabilities in existing systems, such as patch lists with downloadable patches for a particular operating system version or application. Such information is highly relevant for the both the misuse and the security solution variables in the trade-o¤ tool. Recommendations and standards are best practice and industry standards derived from long-term experience from industry or similar, such as the quality assurance best practise and standards (e.g. CMM and ISO 9000). Recommendations could also take the form of interpreted information source type, such as subjective recommendation from domain experts. Examples of recommendations are those captured in Common Criteria Protection Pro…les (PP). Examples of security standards for security level evaluation are the Common Criteria, Information Technology Security Evaluation Criteria (ITSEC) and ISO 17799 Information technology –Code of Practice for information security management. System analysis and tests are module and integration tests performed on both or either of the design models and the implementation. Vulnerability analysis is such as those in the vulnerability assessment techniques and guidelines described for the Common Criteria assurance class vulnerability assessment (AVA). The main aim of these tests is to detect design ‡aws or security problems in the implementation and to check whether the implemented system meets the security requirements outlined in the design models. Formal security veri…cation covers techniques that use mathematical rigour to check a system model for ‡aws and for resistance to attacks. An example of this is the UMLsec security veri…cation approach described in Houmb et al. (2005) [44] (Appendix B.3). Results from security veri…cation are applicable to both the misuse and the security solution variables of the trade-o¤ tool. The example given in [44] demonstrates the use of such information as input to the security solution variables. Risk assessment results give information on the potential misuses, their potential frequency and their associated impacts on the system assets. In some cases a risk assessment may also identify alternative security solutions and perform an evaluation of these solutions. The result from such activities is thus relevant for both the misuse and the security solution variables of the trade-o¤ tool.
154
16. Information Sources
16.2 Sources for subjective or interpreted information Subjective information sources provide information for the misuse and security solution variables according to the subjectivistic interpretation. Thus, the subjective information sources express their uncertainty on some event, rather than providing a value and trying to estimate how close this value is to the actual value. The reader should note however that the subjective or interpreted information sources described here are according to the truly subjective interpretation and not the Bayesian interpretation. The important factor in this context is that with the truly subjective approach the problem of expressing the uncertainty related to a true value is avoided, as it is the information source’s uncertainty that is expressed. See Chapter 5 and DeFinetti (1973) [31, 32] for details. The AORDD framework and the trade-o¤ tool support three categories of subjective information sources, namely subjective expert judgment, interpreted expert information and expert judgment on prior experience from similar systems. Subjective expert judgment makes use of domain experts, developers, security experts, stakeholders and other sources that are considered to posses a signi…cant amount of understanding of the problem being assessed. The process of collecting these opinions consists of choosing the domain experts, elicitation of the expert opinions and analysis of potential biases using seed and calibration variables, as discussed in Chapter 7. In subjective expert judgment, the experts have directly gained knowledge and experience that they use when providing information. This is di¤erent than for the subjective information source interpreted expert judgment where an expert interprets events observed by external sources, such as the opinion from a domain expert or a directly observable source. Here, the experts base their opinion on their interpretation of information from other sources. This means that the information these source provides is indirect. The third category of subjective information sources is expert judgment on prior experience from similar systems. Here, the experts base their opinion on empirical information from the use of similar systems or on their own experience from working with a similar system. It is important however that the experience information used to assess misuse and/or security solution variables for a ToE is from a system that is similar to such a degree that the information is applicable to the ToE. To ensure documentation of the basis of the opinions provided the experts need to document their reasoning about the di¤erence between the system that the empirical information or experience is gathered and the ToE and the e¤ects that eventual di¤erences have on the information provided.
16.2 Sources for subjective or interpreted information
155
In the following, the trust-based performance weighting schema for information aggregation of misuse and security solution variables in the trade-o¤ tool is described. This information aggregation schema is able to combine all abovementioned information source categories, both for observable information sources and subjective information sources.
17. Trust-Based Information Aggregation Schema
There are a variety of performance-based aggregation techniques, such as the copula model developed by Jouini and Clemen (1996) [66] and the dependencebased aggregation techniques developed by Cooke and his group at Delft University of Technology [68, 18, 72, 38]. The latter is also supported by their expert aggregation program Excalibur (Software product downloadable from http://ssor.twi.tudelft.nl/~risk/software/excalibur.html ). These techniques are tailored for aggregating subjective expert judgment. However, as there is some observable information available for misuse and security solution variables, techniques for combining observable and subjective information is needed. The AORDD framework re…nes and extends the current aggregation approaches in its trust-based information aggregation schema. This schema di¤ers from other performance information aggregation techniques in that it enables the combination of objective and subjective information by adding the perceived con…dence of each information source to the aggregation weights. This is done through the introduction of the notion of trust, in addition to calibration variables, when deriving the aggregation weights. In most trust-based approaches trust is measured using binary entities such as total trust or no trust. See Ray and Chakraborty [88] for examples of related work on binary trust approaches. The vector trust model developed by Ray and Chakraborty [87, 88] extends the binary approaches by considering degrees of trust. In their model trust is speci…ed as a vector of numeric values with the three parameters: knowledge, experience and recommendation where each of these elements in‡uence the level of trust. The model allows trust to be a value in the range v 2 [ 1; 1] and ? where 1 represents total distrust, 1 represents total trust, 0 represents no-trust and ? represents situations where not enough information are available to evaluate the trust level. Values in the range [ 1; 0] denotes semiuntrustworthiness and values in the range [0; 1] denotes semi-trustworthiness. The trust-based performance weight information aggregation schema is based on the vector trust model in [87, 88], but has been re…ned and extended to tailor the model for information aggregation as input to the trade-o¤ tool. Among other
158
17. Trust-Based Information Aggregation Schema
things this includes the introduction of an additional dimension when assessing trust. In this work trust is considered to be between a decision maker A and an information source bi and there might be several information sources that provide information to the decision maker. The set of information sources is thus denoted B where B = fb1 ; :::; bi ; :::bn g. Trust and distrust in relation to estimating misuse and security solution variables is de…ned as the following (note that these de…nitions are re…ned from [88] to target information gathering and aggregation for security solution evaluation). De…nition Trust is de…ned to be the …rm belief in the competence of an entity to provide accurate and correct information within a speci…c context. De…nition Distrust is de…ned to be the …rm belief in the incompetence of an entity to provide accurate and correct information within a speci…c context. Figure 17.1 shows the …ve steps of the information aggregation schema for the trade-o¤ tool. As can be seen in the …gure, the …rst four steps of this schema cover the trust-based performance weighting schema while Step 5 of the schema covers the trust-based information aggregation. This separation of the information aggregation schema is done to allow for the use of alternative methods, both to derive the internal relative information source weights and for aggregating the information using the information source weights. Step 1 concerns the speci…cation of the trust context. This is an important task when combining information from di¤erent sources and of di¤erent types as information given under di¤erent trust contexts cannot directly be combined. The trust context is speci…ed using a trust context function C(T ). This function takes the trust purpose and assumptions such as input and returns the context of the trust relationship as output. Step 2 concerns the speci…cation of the relationship between the set of information sources B using knowledge domain models and is measured in terms of the perceived knowledge level, against the desired knowledge level and the perceived experience level. Both the knowledge level and the experience level are measured in relation to the problem in question and used to derive the information source perceived and relative knowledge and experience level. The relationship between the information sources is a relative measure within B. These relationships denote the internal rank and needs to be determined before the relationship between the decision maker and the information sources are examined. The latter is the task of Step 3 where the trust relationships between the decision maker and the information sources are evaluated using the three trust variables: knowledge, experience and recommendation.
17. Trust-Based Information Aggregation Schema purpose
assumptions
Step 1
Trust Context
Step 2
159
B Trust relationship between decision maker and information sources
A Trust relationship between information sources
Apply B on A
Step 3
Trust-based performance weighting schema
Step 4
Trust- based IS performance weights
Aggregate information using TBISP weights
Step 5
Trust-based Information aggregation
Fig. 17.1. Overview of the …ve steps of the trust-based information aggregation schema
In Step 4 the trust relationship between the decision maker and the information sources derived in Step 3 are applied to the relative internal trust relationship between the information sources from Step 2. This results in the trust-based information source performance weights. Step 4 is thus the last step of the trustbased performance weighting schema. Step 5 is the trust-based information aggregation technique and concerns the aggregation of information from the information sources using the trust-based information source performance weights from Step 4. This is done by combining the information source weights with the information provided from each information source over all information sources. It is Step 5 of the trust-based information aggregation schema that connects the schema with the trade-o¤ tool described in Part 4. A demonstration of the use of Step 5 in the trade-o¤ tool is given in Section 18.1. Note that Step 1 and 3 are re…nements of parts of the vector trust model [87, 88] while all other steps are new.
160
17. Trust-Based Information Aggregation Schema
17.1 Step 1: Specify trust context Step 1 in the trust-based information aggregation schema speci…es the trust context for the information elicitation and aggregation. The trust context de…nes under which conditions the trust relationships for information aggregation are established. Furthermore, the trust context is also used to make sure that the decision maker and the information sources have the same understanding of both the problem being assessed and the information being provided for the trade-o¤ tool. The way that the trust context is speci…ed might include several variables as well as varying from case to case depending on the trust purpose as discussed by Branchaud and Flinn (2004) [10]. The purpose of a trust relationship states why the relationship is established, such as “The purpose of the trust relationship between the decision maker A and the information source bi is that of bi providing information on ”. A case description represents the problem being assessed. An example of such is “the number of average DoS attacks per month for the coming year for a particular e-commerce system”. More information on case description is in Chapter 7. The assumptions of a trust relationship speci…es the understanding that the involved parties have about the information provided and received. This is comprised of the decision maker’s understanding of the information provided by the information source and the information source’s understanding of the information provided to the decision maker. These two understandings need to be equal to ensure that all pieces of information are accurate and in accordance with the information request (the case description) from the decision maker. C
De…nition The atomic purpose of a trust relationship A ! bi is that of Provide information on . The main reason for establishing the trust relationship is for one information source to provide correct and accurate information on where case description is a clear and unambiguous model of the problem being assessed. De…nition The Purpose of a trust relationship is that of (modi…ed from Ray and Chakraborty [87]) An atomic purpose is a purpose of a trust relationship, The negation of an atomic purpose denoted by “not” atomic purpose is a purpose, Two or more purposes connected by the operator “and” form a purpose, Two or more purposes connected by the operator “or” form a purpose,
17.1 Step 1: Specify trust context
161
Nothing else is a purpose. The assumption of a trust context denotes any understanding or prerequisite made by any of the involved parties when requesting and providing information. Hence, assumptions is used to specify the setting and understanding of the information given or received. C
De…nition The atomic assumptions of a trust relationship A ! bi is that of Decision maker‘s understanding of the information request. This denotes the decision maker’s own understanding of the information request that the decision maker provides to the information source. Information source‘s understanding of the information request. This denotes the information source‘s understanding of the information request as given by the decision maker. Decision maker‘s understanding of the information provided. This denotes the decision maker‘s understanding of the information as provided by the information source. Information source‘s understanding of the information provided. This denotes the information source‘s own understanding of the information that the information source provide to the decision maker. De…nition The assumptions of a trust relationship is that of An atomic assumption is an assumption of a trust relationship, The negation of an atomic assumption denoted by “not” atomic assumption, is an assumption Two or more assumptions connected by the operator “and” form an assumption, Two or more assumptions connected by the operator “or” form an assumption, Nothing else is an assumption. By combining trust purpose and trust assumptions trust is de…ned as the interrelated conditions in which trust exists or occurs. This trust context is speci…ed using a trust context function C(T ). De…nition The trust context function C(T ) of a trust relationship T is a function that takes the trust relationship as input and returns the context of the trust relationship as output (modi…ed from Ray and Chakraborty [87]).
162
17. Trust-Based Information Aggregation Schema
De…nition Let U denote the set of trust purposes and A the set of trust assumptions. Then the trust context C(T ) of a trust relationship is de…ned as (modi…ed from Ray and Chakraborty [87]) A tuple of the form < ui ; ai > is a trust context where ui 2 U and ai 2 A,
Two or more trust contexts connected by the operator “and”form a trust context, Two or more trust contexts connected by the operator “or” form a trust context, Nothing else is a trust context.
17.2 Step 2: Trust relationship between information sources Step 2 of the trust-based information aggregation scheme concerns assessing and deriving the trust relationship between the set of information sources in B. These relations are also called information source relative trustworthiness. The …rst version of the technique to derive information source relative trustworthiness was described in Houmb, Ray and Ray (2006) [45]. Determining information source relative trustworthiness to express the perceived abilities of an information source for providing accurate and correct information for a particular case description is done using two trust variables: (1) knowledge level and (2) expertise level. Details on how to derive these two levels is given in the following. 17.2.1 Knowledge level The trust variable knowledge level is used to express the perceived and relevant domain knowledge for an information source according to the case description and the trust context and is measured in terms of a knowledge score. Here, knowledge covers the perceived aggregate of information that an information source possesses. Knowledge is most often perceived either through education or professional work situations. Knowledge level is a subjective measure and should therefore be assessed not only by the information source itself but also by an evaluator (as done during evaluation according to the Common Criteria) or a third party that has su¢ cient overview of both the education and work experience for the information source. In addition, the third party or the evaluator has to be su¢ ciently aware
17.2 Step 2: IS trustworthiness weight
163
of the implications of the case description and the purpose and assumptions of the information that the information source is providing, as de…ned by the trust context. Such an evaluator or third party is external to a decision maker (the entity requesting information) and hence the trust relationship between the decision maker and the external source should also be established and evaluated However, in the trust-based performance weighting schema all trust relationships between the decision maker and an external source are assumed to have the trust value 1. This means that the external source is considered to be totally trustworthy. Deriving the knowledge level of an information source is done using three activities. These are: (1) Establish the reference knowledge domain model. (2) Establish the information source knowledge domain model for each information source. (3) Derive the relative knowledge score for each information source, by evaluation the information source knowledge domain models against the reference knowledge domain model normalised over all information sources. Estimating the relative knowledge score from the comparison in activity 3 might be done in a number of ways. In the example in Section 18.1, a simple score-based approach is used. When computing the knowledge score of an information source the two types of knowledge domain models derived in activities 1 and 2 have di¤erent purposes in the computation and are thus modelled separately. The reference knowledge domain model is used to derive the relative score for each of the knowledge domains in the reference model. This is done using the knowledge domain score model of activity 1. The information source knowledge domain models, which are evaluated against the reference knowledge domain model to derive the knowledge score of the information sources, describes the perceived knowledge level for each of the knowledge domains for each information source. These models express the knowledge score for each of the information sources and are derived using the information source knowledge domain score model in activity 2. Activity 1: Establish the reference knowledge domain model. The reference knowledge domain model consists of a set of knowledge domains relevant for the case description and a speci…cation of their internal relations. The internal relations are measured as the relative importance of each involved knowledge domain. The knowledge domains might be derived using several techniques and a reference knowledge domain model is used to describe the relevant knowledge for the case description under the conditions given in the trust context. Figure 17.2 shows a general reference knowledge domain model consisting of four domains. The …gure shows both the involved knowledge domains and their relative importance weights. As can be seen in the …gure the four domains are: domain A, domain B, domain C and domain D and the relative importance weight for all knowledge domains is 0:25 in the importance weight interval [0; 1]. Section 18.1 gives an example of a reference knowledge domain model, information source
164
17. Trust-Based Information Aggregation Schema
Fig. 17.2. General reference knowledge domain model
knowledge domain models and how to compare the two types of models to derive the knowledge score. Usually, the internal relation between the knowledge domains of the reference knowledge domain model is not directly given or extractable and several external sources must be used to derive the internal relation. This is supported by the knowledge domain score model described below. Knowledge domain score model derives the relative importance and coverage measured as knowledge domain score for each knowledge domain in the reference knowledge domain model according to the trust context C.
17.2 Step 2: IS trustworthiness weight
h
m
WKimp (x) = [wKimp (x(j))]j=1 " # 1 qKimp = P j WKimp (x(j))
i
x2X
165
(17.1) (17.2)
x2X
WRKimp (x) = [qKimp W Kimp (x)]x2X
(17.3)
WaggrKimp (X) = f aggrKimp ([W RKimp (x(j))]x2X ) h i m WKcov (x) = [wKcov (x(j))]j=1 x2X # " 1 qKcov = P W Kcov (x(j)) j
(17.4)
WRKcov (x) = [qKcov W Kcov (x)]x2X WaggrKcov (X(j)) = f aggrKcov ([W RKcov (x)]x2X )
(17.7) (17.8)
WinitKDscore (X) = W aggrKimp (X) W aggrKcov (X) 1 qinitKDscore = P W (X(j)) initKscore j
(17.9)
(17.5) (17.6)
x2X
WDKscore (X) = q initKscore W initKDscore (X)
(17.10) (17.11)
As can be seen in the knowledge domain score model each knowledge domain in the reference knowledge domain model is measured in terms of their importance (weight) and coverage (weight) and modelled as the vectors wKimp and wKcov respectively. Here, coverage measures the extent that a knowledge domain covers the required knowledge to assess the particular case description, which is the problem being assessed. Importance on the other hand measures the importance that the knowledge domain has for an information source to provide accurate information. More details on this distinction is given in the example in Section 18.1. A knowledge domain is denoted j and the set of knowledge domains is denoted J. Furthermore, there are m number of j in J, #j 2 J = m and thus the wKimp and wKcov vectors each have m elements. Note as m is a variable the number of knowledge domains may vary from case to case. The importance and coverage weights for each knowledge domain in the reference knowledge domain model might be assigned by any of the involved evaluators or third parities, such as stakeholders, standards or regulations. This means that there might be several data sets for the importance and coverage of a particular knowledge domain. These stakeholders, standards, regulations etc. are denoted external sources x and the set of external sources are denote X. The importance
166
17. Trust-Based Information Aggregation Schema
and coverage for each external source x 2 X are thus modelled as WKimp (x) = m m [wKimp (x(j))]j=1 and WKcov (x) = [wKcov (x(j))]j=1 . The knowledge domain score model …rst considers the importance weights. Equation 17.1 in the knowledge domain score model derives the importance vector WKimp (x) for all external sources in X. This gives #x 2 X number of importance vectors. These importance vectors represent the initial importance weights and must be normalised to express relative knowledge domain internal relation. This is done in (17.3) using the normalisation factor derived in (17.2) and results in #x 2 X number of normalised importance weight vectors. As it is easier to work with one importance weight vector than an arbitrary number of such vectors, the set of importance weight vectors are combined into one importance weight vector. This is done using the aggregation function faggrKimp in Equation 17.4. Here, the aggregation function includes normalisation and the output from the aggregation is one aggregated normalised importance weight vector.
The aggregation can be done using one of several available aggregation techniques, such as those described in Cooke (1991) [16]. In the example in Section 18.1 the aggregation is done by taking the arithmetic average. Taking the arithmetic average is the simplest type of expert opinion aggregation and thus does not capture the di¤erences in the ability of x to evaluate the relations between knowledge domains. Deriving the coverage weights for each knowledge domain is performed by following the same procedure as for deriving the importance weight. The coverage weight vector for each x 2 X is derived using Equation 17.5. This result in #x 2 X of not normalised coverage weight vectors. Before these coverage weight vectors can be combined each must be normalised, which is done in (17.7) using the normalisation factor derived in (17.6). The aggregation of the #x 2 X of normalised coverage weight vectors derived in (17.7) is then aggregated in (17.8). The importance score and coverage score vectors are then combined into an initial knowledge domain score vector using Equation 17.9. Finally, the initial knowledge domain scores are normalised in (17.11) using the normalisation factor derived in (17.10). Activity 2: Establish the information source knowledge domain model for each information source. Activity 2 is supported by the information source knowledge domain score model described below. This model derives the score of an information source for each of the knowledge domains in the reference knowledge domain model. This is done independently from assessing the importance and coverage of the knowledge domains in the reference knowledge domain model.
17.2 Step 2: IS trustworthiness weight
167
As for the knowledge domain score model, there might be several external sources (third parties) providing information used to evaluate the knowledge of an information source. Here, these external sources are denoted y to specify that these external sources are di¤erent from those in the knowledge domain score model and that x and y are independent. However, in practice x and y might be di¤erent external sources or the same sources playing di¤erent roles. The set of these external sources is denoted Y . Information source knowledge domain score model derives the relative score for each knowledge domain in the reference knowledge domain model for an information source bi according to the trust context C. i h m (17.12) WKis (y(bi )) = [wKis (bi (j))]j=1 y2Y # " 1 (17.13) qKis = P W (bi (j))) Kis j y2Y
WRKis (y(bi )) = [qKis W is (y(bi ))]y2Y
(17.14)
WaggrKis (Y (bi )) = f aggrKis ([W RKis (y(bi ))]y2Y )
(17.15)
As can be seen in the information source knowledge domain score model each external source y in the set of external sources Y gives information on the knowledge level for information source bi . The output of the information source knowledge domain score model is a vector of information source knowledge domain score aggregated over all y in Y . This vector is denoted WaggrKis (Y (bi )) and the model derives one such vector for each information source bi 2 B.
Equation 17.12 is used to assess the score for information source bi , for all knowledge domains in the reference knowledge domain model. This is done for all external sources, meaning all y 2 Y and result in #y 2 Y of vectors. As these vectors are not normalised their contained knowledge score for each knowledge domain in the reference knowledge domain model must ve updated to express the relation between thema. This is done by normalising all #y 2 Y number of vectors in (17.14) using the normalisation factor derived in (17.13). To obtain one information knowledge domain score vector for bi , the #y 2 Y number of vectors derived in (17.14) is combined into one vector by aggregating over Y using the aggregation function faggrKis in (17.15). Note that the aggregation function includes normalisation and that the output of the aggregation thus is a normalised vector. Activity 3: Derive the relative information source knowledge score. The result from the knowledge domain score model and the information source
168
17. Trust-Based Information Aggregation Schema
knowledge score model is then combined to derive the knowledge score for the information source bi . This is done in activity 3, which is supported by the knowledge score model described below. Knowledge score model derives the knowledge score for an information source bi by combining the knowledge domain scores from the knowledge domain score model with the values for each knowledge domain for an information source bi derived in the information source knowledge domain score model.
WKscore (bi ) =
X
bi 2B
WDKscore (X)
W aggrKis (Y (bi ))
(17.16)
The result from the knowledge score model is a vector holding the score that an information source bi has for each knowledge domain contained in the reference knowledge domain model. This resulting knowledge score vector is derived by component-based multiplication of the two vectors WDKscore (X) and WaggrKis (Y (bi )) using Equation 17.16. By diving over the number 1 it makes it easier to combine the knowledge score vector with the experience score to derive the information source trustworthiness weight for bi which is the output of Step 2 of the trust-based performance weighting scheme. Note that the factor of trustworthiness of the external sources in X and Y are not considered in this model. As mentioned earlier all external sources are considered to be completely trustworthy and thus all these trust relationships are assigned trust value 1. 17.2.2 Expertise level The second trust variable expertise level concerns the perceived level of expertise that a particular information source has obtained in some way. Determining who is an expert and thus has a high level of expertise is usually highly subjective and determined by such as a certi…ed assessor in a security evaluation. Here, the trust-based information aggregation schema is not concerned with the absolute measure of the expertise level but rather the relative perceived expertise level of an information source. Relative in this context means relative to the other information sources in B. As for knowledge level the expertise level is measured in terms of a score, here called expertise score. This expertise score is determined using three activities and these are: (1) Derive internal and relative category scores for all categories for each calibration variable. (2) Derive category scores for all calibration variables for each information source.
17.2 Step 2: IS trustworthiness weight
169
Table 17.1. Example calibration variables for determining the expertise level for an information source Variables
Categories
level of expertise
low, medium, high
age
under 20, 20-25, 25-30, 30-40, 40-50, over 50
years of relevant education
1 year, 2 years, Bsc, Msc, PhD, other
years of education others
1 year, 2 years, Bsc, Msc, PhD, other
years of experience from the industry
1-3 years, 5 years, 5-10 years, 10-15 years, over 15 years
years of experience from academia
1-3 years, 5 years, 5-10 years, 10-15 years, over 15 years
role experience
database, network management, developer, designer, security management and decision maker
(3) Derive the expertise score for each information source by combing the result from activity 2 with the result from activity 1 for each information source. Note that the category scores in activities 1 and 2 are independent. Hence, changes can be made in the internal category scores for an calibration variable, without having to reassess the category scores for all information sources. The number and set of calibration variables used will vary from case to case depending on the case description. The trust-based information aggregation schema do not mandate the use of a particular set, as the schema assess the internal relations of the calibration variable set in activity 1. Table 17.1 gives an example set of calibration variables with their associated categories. Activity 1: Deriving calibration variable category scores. Activity 1 of deriving the expertise score is performed by the calibration variable category score model described below. This model examines the internal relations of the categories contained in each calibration variable and derives a calibration variable relative category score for all categories for all calibration variables. In the trust-based performance weighting schema the internal relations for expertise level are measured in terms of importance related to the case description, which is the problem that the information source is providing information for and modelled using the two vectors WEcat and WEimp . WEcat is a support vec-
170
17. Trust-Based Information Aggregation Schema
tor used for reference purposes and holds the identity or name of each category in a calibration variable while WEimp holds the relative importance weights for the categories of a calibration variable. Thus, the …rst element in WEcat for the calibration variable v holds the name of its category number 1 while the …rst element in WEimp for the calibration variable v holds the importance weight for its category number 1. As for the knowledge level several external sources might provide information to populate the two vectors. Also as for knowledge level, the external sources are denoted x and the set of external sources are denoted X. In addition, there are usually several calibration variables involved and these are collected in the set V of calibration variables v. Calibration variable category score model derives the internal relative category score for all categories of all calibration variables according to the trust context C.
i h l WEcat (v(k)) = [wEcat (k)]k=1 v2V h i l WEimp (x(v(k))) = [wEimp (k)]k=1 ]v2V # x2X # "" 1 qEimp (v(k)) = Pl k=1 WEimp (v(k)) v2V x2X h i WREimp (x(v(k))) = [q Eimp (v(k)) W Eimp (x(v(k)))]v2V x2X h i WaggrEimp (X(v(k))) = faggrEimp ([W REimp (x(v(k)))]x X )
v2V
(17.17) (17.18) (17.19) (17.20) (17.21)
The calibration variable category score model starts with populating the categories for each of the calibration variables. This is done in Equation 17.17 and results in the WEcat vector with l number of elements for each calibration variable. The elements of each WEcat vector is the categories for the associated calibration variable. Note that l might vary depending on the calibration variable and that the categories for a calibration variable are given prior or as part of the assessment. Furthermore, in the calibration variable category score model, the assumption is that all external sources in X have come to an agreement on the name and number of categories for each calibration variable. The importance weight of each category in a calibration variable is modelled as the WEimp vector in the calibration variable category score model. As #x 2 X >
17.2 Step 2: IS trustworthiness weight
171
1 the importance weight for each category of an calibration variable can be given by several external sources. This means that the WEimp vector for a calibration variable v is populated #x 2 X times to derive the initial category importance weights using Equation 17.18. As the importance weight of the categories of v is measured relative to each other the initial importance weights from (17.18) must be normalised. This is done in (17.20) using the normalisation factor derived in (17.19) for all calibration variables v 2 V for all external sources x 2 X. To derive one category importance vector for each calibration variable, all normalised category importance vectors for all v 2 V are aggregated over X. This is done using Equation 17.21. As for the knowledge level the aggregation function used may vary. An example of aggregating importance weights is given in Section 18.1.
The resulting aggregated category importance weight for all v 2 V needs to be normalised to recover the relative importance weights after the aggregation. This normalisation is part of the aggregation function in (17.21). Activity 2: Deriving information source calibration variable category scores. Activity 2 of deriving the expertise score concerns the evaluation of the abilities of each information source in relation to the categories of each calibration variable. This is done using the information source calibration variable category score model described below. As for the knowledge level an additional set Y of external sources y provides the information on the information sources. Information source calibration variable category score model derives the relative category score for all categories of all calibration variables for an information source according to the trust context C.
WEis (y(bi (v(k))))= qEis (bi (v(k)))=
""
h
Pl
l
[wEimp (k)]k=1
k=1
i
v2V
1 WEis (bi (v(k)))
#
(17.22) y2Y
v2V
#
(17.23) y2Y
WREis (y(bi (v(k)))) = [qEis (bi (v) W Eis (y(bi (v)))]v2V y2Y h i WaggrEis (Y (bi (v(k)))) = faggrEis ([W REis (y(bi (v)))]y Y )
v2V
(17.24) (17.25)
The …rst task to perform in the information source calibration variable category score model is to populate the WEis vector for the information source bi . This is
172
17. Trust-Based Information Aggregation Schema
done using Equation 17.22 for all y 2 Y . The WEis vector is used to model the information source category scores for a calibration variable v. Here, the #v 2 V is the same as for the calibration variable category score and for each information source bi 2 B the WEis vector must be populated #v 2 V times for all y 2 Y . However, as it happens that one or more of y 2 Y do not have information on all categories for all calibration variables, a value to indicate the lack of information is introduced. The symbol for no information is , which is padded for the corresponding elements in the WEis vector.
As the category scores are measured in relation to each other, all WEis vectors need to be normalised. This is done in (17.24) by updating the result from (17.22) using the normalisation factor derived in (17.23) for all WEis vectors. As the category scores for an information source is given by several external sources y and as the WEis vectors only hold the scores for one y the WEis vectors for each calibration variable must be aggregated over Y . This is done using Equation 17.25 and the results in the information source relative calibration variable category score for the information source bi . The result of the aggregation may produce not normalised values and thus normalisation must be performed. This is part of the aggregation function in (17.25). Activity 3: Derive expertise score for each information source. In activity 3 of deriving the expertise score, the internal category scores from the calibration variable category score model is combined with the information source calibration category scores for all v 2 V . In the trust-based performance weighting schema this is done using the expertise score model described below. This uses Equation 17.26 where the expertise score is derived by component-wise multiplication over all calibration categories k. The construct in Equation 17.26 ensures that the resulting expertise score is equal or less than 1. Expertise score model derives the expertise score for an information source bi by combing the calibration variable category score with the information source calibration variable category score for all v 2 V . The result is the expertise score for an information source according to the trust context C.
FEscore (bi ) =
X
k
WaggrEimp (X(v(k))
W aggrEis (Y (bi (v(k))))
(17.26)
17.2.3 Computing relative information source trustworthiness weights The results from the two trust variables knowledge level and expertise level are the knowledge score and the expertise score for an information source bi respectively.
17.2 Step 2: IS trustworthiness weight
173
To derive the information source relative trustworthiness, which is the expected output from Step 2 in the trust-based performance weighting schema, these two scores must be combined. This is done using the relative IS trustworthiness model described below. As the information sources in B are evaluated against each other the goal of the relative IS trustworthiness model is to derive a relative information source trustworthiness weight and not the absolute trustworthiness weight for an information source. Also, as trust exists in a context the relative information source trustworthiness weight is only valid for the trust context C. Relative IS trustworthiness model is used to derive the relative trustworthiness weight for an information source bi . This is done by combining the knowledge score and the experience score for bi for the trust context C.
FKscore (bi ) + FEscore (bi ) " bi 2 1 F B initT rust (bi )
(17.27)
FinitT rust (bi ) = qRT rust = P
bi
FIST W (bi ) = F initT rust (bi ))
q RT rust
bi 2B
(17.28) (17.29)
The initial information source trustworthiness of information source bi is computed by the initial trustworthiness function FinitT rust (bi ) in (17.27). This initial trustworthiness is derived by adding the relative knowledge score with the relative experience scores for all bi 2 B. As can be seen in (17.27) the knowledge and experience scores are given the same importance weights in the relative IS trustworthiness model. If there is a need to emphasise one over the other, the initial trustworthiness function can be changed to re‡ect this. As one of the common problems in subjective expert judgment is underestimation and overestimation by the external sources an error function is included in the initial trustworthiness function. This error function is modelled as "(bi ) and holds the experience-based corrections of overestimation and underestimation of Y on bi . Thus, "(bi ) represents the ability of the model to capture the experience gained on the use of Y to evaluate bi . If there is no prior experience in using Y to evaluate bi the error function is left empty. Note that the error function is able to capture individual experiences of y as the output of the error function is a normalised expression over all y 2 Y . This also means that "(bi ) 6= in all cases where one or more y of Y have experience. More information on the problem of underestimation and overestimation or elicitation and aggregation of subjective expert judgments in general can be found in
174
17. Trust-Based Information Aggregation Schema
Cooke (1991) [16], Cooke and Goossens (2000) [17], Goossens et al. (2000) [38], Cooke and Slijkhuis (2003) [18] and similar sources. As the initial trustworthiness is not a relative measure it needs to be normalised. Normalisation is done by using Equation 17.29 which updates the initial trustworthiness in (17.27) using the normalisation factor derived in (17.28). As the relative information source trustworthiness weights are normalised, trustworthiness is expressed as a weight with values in the range [0; 1]. Here, value 0 means no trustworthiness and the value 1 means complete trustworthiness. Values close to 0 express little trustworthiness and values close to 1 describe high trustworthiness. If no information on the knowledge level and experience level of bi is available the model does not provide any output for bi . This should be interpreted as unknown trustworthiness. To ensure the computability of unknown trustworthiness in the preceding steps in the trust-based information aggregation schema unknown trustworthiness is assigned the value 0.
17.3 Step 3: Trust relationship between decision maker and information sources Step 3 of the trust-based performance weighting schema evaluates the trust relationship between the decision maker and each of the information sources bi in the set of information sources B. This is done using the vector trust model developed by Ray and Chakraborty [87, 88]. The vector trust model measures trust as a value in the range [ 1; 1] using the three trust variables: knowledge, experience and recommendation. Please note that the variable knowledge in the vector trust model is not the same as the trust variable knowledge level in Step 2. Knowledge in Step 3 addresses the knowledge that the decision maker has on the perceived past performance of an information source while knowledge level in Step 2 denotes the perceived level of knowledge that an information source has gained through its personal and professional activities. This implies that observable information sources do not perceive knowledge but that they are considered completely knowledgeable within the knowledge domain that the information they provide covers. This work does not describe the vector trust model and the reader is referred to Ray and Chakraborty [87, 88] for details. Here, it su¢ ces to say that the outcome is a decision maker speci…c trust weight for each information source bi in the set of information sources B. This trust weight denotes the degree that the decision maker A trusts bi to provide correct and accurate information according to the trust context C derived in Step 1.
17.5 Step 5: Aggregate information
175
17.4 Step 4: Updating the relative information source trustworthiness weights In Step 4 the relative information source trustworthiness weights derived in Step 2 are updated with the result from Step 3 to derive the decision maker speci…c relative information source trustworthiness weights. This is done using Equation 17.30. As described earlier Step 3 derives the trust relationship and the trust weight between the decision maker, as the truster A and the information sources bi in B and Step 2 derives the relative information source trustworthiness weights for all bi 2 B. These two types of weights are independent in the trust-based performance weighting schema and thus the contents of Step 2 and 3 can be modi…ed independent of each other, as long as the output stays the same. This also means that both this step and Step 3 can be skipped if the decision maker does not have any previous knowledge, experience or recommendation on the information sources bi or to reduce the complexity of the schema. The output of this step is the trust-based performance weight for each information source bi in B. h FIST W _Step4 (bi ) = FIST W (bi )
i C v(A ! bi )
bi 2B
(17.30)
Step 4 concludes the trust-based performance weighting schema. The initial version of this schema was published in Houmb, Ray and Ray (2006) [45]. Note that the version of the schema described here di¤ers signi…cantly from the initial schema described in [45].
17.5 Step 5: Aggregating information (in the trade-o¤ tool) Step 5 of the trust-based information aggregation schema is the trust-based information aggregation. This is the step that connects the trust-based information aggregation schema with the trade-o¤ tool described in Part 4. The main task in this step is to aggregate the set of pieces of information from the information sources. This is done by applying the associated trust-based performance weight derived in Step 4 of the trust-based performance weighting schema on each piece of information. This task is ful…lled by performing the two activities: (1) Update each piece of information from bi by applying to it the relative trustworthiness
176
17. Trust-Based Information Aggregation Schema
weight of bi . (2) Aggregate all pieces of information by multiplying the result of (1) for all bi 2 B. Activity 1 is supported by Equation 17.31 and activity 2 is supported by Equation 17.32. In (19.31), a piece of information provided by bi is denoted Ibi . If bi provides several pieces of information Equation 17.31 is performed for each of these pieces of information.
The result of activity 2 and hence Equation 17.32, is one set of information that can be directly fed into the associated nodes in the BBN topology of the trade-o¤ tool described in Part 4.
FIST W _Step4U d (bi )= Ibi F IST W _Step4 (bi ) Faggr_Step5 (z)=
bi 2B FIST W _Step4U d (bi )
bi 2B
(17.31) (17.32)
An example of trust-based information aggregation and a short description of the implementation of Step 5 of the trust-based information aggregation schema is given in Section 18.1. There is also an alternative and explorative approach to combine observable and subjective information developed in this work. This approach is described to some detail in Houmb (2005) [41].
Part VI
Validation, Discussion and Concluding Remarks
18. Validation of the Approach
This thesis has given an overview of the AORDD security solution decision framework and described some of the details of its two core components. These are the AORDD security solution trade-o¤ analysis with its trade-o¤ method and tool and the trust-based information aggregation schema for feeding information into the trade-o¤ tool. Of the two the trust-based information aggregation schema is rather explorative and has not been thoroughly evaluated. However, some validation of the feasibility and usability of the schema has been performed through case studies by examples. The demonstration of the feasibility of the schema is given in Section 18.1. The AORDD trade-o¤ analysis has been implemented as a BBN topology tradeo¤ tool and both have been tested and reviewed through three iterations of case study by example using the action research approach described in Section 1.4. In addition, an informal reasoning about the scalability, feasibility and applicability of the approach has been performed. The latter is documented brie‡y in the discussion provided in Chapter 19. The three example-runs of the AORDD security analysis trade-o¤ analysis are documented in several papers, the most important being Houmb et al. (2006) [48] in Appendix B.2 and Houmb et al. (2005) [44] in Appendix B.3. Houmb et al. (2005) describes parts of the result from the …rst example run of the trade-o¤ analysis while Houmb et al. (2006) describes parts of the result from the second example run. The third and …nal example run is partly documented in Section 18.1. The AORDD framework in itself is evaluated through validation of the ful…lment of the research questions of this work and the requirements to the current design. Validating the practical applicability of the framework and its contained components is critical to its potential future use in industry as many techniques developed in the academia never make it to industry due to their inherent accidental complexity and lack of scalability. The balance between desired and accidental complexity is a key factor in this context. Industry needs approaches that are easy to use and that take all necessary factors into consideration to ensure that they actually solve some real problems.
180
18. Validation of the Approach
To meet these demands, this work uses an action research based work process with a step-wise practical validating using an example e-commerce system. The evaluation in this work used the requirements, design documents and prototype description of the ACTIVE e-commerce platform developed by the EU-project ACTIVE and redeveloped parts of the e-commerce platform by a¢ liating the AORDD framework and in particular the AORDD security solution trade-o¤ analysis and the trust-based information aggregation schema. The prototype of the ACTIVE system was …nalised in 1999. Details of the ACTIVE system can be found in Georg, Houmb and France (2006) [36]. This work approach has enabled the study of the practical implications of the current design of the framework and its components at several points in time, as well as getting practical experience in doing development using the AORDD framework. This was done both in the initial exploration phase and in the development and evaluation phase of the construction work process used in this work (details are in Part 1). There have been many updates and changes to the framework and its components throughout the work and the framework and its contained components are far from …nalised and need further revisions and validation. The evaluation and validation performed in this work merely covers the initial explorative phase and the …rst few iterations of the development and evaluation phase from requirement speci…cation to testing and validation. The next step in the validation will need to include a realistic industrial scale case study.
18.1 Demonstration of the trade-o¤ tool and the trust-based information aggregation schema to support choice of security solution This chapter demonstrates the trade-o¤ tool and the trust-based information aggregation schema for aggregating information as input to the trade-o¤ tool using the login service of the reengineered version of the ACTIVE e-commerce prototype platform, as described in Georg, Houmb and France (2006) [36]. The ACTIVE e-commerce platform provides services for electronic purchasing of goods over the Internet. The platform was initially developed for the purchase of medical equipment, but does also possess qualities that make it a general platform for providing services on the Internet. Thus, ACTIVE is a general purchase platform that can host a wide variety of electronic stores for vendors. The infrastructure consists of a web server running Microsoft Internet Information Server (IIS), a Java application server (Allaire JSP Engine) and a Microsoft SQL server running RDBMS. The communication between the application server and the database is handled using the JDBC protocol.
18.1 Demonstration of the trade-o¤ tool and TBIAS
181
The IST EU project CORAS performed three risk assessments of ACTIVE in the period 2000-2003 (for details see [19]). The project looked into security risks of the user authentication mechanism, secure payment mechanism and the agent negotiation mechanisms of ACTIVE. Here, the focus is on the result of the …rst assessment which identi…ed the user authentication mechanism to be vulnerable to various types of Denial of Service (DoS) attacks and in particular the SYNACK ‡ooding attack [13]. This attack is well known and exploits a weakness in the TCP three-way handshake. The handshake works as follows: whenever a host receive a SYN message it replies with an ACK message and waits for the returning SYN message. If the returning SYN message does not arrive the connection is kept open. If an attacker sends several SYN messages and hence opens several connection with the host it will lead to a situation where too many connections are left open. Soon the bu¤er at the host is …lled up and the host is unable respond to any other requests. Thus, the host is busy waiting for messages that never arrive. There are several possible solutions to this security problem. The following sections demonstrates how to evaluate the …tness score of two such solutions using the AORDD security solution trade-o¤ analysis and the trustbased information aggregation schema. 18.1.1 Aggregating information as input to the trade-o¤ tool using the trust-based information aggregation schema As described in Part 5 the trust-based information aggregation schema consists of …ve steps. This section demonstrates the use of Step 1; specify trust context, Step 2; trust relationship between information sources and Step 5; aggregate information, of this schema to support choice of security solution. Step 1 of the trust-based information aggregation schema. Step 1 of the schema concerns the speci…cation of the trust context which is important to ensure that the information sources and the decision maker have the same understanding of the information provided and received. As described in Part 5 this is speci…ed as a set of trust purposes and assumptions in the trust context C. The trust context C must be the same to combine the various pieces of information provided by the information sources. However, before the trust context can be speci…ed the case description must be given, as described in Chapter 7. The goal in this context is to support a decisionmaker A in choosing between two security solutions for the DoS attack SYN ‡ooding. The two DoS security solutions are: (1) the cookie solution denoted s1 and (2) the …lter mechanism denoted s2 . The cookie solution is a patch to the network stack software that adds another message layer once the partial connection data structures become close to full. In this solution a cookie is sent
182
18. Validation of the Approach
to the client and the pending connection is removed from the data structure. If the client does not respond within a short period of time the cookie expires and the client must restart the TCP three-way handshake. If the client responds in time the SYN-ACK message is sent and the connection is set up as in the original case. Adding the cookie message makes it unlikely that an attacker can respond in time to continue setting up the connection. The cookie will expire on the server without taking up any storage in the data structures of the pending connections and if the client address has been spoofed the client will not respond in any event. In both cases the cookie will expire on the server without taking up any storage in the pending connections data structures. The DoS security solution …ltering mechanism consist of …ltering rules that controlles all inbound and outbound communication requests. These …ltering rules are contained in a software extension to the network stack software. So, rather than adding another message layer the …ltering mechanism adds a …ltering service to the network stack that works similar to a simple …rewall …ltering mechanism. This …ltering mechanism checks the source IP address of all inbound and outbound connections requests against a list of allowed IP addresses. By doing so the client will only allow communication from hosts that it trusts. However, the …ltering mechanism will not protect against DoS attacks from trusted hosts or DoS attacks that are routed through one or more trusted hosts. The above description represents a simple case description. In addition to the above a state transition diagram and associated transition probability matrix should also be modelled, as described in Chapter 7 and Houmb, Georg, France, Reddy and Bieman (2004) [43]. Before starting with the examination of the potential information sources and collecting the information, the trust context must be speci…ed. As described earlier the trust context speci…es under which circumstances the information sources will provide information on the problem according to the case description. This involves specifying the purpose and assumption, as described in Section 17.1. In this example there are a set of information sources B where bi represent information source number i and where all information sources provides information on the expected availability of the two DoS security solutions. The decision maker C is denoted A. The trust context for all trust relationships is denoted A ! bi and the trust context function C(T ) is a tuple of the form < ui ; ai > where ui 2 U and ai 2 A. To make the information possible to aggregate, the trust context for all information sources must be the same, meaning C(T )bi =C(T )bi+1 for all i. The purpose 8i ubi where 8i ubi 2 U of the trust relationships 8i A ! bi is that of: “The information source bi should provide correct and accurate information on the security attribute availability for each of the two security
18.1 Demonstration of the trade-o¤ tool and TBIAS
183
solutions: cookie solution and …ltering mechanism, separately according to the case description in terms of the anticipated number of successful DoS attacks with the respective security solution incorporated into the login mechanism for the ecommerce prototype per month. The assumptions 8i abi where 8i abi 2 A of the trust relationships 8i A ! bi is as following. Recall from Section 17.1 that the assumptions are comprised of four parts: (1) Decision maker’s understanding of the information request. (2) Information source’s understanding of the information request. (3) Decision maker’s understanding of the information provided. (4) Information source’s understanding of the information provided. For all information sources in set B their understanding of both the information request and information they are providing are the same, namely the number of successful DoS attacks per month for each of the security solutions. This refers to assumptions 2 and 4 for all information sources in the set B. The decision maker’s (A) understanding of the information he or she has requested and hence that should be provided by the information sources, is the number of successful DoS attacks per month for each of the security solutions. This refers to assumptions 1 and 3. This gives the trust context function: C(T ) = 8i < ubi ; abi > \ < ubi+1 ; abi+1 >=< ubi ; abi >=< ubi+1 ; abi+1 > (18.1) Step 2 of the trust-based information aggregation schema. Step 2 of the trust-based information aggregation schema is used to derive the relative information source trustworthiness weights. Before performing this step the information sources involved need to be identi…ed and described. This example uses …ve information sources where one is an observable information source and the four others are subjective information sources. The …ve sources are the real-time observable information source honeypot and four domain experts, which gives the following: fbhoneypot ; b4 ; b6 ; b15 ; b18 g 2 B. These …ve information sources provided information on the anticipated number of DoS attacks for the two involved DoS security solutions to the decision maker A according to the trust context speci…ed above. In addition to the …ve information sources there is one external source x in X to provide information on the calibration variables used and one external source y in Y that assesses each information source according to the calibration variables in Step 2. Details on the external sources are given in Section 17.2. The observable information source honeypot was set up to re‡ect the con…guration of ACTIVE (Windows NT 4.0 operating system and IIS 4.0). As a second layer of logging the Intrusion Detection System (IDS) Snort were used. For more information on the honeypot and its con…guration the reader is referred to Østvang (2003) [81]. The group of experts used was comprised of undergraduate
184
18. Validation of the Approach
students at Norwegian University of Science and Technology. Further information on the collection of expert judgments is provided in Houmb, Johnsen and Stålhane (2004) [49]. The reader should note that to make the example tractable only the judgments from 4 of the 18 domain experts involved in the experiement are included. For the information source ‘honeypot’information was extracted from the honeypot and the Snort log …les. Logging was done for the same amount of time, namely 24 hours for the three con…gurations: (1) system without any security solutions, (2) system with the patch to the network stack software: the cookie solution and (3) system with the …ltering mechanism. For con…guration (1) Snort detected 470 di¤erent IP addresses trying to open connections to port 80 which gives 470=24 = 19:8 attack tries per hour. Here, the interest is in the attack attempts where outsiders sent several SYN requests to the same source. 140 of the 470 IP-addresses sent series of SYN requests to the same source within 24 hours which gives 140=24 = 5:8 SYN ‡ooding attack attempts per hour. Two of the attack attempts were successful and thus MTTM=12:0 hours. The mean attack time (e¤ort) for the successful attacks is denoted mean e¤ort to misuse and was METM=0:2 hours. METM is a measure of the average time (clock time) it takes an attacker to perform the attack. MTTM is a measure for the average time (clock time) it takes between attacks. In this case it is the successful attacks that are taken into consideration and not the attack attempts. More information on MTTM and METM is given in Part 4 and Houmb, Georg, France, Reddy and Bieman (2005) [43]. Computed average monthly (assuming a 30 day month) successful attacks for (1) were 60. For the cookie solution (con…guration 2), the average monthly successful attacks observed was 1:5 and for the …ltering mechanism (con…guration 3), the average monthly successful attacks observed was 4:0. As the honeypot simulated these three con…gurations no updates were done between the attack attempts and successful attacks. However, this is usually done in a real system (otherwise the system would just keep on being attacked until it crashed). The information extracted from the log …les is used as the information provided from the information source bhoneypot when evaluating the two DoS security soC
lutions. The information source is assigned the trust value v(A ! bhoneypot ) = 1 which means completely trustworthy as honeypot is a directly observable information source that observes actual events and as the decision maker A has complete trust in the abilities of honeypot to provide accurate and correct information on the potential number of successful DoS attacks. This means that there is no need to calculate the knowledge and experience score for the information source honeypot and that the initial trustworthiness weight can be directly assigned as FinitT rust (bhoneypot ) = 1. This is done using the relative IS trustworthiness model
18.1 Demonstration of the trade-o¤ tool and TBIAS
185
5% 10 %
Domain A: security management
E Domain D
15 %
Domain B: network management Domain C: database
Domain C
Domain A
50 % Domain D: design
Domain B
Domain E: developer
20 %
Fig. 18.1. Reference knowledge domain model
described in Part 5. It should be noted however that honeypots are subject to the problem of simulating su¢ ciently realistic system environment and that IDSs are subject to the problem of false positives. Elicitation of expert judgments was done using a combined knowledge and expertise level questionnaire. The data provided on each expert for all variables in the questionnaire was then used to derive the knowledge and expertise score, as described in Sections 17.2.1 and 17.2.2. Table 18.1 shows the variables and the values provided for the combined questionnaire. For discussion on problems and possible biases related to the procedure of collecting expert judgment, see Cooke (1991) [16] and Cooke and Goossens (2000) [17]. As described in Section 17.2.1 the knowledge score for an information source is determined by comparing the information source knowledge domain models with the reference knowledge domain model. The reference knowledge domain model is created by combining the importance and coverage weights for the aggregated set of knowledge domains provided, by the set of external sources X, using the knowledge domain score model described in Section 17.2.1. The relevant knowledge domains are: security management, design, network manager, database and developer. Figure 18.1 shows the four knowledge domains and their internal relative importance. For demonstration purposes the focus is put on the result of the identi…cation rather than discussing techniques used to identify these knowledge domains. To provide data on each information source a domain expert that was not part of the expert judgment panel was used as the external source x1 2 X. This external
186
18. Validation of the Approach
Table 18.1. The combined knowledge and experience level questionnaire Expert number
Calibration variable
Information provided on bi
4
level of expertise
medium
years of relevant education
BSc
years of experience from industry
0
roles experience
database and security management
level of expertise
low
years of relevant education
BSc
years of experience from industry
0
roles experience
database
level of expertise
high
years of relevant education
BSc
years of experience from industry
0
roles experience
designer, developer and security management
level of expertise
low
years of relevant education
BSc
years of experience from industry
0,5
roles experience
developer
6
15
18
18.1 Demonstration of the trade-o¤ tool and TBIAS
187
source did the identi…cation based on prior experience in the domain of secure system development. Due to the subjective nature of this assessment and because the set of external sources X only consist of one external source x1 the potential biases need to be assessed. What is needed to reduce the degree of bias is to establish guidelines for knowledge domain identi…cation. This is the subject of further work. The importance weight for each of the knowledge domains is modelled using Equations 17.1, 17.2, 17.3 and 17.4 from the knowledge domain score model described in Section 17.2.1. This information is provided by x1 and according to Equation 17.1. This gives WKimp (x1 ) = [1; 0:5; 0:5; 0:2; 0:2]. The elements in the importance vector for x1 are then normalised in Equation 17.3 using the normalisation factor derived in Equation 17.2, which is qKimp 0:4. This gives WRKimp (x1 ) = [0:4; 0:2; 0:2; 0:1; 0:1]. As there is only one external source WaggrKimp (X) = WRKimp (x1 ). As can be seen in Figure 18.1 the coverage for the di¤erent knowledge domains in the reference knowledge domain model are: 50% for security management, 20% for network management, 15% for database, 10% for design and 5% for developer. The coverage vector is modelled using Equation 17.5 in the knowledge domain score model, which gives WKcov (x1 ) = [0:5; 0:2; 0:15; 0:1; 0:05]. As X only contains x1 and as the coverage weights are already normalised WaggrdKcov (X) = WRKcov (x1 ) = WKcov (x1 ). Based on the two above vectors the knowledge domain score for each of the knowledge domains is computed using Equation 17.9, which gives WinitKDscore (X) = [0:5 0:4; 0:2 0:2; 0:15 0:1; 0:1 0:1; 0:05 0:1] = [0:2; 0:04; 0:015; 0:01; 0:005]. These knowledge scores are then normalised in Equation 17.11 using the normalisation factor derived in Equation 17.10. The normalisation factor is: qinitKscore = 3:8 and the normalised vector is WDKscore (X) = [0:8; 0:2; 0:0; 0:0; 0:0]. Figure 18.2 shows the information source knowledge domain models for the four experts (the subjective information sources). The coverage that each of the experts have for the knowledge domains are the following: 80% on security management and 15% on database for expert 4. 100% on database for expert 6. 60% for design, 30% on developer and 10% for security management for expert 15. 100% on developer for expert 18. The knowledge level for each expert is computed using the information source knowledge domain score model described in Section 17.2.2 and Equation 17.16 in the knowledge score model. Using Equation 17.12 in the information source knowledge domain score model gives the information source knowledge domain vectors: Expert 4: b4 : Wis (y1 (b4 )) = [0:85; 0:0; 0:15; 0:0; 0:0] Expert 6: b6 : Wis (y1 (b6 )) = [0:0; 0:0; 1:0; 0:0; 0:0]
188
18. Validation of the Approach
Expert 15: b15 : Wis (y1 (b15 )) = [0:1; 0:0; 0:0; 0:6; 0:3] Expert 18: b18 : Wis (y1 (b18 )) = [0:0; 0:0; 0:0; 0:0; 1:0] As all information source knowledge domain vectors are already normalised, WRKis (y1 (bi )) = Wis (y1 (bi )) for all bi 2 B. And as there are only one external source y1 in the set of external source Y Equation 17.14 and 17.15 does not apply and thus FaggrKis (y1 (bi )) = Wis (y1 (bi )). The knowledge score for each of the information source are then derived using Equation 17.16 in the knowledge score model: Expert 4: b4 : WKscore (y1 (b4 )) = 0:85 0:8+0 0:2+0:15 0+0 0+0 0 Expert 6: b6 : WKscore (y1 (b6 )) = 0
0:8 + 0
0:2 + 1
0+0
0+0
0:7
0=0
Expert 15: b15 : WKscore (y1 (b15 )) = 0:1 0:8+0 0:2+0 0+0:6 0+0:3 0 = 0:08 0:1 Expert 18: b18 : WKscore (y1 (b18 )) = 0
0:8 + 0
0:2 + 0
0+0
0 + 1:0
0=0
These resulting knowledge scores are not normalised over the number of information sources in this example. The reason for this is to express the perceived level of knowledge rather than the normalised level, as this makes it easy to add in more information sources in B throughout the evaluation (recall that there were 18 experts and that only 4 of these are included in this example). The expertise level for an information source is derived using the calibration variables described in Table 18.1, as described in Section 17.2.2. First the importance weight for each of the categories for all calibration variables needs to be determined. This is done using the calibration variable category score model. In this example only three calibration variables is used to determine the expertise level, namely ‘level of experience’denoted v1 , ‘years of relevant education’denoted v2 and ‘years of experience from industry’denoted v3 . This gives the following vectors of categories for the three calibration variables according to Equation 17.17 in the calibration variable category score model from Section 17.2.2:
WEcat (x1 (v1 (k))) = [0 low0 ;0 medium0 ;0 high0 ] WEcat (x1 (v2 (k))) = [0 BSc0 ] WEcat (x1 (v3 )(k)) = [0 per_year0 ] Next the importance weight for each of the categories for all calibration variables is derived. This is done using Equations 17.18 through 17.21 in the calibration variable category score. For the calibration variable ‘level of experience’the
18.1 Demonstration of the trade-o¤ tool and TBIAS
189
Fig. 18.2. Information source knowledge domain models for experts 4, 6, 15 and 18
external source x1 provided the following importance weights: Wimp (x1 (v1 (k = ‘low’)) = 0:2, Wimp (x1 (v1 (k = ‘medium’)) = 0:5 and Wimp (x1 (v1 (k = ‘high’))) = 1:0. For the calibration variable ‘years of relevant education’ the importance weight given by x1 are Wimp (x1 (v2 (k = ‘BSc’))) = 0:2. For the calibration variable ‘years of experience from industry’ the importance weight given by x1 is Wimp (x1 (v3 (k = ‘per_year’))) = 0:2 for each year of industrial experience. As for the category vectors the aggregated vectors equals the vectors for the external source x1 , as x1 is the only external source in X. Before aggregating though, the vectors needs to be internally normalised. This gives the following normalised aggregated vectors: WaggrEimp (X(v1 (k))) = [0:1; 0:3; 0:6] WaggrEimp (X(v2 (k)) = [1:0] WaggrEimp (X(v3 (k)) = [1:0] Before computing the expertise score for each information source the external sources yi 2 Y provide data sets for all bi 2 B . As for the knowledge score only one external source is used and this is yi . The information provided by y1 is shown in Table 18.1 and the information source calibration variable category score model in Section 17.2.2 is used to derive the information source speci…c score
190
18. Validation of the Approach
for each of the categories for all three calibration variables. As when deriving the knowledge score each variable for each information source is modelled as vectors. In this case Equation 22 in the information source calibration variable category score model is used to derive the set of vectors. Expert 4: WEis (b4 (v1 (k))) = [0 medium0 ], WEis (b4 (v2 (k))) = [0 BSc0 ] and WEis (b4 (v3(k))) = [0] Expert 6: WEis (b6 (v1 (k))) = [0 low0 ], WEis (b6 (v2 (k))) = [0 BSc0 ] and WEis (b6 (v3 (k)) = [0] Expert 15: WEis (b15 (v1 (k))) = [0 high0 ], WEis (b15 (v2 (k))) = [0 BSc0 ] and WEis (b15 (v3 (k)) = [0] Expert 18: WEis (b18 (v1 (k))) = [0 high0 ], WEis (b18 (v2 (k))) = [0 BSc0 ] and WEis (b18 (v3 (k)) = [0:5] As there are only y1 in Y , there is no need to aggregate information over Y and WaggrEiS (Y (bi (v(k))) = WEis (y1 (b1 (v(k))) for all k. The expertise score for the information sources are then computed using Equation 17.26 in the the expertise score model which gives: Expert 4: FEscore (b4 (v1 (k))) = [0:3], FEscore (b4 (v2 (k))) = [1:0], FEscore (b4 (v3 (k))) = [0:0] and FEscore (b4 ) = (0:3 + 1:0 + 0:0)=3 = 0:4 Expert 6: FEscore (b6 (v1 (k))) = [0:1], FEscore (b6 (v2 (k))) = [1:0], FEscore (b6 (v3 (k))) = [0:0] and FEscore (b6 ) = (0:1 + 1:0 + 0:0)=3 = 0:4 Expert 15: FEscore (b15 (v1 (k))) = [0:6], FEscore (b15 (v2 (k))) = [1:0], FEscore (b4 (v3 (k))) = [0:0] and FEscore (b15 = (0:6 + 1:0 + 0:0)=3 = 0:5 Expert 18: FEscore (b18 (v1 (k))) = [0:6], FEscore (b18 (v2 (k))) = [1:0], FEscore (b18 (v3 (k))) = [0:1] and FEscore (b18 = (0:6 + 1:0 + 0:1)=3 = 0:6 Now both the knowledge and expertise score are derived for all …ve information sources. These two scores are then combined when estimating information source relative trustworthiness using the relative IS trustworthiness model described in Section 17.2.3. Recall that the initial trustworthiness for the information source honeypot was set to FinitT rust (bhoneypot ) = 1:0. The initial trustworthiness for the four experts are derived using Equation 17.27 in the relative IS trustworthiness model which combines the knowledge score for bi with its expertise score. As there are no previous experience on the use of y1 to assess B, the error function "bi = 0 for all bi 2 B. See Section 17.2.3 for details. This gives: Honeypot: FinitT rust (bhoneypot ) = 1:0
18.1 Demonstration of the trade-o¤ tool and TBIAS
191
Expert 4: FinitT rust (b4 ) = (0:7 + 0:4)=2 = 0:6 Expert 6: FinitT rust (b6 ) = (0:0 + 0:4)=2 = 0:2 Expert 15: FinitT rust (b15 ) = (0:08 + 0:5)=2 = 0:3 Expert 18: FinitT rust (b18 ) = (0:0 + 0:6)=2 = 0:3 These initial trustworthiness weights are normalised in Equation 17.29 using the normalisation factor derived in Equation 17.28, which is qRT rust = 1=(1:0 + 0:6 + 0:2 + 0:3 + 0:3) = 0:4. This gives the following updated relative trustworthiness weights: Honeypot: FIST W (bhoneypot = 1:0
0:4 = 0:4
Expert 4: FIST W (b4 ) = 0:6
0:4 = 0:3
Expert 6: FIST W (b6 ) = 0:2
0:4 = 0:1
Expert 15: FIST W (b15 ) = 0:3
0:4 = 0:1
Expert 18: FIST W (b18 ) = 0:3
0:4 = 0:1
As can be seen by the above results the information source relative trustworthiness weights re‡ect the information provided on each source’s knowledge domains and level of expertise. In this example expert 4 possesses two knowledge domains where one of the domains is security management which is assigned a high level of importance. Expert 4 also has a medium level of expertise. It is therefore reasonable that expert 4 is given a higher trustworthiness weight than expert 18 as expert 18 has a low level of expertise and only covers one knowledge domain for which are given a low level of importance. As also can be seen by the result it is not possible to distinguish between expert 6, 15 and 18. This is also reasonable taking into account that their knowledge domains and level of expertise combined equals out the di¤erences. This concludes Step 2 of the trust-based information aggregation schema. Step 5 of the trust-based information aggregation schema. In Step 5 of the trust-based information aggregation schema the information source relative trustworthiness weights derived in Step 2 is applied to the information provided by each information source. Step 5 is thus the link between the trust-based information aggregation schema and the trade-o¤ tool in the AORDD framework. However, note that it is possible to apply an equal weighting information aggregation schema and thus directly insert the information into the relevant variable in the BBN topology of the trade-o¤ tool. The reason why the trust-based information aggregation schema is introduced is to distinguish between information sources and to make use of disparate information sources.
192
18. Validation of the Approach
Recall that the information provided from the information source honeypot was for the misuse variables M T T M and M ET M and the security solution variables E¤ ect on METM and E¤ ect on MTTM while the four experts provided information on the security level of the e-commerce system taken both the misuse SYN attack and the two security solutions into consideration. This means that the pieces of information provided goes into di¤erent variables in the BBN topology of the trade-o¤ analysis. However, before populating the BBN topology with information each piece of information provided must be made relative using the information source trustworthiness weights derived in Step 2. This is what is done in Step 5 of the trust-based information aggregation schema. The information provided by bhoneypot was bhoneypot (s1 ) = 1:5 and bhoneypot (s2 ) = 4:0 (s1 =‘cookie_solution’and s2 =‘f ilter_mecha nism’). The information provided by b4 was b4 (s1 ) =‘medium’and b4 (s2 ) =‘low’. The information provided by b6 was b6 (s1 ) =‘medium’ and b6 (s2 ) =‘medium’. The information provided by b15 was b15 (s1 ) =‘medium’and b15 (s2 ) =‘low’. The information provided by b18 was b18 (s1 ) =‘high’and b18 (s2 ) =‘low’. These pieces of information are then updated with the trustworthiness weights, which gives: bhoneypot (s1 ) = 1:5 and bhoneypot (s2 ) = 4:0 at a relative weight of 0:4 (this is interpreted as the state ‘high’ for s1 and ‘low’ for s2 in the reminder of this example) b4 (s1 ) =‘medium’ at a relative weight of 0:3 and b4 (s2 ) =‘low’ at a relative weight of 0:3 b6 (s1 ) =‘medium’at a relative weight of 0:1 and b6 (s2 ) =‘medium’at a relative weight of 0:1 b15 (s1 ) =‘medium’ at a relative weight of 0:1 and b15 (s2 ) =‘low’at a relative weight of 0:1 b18 (s1 ) =‘high’ at a relative weight of 0:1 and b18 (s2 ) =‘low’ at a relative weight of 0:1 The important thing to note is that the trustworthiness weight cannot directly be combined with the information provided. This is because the trustworthiness weights do not denote a probability, but the relative weight of each of the information sources. Thus, b4 (s1 ) =‘medium’at a relative weight of 0:1 does not mean that the state is ‘medium’with a probability P = 0:1, but that the information provided by expert 4 should contribute with 0:1 to the outcome of the variable it is inserted into in the BBN topology of the trade-o¤ tool. The information is thus aggregated by taking the contribution factor of each piece of information. To make this tractable Step 5 is implemented as a BBN that are connected to
18.1 Demonstration of the trade-o¤ tool and TBIAS
193
Fig. 18.3. Information inserted and propagated for security solution s1 (cookie solution)
Fig. 18.4. Information inserted and propagated for security solution s2 (…lter mechanism)
the BBN topology of the trade-o¤ tool for the AORDD security solution trade-o¤ analysis. Figure 18.3 shows the BBN implementation of Step 5 with the information for s1 entered and propagated through the network using the utility function ‘Step 5 Utility’ while Figure 18.4 shows the same for the security solution s2 .
194
18. Validation of the Approach
Fig. 18.5. The top-level network of the trade-o¤ tool BBN topology
18.1.2 Tradeing o¤ two DoS security solutions using the trade-o¤ tool BBN topology The AORDD security solution trade-o¤ analysis is implemented as the tradeo¤ tool BBN topology as described in Part 4. The overall goal of the trade-o¤ analysis is to support a decision maker in identifying the best-…tted security solution among alternatives taken security, development, project and …nancial perspectives into consideration. This is done by deriving and comparing security solution …tness scores. The following gives a demonstration of the use of the tradeo¤ tool BBN topology to evaluate the …tness of the two DoS security solutions s1 =‘cookie_solution’ and s2 =‘f ilter_mechanism’ for the misuse TCP SYN ‡ooding attack, as described in the previous sections. Figure 18.5 shows the top-level network of the trade-o¤ tool BBN topology from Part 4. The AORDD trade-o¤ analysis method takes the output from the trustbased information aggregation schema as demonstrated in the previous section as input and follows the seven step trade-o¤ procedure described in Chapter 14. In addition, the development, project and …nancial perspectives are added along with any other relevant information available. Step 1 in the trade-o¤ analysis method procedure is to estimate the input parameters in the set I where I = fM I; M F; M T T M; M ET M; M C; SE; SCg. The variables MI, MF, MTTM, METM and MC are misuse variables in the risk level subnet (modelled as the input node Risk Level (RI) in Figure 18.5) while the variables SE and SC are security solution variables in the security solution treatment level subnet (modelled as the Security Solution Treatment Level (SSTL) input
18.1 Demonstration of the trade-o¤ tool and TBIAS
195
Fig. 18.6. The resulting risk level
node in Figure 18.5). The information given for these variables was presented and aggregated using the trust-based information aggregation schema in the previous section. The result of the information aggregation is the treatment level of s1 and s2 which is inserted directly into the intermediate node treatment e¤ect and cost in the top-level network. See previous sections for details. Step 2 in the trade-o¤ analysis method procedure is to estimate the security level of the ToE or case description before any security risks or security solutions have been considered. This is done using the assurance functional components of Common Criteria Part 3. As no such information is available in this example the SSLE subnet is not included when deriving the …tness scores of s1 and s2 . In Step 3 of the trade-o¤ analysis method the misuse variables information from Step 1 is inserted into the risk level subnet. In this example only the misuse variable M ET M and M T T M are considered (static security level). These where identi…ed to be M ET M =‘low’and M T T M =‘low’. Details are given in Houmb, Georg, France, Reddy and Bieman (2005). Figure 18.6 shows the resulting risk level when these two pieces of information has been entered as evidence into the network. Note that Figure 18.6 shows a re…ned version of the RL subnet where only the M ET M and M T T M variables are taken into consideration when deriving the risk level. In Step 4 of the trade-o¤ analysis method, the information on the security solution variables from Step 1 is inserted into the security solution treatment level subnet. As the security e¤ect is measured using the sub-variables SE on METM, SE on MTTM, SE on MI and SE on MF the SE variable is modelled as an intermediate node in the SSTL subnet with these four sub-variables as observable nodes that provides information to the SE node. As there are no information available on
196
18. Validation of the Approach
Fig. 18.7. The resulting security solution treatment level for the security solution s1 with the information from the information sources inserted and propagated
Fig. 18.8. The resulting security solution treatment level for the security solution s2 with the information from the information sources inserted and propagated
the cost of the two DoS security solutions s1 and s2 the SSTL subnet is re…ned and includes only the relevant variables in this example. Figure 18.7 shows the resulting security solution treatment level for the security solution s1 with the SE information inserted and propagated while Figure 18.8 shows the same for security solution s2 . Details on the computation of the resulting NPT for both s1 and s2 are given in Figure 18.9. Note that the information inserted in the SSTL subnets for s1 and s2 are the result from Step 5 in the trust-based information aggregation schema from the previous section. In Step 5 of the trade-o¤ analysis method the trade-o¤ parameters in the TOP subnet is estimated. The trade-o¤ parameters are modelled as the set T where
18.1 Demonstration of the trade-o¤ tool and TBIAS
197
Fig. 18.9. Details on the computations made for the Security Solution E¤ect node for security solution s1 and security solution s2
T = fSAC; P OL; ST A; LR; BG; T T M; BU; P RIg. These are the development, project and …nancial perspectives included in the trade-o¤ analysis and modelled as variables in the TOP subnet of the trade-o¤ tool BBN topology. To limit the scope and to show the ‡exibility of the trade-o¤ analysis, only three of the trade-o¤ parameters are considered in this example. These are security acceptance criteria (SAC), budget and TTM. Figure 18.10 shows the nodes with the prior node probability distributions of the re…ned TOP subnet. The SAC variable is used to specify acceptable risk level or the security requirements that must be ful…lled. The budget and TTM variables are used to specify the budget available for risk mitigation and the date or days or similar when the system should be launched on the market. All three variables can be estimated using either qualitative or quantitative values. The trade-o¤ tool supports both but in this example qualitative values are used for the estimation of all variables involved. As can be seen in this …gure the variable SAC is an intermediate node in the TOP subnet and has sub-variables associated to it. These are the seven security attributes con…dentiality, integrity, availability, authenticity, accountability, nonrepudiation and reliability. Each of these seven sub-variables has four associated states and the outcome of the states of all seven sub-variables determines the state of the SAC variable. Security requirements are usually given according to the system assets and their perceived and desired security properties. To simplify the example neither the system assets nor the Common Criteria security assurance components which are part of the SSLE subnet of the trade-o¤ tool BBN topology and estimated in Step 2 of the trade-o¤ analysis method procedure are taken into consideration in this example. Details on the assets and the user authentication mechanism are in Houmb et al. (2005) enclosed as Appendix B.3 and Houmb, Ray and Ray (2006) enclosed as Appendix B.4.
198
18. Validation of the Approach
Fig. 18.10. TOP subnet with prior probability distributions
Here, the security requirements are derived from the trust context and the case description from previous section. This given the following security requirement: “To preserve the availability of the user authentication mechanism”. Interpreted in the context of the security acceptance criteria this means that the SAC subvariable ‘Availability’must be in the ‘high’state. As no other requirements are given the other sub-variables to SAC is put in the state ‘N/A’, which means not applicable. Figure 18.11 shows the status in the TOP subnet when the security requirements information is entered into the TOP subnet and propagated from the observable nodes. Note that only the sub-variable ‘Availability’is included in the …gure. The information for the budget and TTM variables can be extracted from several sources, such as project plans. The information can also be provided by any of the stakeholders involved in the development. In this example the decision maker provides these two pieces information, which is the following: budget =‘medium’ and T T M =‘short’. This means that the budget available for risk mitigation is medium and that the time until the ToE should be launched on the market is short. In practice this means that a security solution that is easy and quick to employ is preferable as long as the cost is not unreasonable. Before the result of the TOP subnet can be transferred to the TOP input node in the top-level network the priorities list of trade-o¤ parameters must be derived. This is the task of the TOP Priorities decision node and assisted by the TOP Priorities Utility node. This construct of a decision and utility nodes pair give ‡exibility in specifying the relationship between the input variables of the decision node, which is the target node of the TOP subnet in this context. Rule sets for
18.1 Demonstration of the trade-o¤ tool and TBIAS
199
Fig. 18.11. Status of TOP subnet when security requirement information is entered and propagated
prioritising trade-o¤ parameter are speci…ed in the utility node, which is modelled as a diamond in the …gure. The rules speci…ed in this example are given by the decision maker and is the following: priority 1 is given to TTM, priority 2 is given to security requirements and priority 3 is given to budget. These are the rules speci…ed in the TOP Priorities Utility. Figure 18.12 shows the TOP subnet with SAC, budget and TTM information inserted and propagated to derive the resulting prioritised list of trade-o¤ parameters. As can be seen in Figure 18.12 the TOP subnet is structured into three layers: the observable node layer, the intermediate node layer and the target node layer. Observable nodes are where information or evidence is entered into the network while intermediate nodes are the nodes that connects the aim and questions that the network is to provide answers to, which is modelled as the target node, with the information entered into the observable nodes. Hence, the intermediate nodes specify the relation and e¤ect that the observations has on the target of the network. For the TOP subnet the target is to derive the trade-o¤ parameter priorities so that a prioritised list of the trade-o¤ parameters can be fed into the top-level network in the trade-o¤ tool BBN topology.
200
18. Validation of the Approach
Fig. 18.12. Evidence, propagation and result for the TOP subnet
Information or evidence is marked with an e on the observable nodes in Figure 18.11. The information is then propagated to the target node. For the observable nodes budget and TTM information is propagated directly to the target node. For the sub-variables of SAC the information is propagated through the intermediate node SAC. Propagation is the act of updating the prior probability distributions of the target or intermediate nodes in a network with the information entered at the observable nodes to derive the posterior probability distributions, distribution functions and expected utilities. Four di¤erent propagation algorithms are available: Sum normal, max normal, sum fast retraction and max fast retraction. In this example the sum normal propagation is used. See Jensen (1996) [59] for details. In Step 6 of the trade-o¤ analysis method the security solution …tness scores are derived. This is done by transferring the result from the SSLE, RL, SSTL and TOP subnets to the relevant nodes in the top-level network, add any new information to the network and then compute the …tness score for each security solution. As for the subnets in the BBN topology the top-level network is comprised of observable nodes, intermediate nodes and a target node. The target node is the decision node Fitness score (see Figure 18.13). Also as for the subnets the top-level network has a target node comprised of a decision and utility nodes pair and the …tness score of a security solution is derived by propagating information from observable nodes, through intermediate nodes and to the Fitness Score Utility node. This node is used to specify relational functions, such as If-
18.1 Demonstration of the trade-o¤ tool and TBIAS
201
Fig. 18.13. Fitness score for s1 (cookie solution)
Fig. 18.14. Fitness score for s2 (‡itering mechanism)
Then-Else constructs, for the incoming arches to the decision node and computes the …tness score using a propagation algorithm. Figure 18.13 and 18.14 show the resulting …tness score for the security solutions s1 and s2 respectively. In Step 7 of the trade-o¤ analysis method the …tness score for each alternative security solution is derived and compared to identify the best-…tted alternative. As can be seen in Figure 18.13 and 18.14 the …tness score for the cookie solution
202
18. Validation of the Approach
is slightly higher than for the …ltering mechanism. The …tness score for the cookie solution is believed to be high 54% of the time and low 17% of the time. For the …ltering mechanism the belief is that the …tness score is high 40% of the time and low 30% of the time. This result con…rms with the observations made by the information source honeypot, as discussed earlier. However, the outcome of the computation in the network is highly sensitive to the structure of the BBN topology, the con…guration of the utility nodes and the propagation algorithm used. This means that this issue must be handled with care. For example, for the utility nodes a sensitivity analysis should be performed to check the magnitude of the impact that changes in the network have on the outcome.
19. Discussion
It is generally recognised that subjectivity is inherent to any risk and security assessment methodology and that there are no single correct approach to identifying security risks, as the choice of model and its contained parameters can never by fully objective. So, rather than trying to formally prove the correctness of the AORDD framework and its two core components; the AORDD security solution trade-o¤ analysis and the trust-based information aggregation schema, this work followed an action research type work process that integrated validation and evaluation as part of the work process both for the initial explorative phase and for the development and evaluation phase as described in Section 1.4. The evaluation performed in this work is done in a research context using three case studies by example and did not include any industrial evaluation. Also as discussed earlier the evaluation focused on examining the feasibility, scalability and applicability of the approach developed and on reasoning about the validity of the approach, in relation to the research questions of this work. Details on the example-runs and parts of the result from the third example-run was given in Chapter 18. The …rst and second example-run is documented in Houmb et al. (2005) [44] and Houmb et al. (2006) [48] enclosed as Appendix B.3 and B.2 respectively. There exist several evaluations strategies for evaluating results of a subjective nature. According to McGrath (1984) [58] there are three general perspectives that are important when evaluation such results and these are: (1) Generalising the validation evidence. (2) Precision of the measurement used. (3) Realism of context. McGrath also lists and categories eight evaluations strategies according to these three research features. These are laboratory experiment, experimental simulations, …eld experiments, …eld studies, computer simulations, formal theory, sample survey and judgment studies. This work has performed three …eld studies or actually simulation example …eld studies in the context of the action research based work process followed. To ensure proper quality of the result throughout this work, relevant evaluation criterion from the three categories above was assessed to examine the degree of
204
19. Discussion
internal, construct and conclusion validity of the approach. For information on validity of evaluation and research result see Wohlin et al. (2000) [12]. Generalising validation evidence is important in research to make sure that the results and evaluation of the work is applicable outside of the speci…c context that the work has been performed under. This concerns the external applicability of the approach developed and the structured identi…cation of any assumptions made during the work and weather these are reasonable for the context that the work is intended for. This is done by examining the feasibility, scalability and applicability of the AORDD framework and its two core components and the result of the validation of the approach through the example-driven …eld studies. The second and third evaluation perspective: precision of measurement and realism of context, are addressed in relation to internal, construct and conclusion validity. Bellow are the de…nition of the evaluation perspectives undertaken in this work. All de…nitions are from Thesaurus. De…nition Feasibility is the quality of being doable. De…nition Applicability is the relevance by virtue of being applicable to the matter at hand where applicable is the capability of being applied or having relevance. De…nition Scalability is the quality of being scalable, where scalable is the capability of being scaled or that it is possible to scale. De…nition Validity is the property of being strong and healthy in constitution. As the work process followed in this work is both iterative and includes explicit evaluation sessions a set of evaluation criteria targeting the above de…ned evaluation perspectives, for each of the three evaluation categories was speci…ed as part of the two …rst iterations of the work process. This led to the following evaluation criteria: Generalising validation evidence: EvC.1 on feasibility: To what level is the AORDD framework and its two core components e¢ cient to use in practice. EvC.2 on feasibility: To what degree is the AORDD framework and its two core components easy to use for the decision maker. EvC.3 on applicability: To what level does the AORDD framework and its two core components address all relevant security aspects and important development factors.
19. Discussion
205
EvC.4 on applicability: To what degree is the AORDD framework and its two core components able to produce realistic and usable results. EvC.5 on scalability: To what level is the AORDD framework and its two core components able to address small and medium as well as large and very complex systems. Precision of measurement and Realism of context: EvC.6 on internal validity: To what degree does the work process and evaluation strategy followed in this work contribute to su¢ ciently address the four research questions. EvC.7 on construction and conclusion validity: To what degree is the contributions of this work (the AORDD framework and its two core components) capable to su¢ ciently address the four research questions. Recall that the main contributions of this work are incorporated into the AORDD framework and its two core components; the AORDD security solution trade-o¤ analysis and the trust-based information aggregation schema. The evaluation criteria are thus applied on these rather than on each of the contributions separately. EvC.1 looks into the feasibility perspective and concerns to what level the AORDD framework and its two core components are e¢ cient to use in practice. This issue has been addressed through the layer-wise structure of the underlying trade-o¤ analysis method for the AORDD security solution trade-o¤ analysis and the separation of concerns in the underlying trade-o¤ procedure for the AORDD security solution trade-o¤ analysis. The trade-o¤ tool BBN topology, which is the implementation of the AORDD security solution trade-o¤ analysis, has adopted both this layer-wise structure and the separation of concern in practice and hence the di¤erent parts of the trade-o¤ analysis can be executed simultaneously. Furthermore, the trust-based information aggregation schema is also layer-based and can be executed in parts or in complete depending on the characteristics of the information that needs to be aggregated. This means that separation of concerns is also achieved in the information aggregation. This enables the decision maker to use only the parts of the approach that are relevant to his or her problem and to focus on small independent tasks as the tool takes care of the dependencies by the way it is structured. The approach also allows the decision maker to observe what is going on and to get guidance on what type of information that are needed as well as make him or her able to input whatever information available. The approach developed in this work can thus also take the role of a security analyst for the decision maker (usually only for designer or developer type of decision makers as management level decision makers usually do not have su¢ cient knowledge to understand the technical implications of what they observe).
206
19. Discussion
The trade-o¤ tool BBN topology is designed in the context of security evaluation and focuses on providing con…dence in the ful…lment of the security, development, project and …nancial perspectives posed upon an information system. As current security evaluation approaches are both time and resource exhaustive the goal of the security evaluation approach developed in this work has been to come up with a cost and resource e¤ective way of comparing security solutions in practice. However, as both the AORDD security solution trade-o¤ analysis and the trust-based information aggregation schema still involves a substantial amount of manual tasks, further work is needed on automating more of the tasks involved before this goal can be achieved. The trust-based information aggregation schema which is used to aggregate the information inserted into the tool is able to aggregate disparate types of information. However, the schema is somewhat di¢ cult to use when the number of external sources involved, in evaluating the calibration variables and the abilities of each information source according to these calibration variables, are large. The reason for this is that when the number of external sources grows it becomes di¢ cult to keep track of and separate the calibration information from the information provided on the abilities of the information sources according to the calibration variables. Currently the schema performs best when only one external source in each of the two sets of external sources X and Y is used and when limiting the number of steps included from the schema. Hence, further work is needed on more clearly separating the calibration information from the information provided on the information sources. EvC.2 concerns the feasibility perspective and whether the AORDD framework and its two core components is easy to use for the decision maker. This is one of the most critical factors for an approach to successfully making it in the industry. Any approach targeting industrial use must successfully balance su¢ cient complexity with being intuitive and easy to use. Usability is in IEEE Computer Dictionary - Compilation of IEEE Standard Computer Glossaries [53] de…ned as “the ease with which a user can learn to operate, prepare inputs for and interpret outputs of a system or component”. The user in the context of this work is the decision maker and through the …eld studies the approach developed has been demonstrated and described with the aim of making the approach concrete and showing how to use it in practice. However, the trade-o¤ tool BBN topology and the trust-based information aggregation schema is currently at an early prototype stage, involve a substantial amount of manual tasks and hence do not yet ful…l the usability requirement. The ultimate goal for work such as this is to provide the decision maker with a “one button”interface for choosing a security solution among alternatives where the tool keeps control of the provided and necessary information and automati-
19. Discussion
207
cally learns from experience. If this was the case the tool could simply show the decision maker how it reasoned about the decision problem and through that activity establish a high trust relationship with the decision maker. However, this goal is for now not very realistic and a substantial amount of further work is needed before this overall goal can be achieved. EvC.3 concerns whether all relevant security concerns are covered. The relevant security concerns was identi…ed during the requirements phase in the initial explorative phase of this work and are captured in the static security level (SSLE) subnet, risk level (RL) subnet and the security solution treatment level (SSTL) subnet of the trade-o¤ tool BBN topology. Recall from Chapter 15 that the tradeo¤ tool BBN topology materialise the underlying trade-o¤ method and procedure of the AORDD security solution trade-o¤ analysis. The same is the case for the relevant development, project and …nancial perspectives. These perspectives are incorporated as the trade-o¤ parameters in the TOP subnet of the trade-o¤ tool BBN topology. However, so far no extensive analysis on whether the perspectives included cover all relevant perspectives has been performed. This is a clear weakness of this work and might have consequences for the applicability of the result of this work in practice. Thus, further work should include a realistic study to identify additional security, development, project and …nancial perspectives that should be taken into consideration in security solution decision situations. This can be done either by using semi-structured interviews with decision makers from several companies or as a series of realistic case studies performed in an action research context. The problems related to company con…dentiality made a more realistic setting for evaluation of the approach di¢ cult, but should nevertheless have be attempted. What is important in this context is to address the issue of company con…dentiality up front and to ensure that any agreements are legally documented on paper. EvC.4 concerns the applicability of the approach in terms of the capabilities of the AORDD framework and its two core components to produce realistic and usable results. The …eld studies performed are documented in various papers and have shown to produce realistic and usable results based on subjective domain expertise and the argumentation provided in these papers. However, the …eld studies are limited in that they only look into simplistic security solution decision situations and do therefore not su¢ ciently address the additional problems with con‡icting stakeholder interests. Please consult Houmb et al. (2006) [48] in Appendix B.2, Houmb et al. (2005) [44] in Appendix B.3, Georg, Houmb and Ray (2006) [35] and Houmb, Ray and Ray (2006) [45] for details. EvC.5 concerns the scalability of the AORDD framework and its two core components. This issue has only been investigated to some degree in this work by looking into di¤erent abstraction levels of security solution decisions situations.
208
19. Discussion
The levels of abstractions investigated range from technology speci…c security mechanisms (technology viewpoint in RM-ODP) to the security strategy level (enterprise viewpoint in RM-ODP) for the design phase of a development. The examples used are limited to small size information systems and thus this work makes no claim to support medium, large and complex information systems as this issue has not yet been addressed properly. Tool support and automation is an important factor for scalability and have been provided for the AORDD security solution trade-o¤ analysis and the trust-based information aggregation schema. However, the fact that a small scale prototype for parts of the security solution decision framework has been developed does not imply that the approach automatically is applicable outside of small size information system. Examining the scalability issue is ongoing work and it therefore su¢ ce to say that the believe is that the approach will scale to some degree and that both the trade-o¤ analysis and the information aggregation schema will be able to work su¢ ciently e¢ cient for medium to large information systems, provided that more of the manual tasks involved are automated. EvC.6 concerns the internal validity of the result of this work. The result of this work is the …ve contributions incorporated into the AORDD framework and its two core components, as discussed earlier. The internal validity is thus an evaluation perspective that aims at examining the degree that these results meet the four research questions of this work. The latter points to the quality of the result and on whether this quality has been unbiased examination of this quality have been performed. Thus, in this work the internal validity is examined by looking into whether the work and evaluation process followed su¢ ciently ensures a non-bias examination. As discussed in Section 1.4 the results of this work are developed and evaluated using an action research based work process that includes a separate evaluation phase. This work process was iterated three times with evaluation by simulation case study for all iterations, as discussed earlier. The main problem with this work is the lack of industrial validation. This was not carried out as it was considered to be too time consuming and with too many challenges not directly related to the actual evaluation of the result. Instead three simulation case studies were performed as part of the evaluation phase of the work process. The goal with these case studies was to demonstrate the feasibility and applicability of the approach and to discover problems with the current results, in each of the three iterations. The quality of the result has thus been demonstrated to some extend. However, this does not represent a su¢ cient evaluation and more empirical evidence is needed until a conclusion can be drawn. It su¢ ces to say that the work and evaluation process was design to bring in several roles during the process and to examine the results from several perspectives. However, in practice all evaluation
19. Discussion
209
and the evaluation meetings were performed by the same people as those that developed the approach. For details and more discussion, see Houmb et al. (2005) [44], Georg, Houmb and Ray (2006) [35], Houmb et al. (2006) [48] and future work in Chapter 20. EvC.7 concerns the construction and conclusion validity which in this work points to the degree that the contributions of this work (the AORDD framework and its two core components) are capable to su¢ ciently address the four research questions. This can also be referred to as the completeness of the results in relation to the research questions. The construction validity is in this work interpreted as the degree that the resulting constructs meet the research questions while the conclusion validity concerns whether the conclusion drawn on the ful…lment of the research questions are sound and un-biased. The latter means that the conclusions need to be drawn based on empirical evidence or un-biased reasoning and not merely be based on subjective belief. This work had four research questions and these are: RQ.1: How can alternative security solutions be evaluated against each other to identify the most e¤ective alternative? RQ.2: How can security risk impact and the e¤ect of security solutions be measured? RQ.3: Which development, project and …nancial perspectives are relevant for an information system and how can these be represented in the context of identifying the most e¤ective security solution among alternatives? RQ.4: How can the disparate information involved in RQ1, RQ2 and RQ3 be combined such that the most e¤ective security solution among alternatives can be identi…ed? As these four research questions cover a large spectre of challenges, this work used an iterative work process that re…ned the research questions as new results was developed and new challenges appeared. After three iterations through the work process, the …nal result consisted of the following …ve contributions. C.1: A set of security risk variables. C.2: A set of security solution variables. C.3: A set of trade-o¤ parameter variables to represent and measure relevant development, project and …nancial perspectives. C.4: Methodology and tool-support for comparing the security solution variables with the security risk variables to identify how e¤ective a security solution is in protecting against the relevant undesired behaviour (misuse). C.5: Methodology and tool-support for trading o¤ security solutions and identifying the best-…tted one(s) based on security, development, project and …nancial perspectives. These …ve contributions were all incorporated into the AORDD framework and its two core components and have all been materialised as described in Parts 3, 4 and 5. All …ve results are directly related to one or more of the research questions. C.1, C.2 and C.4 address RQ.1 and RQ.2 while C.3 and C.5 address RQ.3 and RQ.4 and C.5 addresses RQ.4.
210
19. Discussion
The resulting constructs representing C.1-C.5 in the AORDD framework have all been evaluated three times in the three case studies by examples. These examples have demonstrated the feasibility and applicability of the approach, as well as demonstrate how each of the research questions has been addressed. The conclusion from these three case studies are that the approach developed represent an increased support for the decision maker when choosing among alternative security solutions and thus the conclusion is that C.1-C.5 meet the objective of this work to a su¢ cient degree. Details can be found in Houmb et al. (2005) [44] in Appendix B.3, Georg, Houmb and Ray (2006) [35], Houmb et al. (2006) [48] in Appendix B.2 and Chapter 18.
19.1 Related work In the domain of security solution decision support there are …ve main categories of techniques that are of relevance. These are operational and quantitative measurement of security, security risk assessment, security management standards, security evaluation and certi…cation approaches such as the Common Criteria and architectural or design trade-o¤ analysis. The …rst major step towards techniques for measuring operational security was described in Littlewood et al. (1993) [74]. In this paper the authors argue strongly for the importance of extending the capabilities of current security evaluation approaches with techniques for quantitatively measuring the perceived level of operational security, rather than merely providing a subjective and qualitative measure of security. The concept of operational security level points to the perceived level of security in a system when deployed in its future or current security environment. To meet these challenges the paper provides an initial model that use the experience in the reliability domain and that computes quantitative security measures by the use of traditional probability theory. The quantitative security measures discussed are mean time to successful security attacks and mean e¤ort to successful security attacks. These concepts are further explored by Ortalo et al. (1999) in [80], Madan et al. (2002) [75] and Wang et al. (2003) [104]. In [80] Ortalo et al. (1999) provides a quantitative model for known Unix security vulnerabilities using a privilege graph using the ideas from [74]. The privilege graph is transformed into a Markov chain and examined using Markov analysis. These idea is then taken a step further in Madan et al. (2002) [75]. This paper also discusses how to quantify security attributes of software systems using traditional reliability theory for modelling random processes, such as stochastic modelling and Markov analysis. However, the authors extends the concept of security from [80] and consider security to be
19.1 Related work
211
a Quality of Service (QoS) attribute, as well as arguing for the need to quantify security as a means to meet contracted levels of security. In Wang et al. (2003) [104] this idea is taken a step further by introducing a higher level of formalism by a¢ liating Stochastic Petri Nets (SPN). In Jonsson and Olovsson (1997) [62] the authors discusses the challenge in a more practical way by analysing attacker behaviour through controlled experiments. The focus in the work documented in this paper was to investigate how attacker behaviour can be used to aid the quanti…cation of operational security. The paper discusses an approach to quantitative analysing attacker behaviour based on the result of the empirical data collected from intrusion experiments using undergraduate students at Chalmers University in Sweden. The result from the experiment indicated that a typical attacker behaviour comprises the following three phases: the learning phase, the standard attack phase and the innovative attack phase. The results of the experiments showed that the probability for successful security attacks is small during the learning and innovative phases while the probability was considerably higher during the standard attack phase. For this phase the collected data indicated an exponentially distribution of perceived time between successful security attacks. The AORDD framework and in particular the AORDD security solution tradeo¤ analysis makes use of the models discussed in the above papers and support quantitative measures of operational security level through the variables mean time and e¤ort to misuse (MTTM and METM) in the RL subnet of the tradeo¤ tool BBN topology. This work also extends the work discussed above and provides a model for quantitative measure of availability that is able to use both empirical and subjective information sources. Details are provided in Houmb, Georg, France, Reddy and Bieman (2005) [43]. Risk assessment was initially developed within the safety domain, but has later been adapted to security critical systems as security risk assessment. Since the beginning of the 1990s, several e¤orts have been devoted to developing structured and systematic security risk assessment approaches. The three main approaches are the OCTAVE framework [3], CRAMM [8] and the CORAS framework [19]. The OCTAVE framework was developed by the NSS Program at SEI and provides guidelines that enable organisations to develop appropriate protection strategies, based on risks to critical information assets. CCTA Risk Analysis and Management Methodology (CRAMM) was developed by the Central Computer and Telecommunication Agency (CCTA) in Britain and targets health care information systems. CRAMM o¤ers a structured approach to manage risks in computerbased systems in the health sector. CRAMM is asset-driven which means that the focus is on identifying the main assets connected to the system and on identifying and assessing the risks to these assets. The CORAS framework is inspired
212
19. Discussion
by CRAMM and has adapted the asset-driven strategy of CRAMM. CORAS also uses models to assist in risk assessment activities, with the use of UML as their modelling language. The overall objective of the approach is to provide methods and tools for precise and e¢ cient risk assessment of security-critical systems using semi-formal models. Here, models are used to describe the target of assessment, as a medium for communication between di¤erent groups of stakeholders involved in a risk assessment and to document risk assessment results and the assumptions on which these results depend. As discussed in Part 3 of this work the AORDD framework and its underlying AORDD development process and the AORDD security assessment activity, makes use of parts of the CORAS framework and in particular the CORAS integrated system development and risk management process. The AORDD approach di¤ers from CORAS in that it provides speci…c guidelines for choosing among alternative treatment options (called security solutions in AORDD). CORAS does not provide any particular decision support in this context and focused on the semi-formal modelling rather than on decision support. Details are in Chapter 5 and Part 3. Security management standards represent best practice for handling the overall and detailed management of security in an organisation. The most important standards in this area are the ISO/IEC 17799:2000 Information technology –Code of Practice for information security management [55], ISO/IEC TR 13335:2001 Information technology –Guidelines for management of IT Security [54] and the Australian/New Zealand standard for risk management AS/NZS 4360:2004 [4]. ISO/IEC 17799 provides recommendations for information security management and supports those that are responsible for initiating, implementing or maintaining security in their organisation. The standard is intended to aid in developing organisational speci…c security standards to ensures e¤ective security management in practice. It also provides guidelines on how to establish con…dence in inter-organisational matters. ISO/IEC 13335 provides guidance on management aspects of IT security. The main objectives of this standard are to de…ne and describe the concepts associated with the management of IT security, to identify the relationships between the management of IT security and management of IT in general, to present several models which can be used to explain IT security and to provide general guidance on the management of IT security. AS/NZS 4360:2004 is a widely recognised and used standard within the …eld of risk assessment. This standard is a general risk management standard that has been tailored for security critical systems in the CORAS framework. The standard includes a risk management process, which consists of …ve assessment sub-processes and two management sub-processes, a detailed activity description, a separate guideline companion standards and general management advices.
19.1 Related work
213
The AORDD framework is based on all above mentioned risk management related standards through it de…nition of information security and information system and its decision support for choice of security solution in the AORDD security solution trade-o¤ analysis. Details are in Chapters 3 and 5 and in Parts 4 and 5 of this work. As described in Chapter 3 security evaluation techniques have been around for a long time. TCSEC is the oldest known standard for evaluation and certi…cation of information security in IT products. The standard was developed by the Department of Defense (DoD) in the USA in the 1980s and evaluates systems according to the six prede…ned classes: C1, C2, B1, B2, B3 and A1. As a response to the development of TCSEC the United Kingdom, Germany, France and the Netherlands produced versions of their own national evaluation criteria. These were later harmonised and published under the name ITSEC. ITSEC certi…cation of a software product means that users can rely on an assured level of security for any product they are about to purchase. As for TCSEC, ITSEC certify products according to prede…ned classes of security (E0, E1, E2, E3, E4, E5 and E6). These standards were later replaced by the Common Criteria which was developed as a common e¤ort under the International Organization for Standardization (ISO). In the Common Criteria certi…cation is done according to the seven prede…ned classes: EAL1, EAL2, EAL3, EAL4, EAL5, EAL6 and EAL7 where EAL 7 represent the highest level of assurance. However, the above security evaluation standards have two problems in common and these are : the large amount of information involved and the heavy reliance on subjective expert assertions. The evaluation is most often carried out by one or a few evaluators and even though these evaluators must be certi…ed to perform the evaluation the evaluation still includes a high degree of inherent trust by holding a particular role. This means that the decision maker must always completely trust the evaluator and that he or she has no means of objectively assessing the abilities of the evaluator. This work addresses these issues in the trust-based information aggregation schema described in Part 5 of this work by not only providing the security evaluation information to the decision maker but also the perceived trustworthiness of the information sources (evaluators) providing the information. Related trade-o¤ analysis techniques exist but none are tailored to the security domain. This does not mean that one cannot use these techniques when performing security solution trade-o¤ analyses. It rather means that a specialised technique is more e¢ cient and particularly for developers unfamiliar with the security domain. The main reason for this is that the e¤ects of a series of security solution decisions are conceptually hard for humans to analyse due to the interrelations and dependencies between the security solutions. The two most relevant
214
19. Discussion
software architectural trade-o¤ analysis methods are the Architecture Trade-o¤ Analysis Method (ATAM) and the Cost Bene…t Analysis Method (CBAM). In addition, there are variations on these two methods available. Both ATAM and CBAM were developed by the Software Engineering Institute (SEI) at Carnegie Mellon. The focus of ATAM is to provide insight into how quality goals interact with and trade o¤ against each other. ATAM consists of nine steps and aids in eliciting sets of quality requirements along multiple dimensions, on analysing the e¤ects of each requirement in isolation and in understanding the interactions of these requirements. This uncovers architectural decisions and links these to business goals and desired quality attributes. CBAM is an extension of ATAM that looks at both the architectural and the economic implications of decisions. The focus in CBAM is on how an organisation should invest its resources to maximise gains and minimise risks by incorporating cost, bene…t and schedule implications of decisions into the trade-o¤ analysis. The AORDD security solution design trade-o¤ analysis described in Part 4 of this work is a security speci…c trade-o¤ analysis that incorporates ideas from both ATAM and CBAM. However, the AORDD security solution trade-o¤ analysis is extended to use security solution and misuse-speci…c parameters in addition to the economic implications as input to the trade-o¤ analysis. The AORDD security solution is also extended to evaluate the required security level by combining both static and operational security levels. Details are in Houmb et al. (2005) [44] in Appendix B.3, Houmb et al. (2006) [48] in Appendix B.2 and Part 4. The trust-based information aggregation schema developed in this work and described in Part 5 uses the notion of trust and trustworthiness to combine information as input to the AORDD security solution trade-o¤ analysis. This schema is a model that aggregate information using trust weights and hence relevant literature on trust are work on trust models. A number of logic-based formalisms of trust have been proposed by researchers. Almost all of these view trust as a binary relation. Forms of …rst order logic [11], [57], [2], modal logic or its modi…cation [85] have all been used to model trust in these cases. Simple relational formulae of the form Ta;b (stating that a trusts b) are also used to model trust between two entities. Each of the formalisms extends this primitive construct to include features such as temporal constraints and predicate arguments. Given these primitives and the traditional conjunction, disjunction, negation and implication operators, these logical frameworks express trust rules in their language and reason about these properties. Abdul-Rahman and Hailes (2000) [2] propose a trust model that allows arti…cial agents to reason about trustworthiness and that allow real people to automate this process. The trust model is based on a “reputation”mechanism or word-of-mouth.
19.1 Related work
215
Reputation information and direct experiences are used by a set of algorithms to make decisions regarding the trustworthiness of agents. Agents can decide which other agents’ opinions they trust more and thus allow agents to progressively tune their understanding of another agent’s subjective recommendations. Rangan (1988) [85] proposes a model consisting of simple trust statements of the form Bi;p , meaning that agent i believes proposition p. In this model a distributed system is a collection of agents communicating with each other by message passing. The state of an agent is the agent’s message history. The state of the systems is the state of all agents. Rangan uses modal logic to de…ne a set of properties of the trust statements, like transitivity etc. These constructs are then used to specify systems and to analyse them with respect to the property of interest. Jones and Firozabadi (2000) [60] address the issue of reliability of an agent’s transmission. Here, the authors use a variant of modal logic to model various trust scenarios like “b belief that a says to it that m”. They also use the language to model the concepts of deception and the level that an entity trust in another entity. Yahalom et al. (1993, 1994) [108, 107] propose a formal model for deriving new trust relationships from existing ones. In [108] the authors propose a formal model for expressing trust relations in authentication protocols together with an algorithm for deriving trust relations from recommendations. The authors propose seven di¤erent classes of trust. These are identifying entities, quality random key generation, keeping secrets, not interfering, clock-synchronisation, performing correctly algorithmic steps and providing recommendations. Being trusted for a particular class means that an entity can be trusted to perform a speci…c task. Each of these classes of trust can have two types of trust : direct trust and recommendation trust. Direct trust is when an entity trusts the other entity without including an intermediary in the trust relationship. Recommendation trust involves trusting an entity based on recommendation from a third party. There can be multiple trust relationships between the same pair of entities. Beth et al. (1994) [9] extends the ideas presented in [108, 107] to include relative trust. The paper presents a method for extracting trust values based on experiences from the real world and gives a method for deriving new trust values from existing ones within a network of trust relationships. Such trust values can be used in models like the ones in [108, 107]. The method proposed is statistical in nature. It is based on the assumption that all trusted entities have a consistent and predictable behaviour. To model degrees of trust, the notion of “numbers of positive or negative experiences” is used. The authors posit that for calculation of direct trust, no negative experiences are accepted if an entity is to be trusted at all. This means that the direct trust level can only increase. A consequence of this is that a long history of experience implies either almost absolute trust or
216
19. Discussion
none at all. For recommended, both positive and trust negative experiences are accepted. This means that the trust value from recommendation can be relatively low, even after a long history. However, there is one problem with this schema and this is that the expression for deriving recommended trust is unsuitable in environments where the trustworthiness of entities is likely to change, as discussed in Jøsang (1997) [63]. Furthermore, the expression for deriving new direct trust from direct and recommended trust appears to be counter-intuitive and can lead to cases as “If you tell me that you trust NN by 100% and I only trust you by 1% to recommend me somebody then I also trust NN by 100%”(see [63] for details). Jøsang (1998, 1999) [64, 65] proposes a model for trust based on a general model for expressing relative uncertain beliefs about the truth of statements. In these papers a trust model de…nes trust as an opinion where an opinion is a representation of a belief. An opinion is modelled as a triplet < b; d; u >2 fb; d; ug where b is a measure of one’s belief in a proposition, d is a measure of one’s disbelief in the proposition and u is a measure of the uncertainty. A major shortcoming of this model is that it does not acknowledge that trust changes over time and thus the model has no mechanism for monitoring trust relationships to re-evaluate their constraints. Cohen et al. (1997) [14] propose an alternative and more di¤erentiated conception of trust called Argument-based Probabilistic Trust model (APT). This model includes the more enduring concept as a special case but emphasises instead the speci…c conditions under which an aid will or will not perform well. According to the authors the problem of decision aid acceptance is neither under-trust nor overtrust but rather inappropriate trust. The authors de…ne this notion as a failure to understand or properly evaluate the conditions a¤ecting good and bad aid performance. To aid in this discrepancy the authors propose a simple framework for deriving benchmark models for verifying the performance for situations where previously learned or explicitly identi…ed patterns may be insu¢ cient to guide decisions about user-aid interaction. The most important use of APT is to chart how trust changes from one user to another, from one decision aid to another, from one situation to another and across phases of decision aid use. Xiong and Liu (2003) [106] present a coherent adaptive trust model for quantifying and comparing the trustworthiness of peers based on a transaction-based feedback system. In this paper the authors present three basic trust parameters : peer feedback through transactions, total number of transactions a peer performs and credibility of the feedback sources. The paper addresses some of the factors that in‡uence peer-to-peer trust, such as reputation systems and misbehaviour of peers by giving false feedback. According to this description, giving a peer’s reputation re‡ects the degree of trust that other peers in the community have on the given peer, based on their past experiences. The paper also provides a trust
19.1 Related work
217
metric for predicting a given peer’s likelihood of a successful transaction in the future. Bacharach and Gambetta (2000) [7] embark on a reorientation of the theory of trust. In this paper the authors de…ne trust as a particular belief that arises in games with a certain payo¤ structure. The paper focuses on how to identify the source of the primary trust problem in the uncertainty about the payo¤s of the trustee. One major observation made by the authors is that in almost all games the truster sees or observes a trustee before making any decision and therefore uses these observations as evidence for the trustee’s having or lacking trustworthymaking qualities. According to the authors in such contexts the truster must also judge whether apparent signs of trustworthiness are themselves to be trusted. Purser (2001) [84] presents a simple graphical approach to model trust. In this paper the author examines the relationship between trust and risk and argues that for every trust relationship there is a risk associated with a breach of the trust. Hence, in this work trust relationships are modelled as directed graphs where an entity can trust or be trusted by another entity, modelled by nodes in the graph that is labelled by the names of the entities. Here trust is de…ned as unidirectional and connects two entities, which means that it is represented as a directed edge from the trusting entity to the trusted entity. All the above trust models either restrict trust decisions to binary outcomes or assess trust based on limited information (e.g., only reputation or only experience) about the target entity. As the trust-based information aggregation schema presented in this work combines various information types from various information sources a more generic model of trust is needed. None of the above mentioned trust models incorporate techniques for aggregating information like trustee’s behaviour history, trustee’s attributes or third-party judgment to evaluate the trust level of a trustee. When aggregating disparate information as done in the trustbased information aggregation schema all these factors a¤ect the level of trust. Also, a trust model in which trust levels are expressed in terms of numeric values from a continuous range, is more suitable for expressing trust as an information source ability (or performance) measure. The trust-based information aggregation schema in this work has therefore adapted the concept of trust used in the trust vector model developed by Ray and Chakraborty (2004) [87]. This model speci…es trust as a vector of numeric values in the range [ 1; 1], which gives the needed granulated expression of trust level. The values in the negative region of the range represent distrust while values in the positive region represent trust. The parameters used in the vector are: knowledge, experience and recommendation. In this model trust is de…ned as the …rm belief in the competence of an entity to act dependable and secure within a speci…c context. Furthermore, the trust relationship is always between a truster;
218
19. Discussion
an entity that trusts the target entity, and a trustee; the target entity that is trusted. The truster is an activity entity such as a human being, an agent or a subject of some type while the trustee can either be an active entity or a passive entity such as a piece of information or a software. A trust relationship is denoted C A ! B where A is the truster, B is the trustee and C is some context in which the trust relationship exist. The trust-based information aggregation schema uses the core of this model by a¢ liating the granulated expression of trust and trust variables. However, the schema is tailored to work e¢ ciently in a security solution decision support context and is thus not a general approach as the trust vector model is. Hence, the schema re…nes the de…nition of trust and distrust and uses a set of domain speci…c variables to measure the level of trust.
20. Concluding Remarks and Suggestions for Further Work
What is a reasonable security level? How much money is necessary to invest to feel reasonable secure? And most importantly: which security solution(s) …ts best for a particular security problem or challenge? These are the three core questions that would be nice to answer …rmly and with great level of con…dence. Unfortunately, there is still a long way to go. This work merely proposes an approach to tackle some of the underlying factors of these three core questions and a substantial amount of research and practical experiments is still needed before any conclusions can be drawn. The objective of this work has been to help decision makers to better tackle security solution decision situations under the restricted time and budget constraints that such situations usually are subject to. This work does this by means of trading o¤ security solutions so that the best-…tted security solution among alternatives are identi…ed taking not only the …nancial perspective into consideration but also security, development and project perspectives. These perspectives are handled by a set of components and an overall security solution decision support framework called the AORDD framework. The AORDD framework combines AOM and RDD techniques and consist of the following seven components: (1) An iterative AORDD process. (2) Security solution aspect repository. (3) Estimation repository to store experience from estimation of security risks and security solution variables involved in security solution decisions. (4) RDD annotation rules for security risk and security solution variable estimation. (5) The AORDD security solution trade-o¤ analysis and trade-o¤ tool BBN topology. (6) Rule set for how to transfer RDD information from the annotated UML diagrams into the trade-o¤ tool BBN topology. (7) Trust-based information aggregation schema to aggregate disparate information in the trade-o¤ tool BBN topology. The two core components of the AORDD framework are the AORDD security solution trade-o¤ analysis (component 5) and the trust-based information aggregation schema (component 7). These two components have been studied and evaluated using an action research work process and consist of the following: C.1: A set of security risk variables. C.2: A set of security solution variables. C.3: A
220
References
set of trade-o¤ parameter variables to represent and measure relevant development, project and …nancial perspectives. C.4: Methodology and tool-support for comparing the security solution variables with the security risk variables. C.5: Methodology and tool-support for trading o¤ security solutions and identifying the best-…tted one(s) based on security, development, project and …nancial perspectives. Plans for further work includes merging the trade-o¤ tool BBN topology and the information aggregation schema into one BBN topology, to perform more action research type of …eld studies, to eventually perform a realistic and industrial size case study and to advance the topic of semi-automatic security solution decision support. The latter is important to e¤ectively enable non-security experts and decision makers to bring their systems to a controlled security level for a reasonable cost. Detailed recommendation for further work on the two core components of the AORDD framework is given as part of the evaluation discussed in Chapter 19. All other components of the AORDD framework is still at an explorative state and substantial amount of further work is needed before any of these components can e¤ectively contribute in security solution decision situations.
References
1. ISO/IEC 27001:2005 Speci…cation for Information Security Management, October 2005. 2. A. Abdul-Rahman and S. Hailes. Supporting Trust in Virtual Communities. In Proceedings of the 33rd Annual Hawaii International Conference on System Sciences (HICSS-33), Maui, Hawaii, January 2000. IEEE Computer Society. 3. C. Alberts, S. Behrens, R. Pethia, and W. Wilson. Operationally Critical Threat, Asset, and Vulnerability Evaluation (OCTAVE) Framework, Version 1.0. Technical report, Software Engineering Institute, Carnegie Mellon University, Pittsburgh, PA, June 1999. 4. Australian/New Zealand Standards. AS/NZS 4360:2004 Risk Management, 2004. 5. T. Aven. Reliability and Risk Analysis. Elsevier Science Publishers LTD, 1992. 6. A. Avizienis, J.-C. Laprie, B. Randell, and C. Landwehr. Basic Concepts and Taxonomy of Dependable and Secure Computing. IEEE Transactions on Dependable and Secure Computing, 1(1):11–33, January 2004. 7. M. Bacharach and D. Gambetta. Trust as Type Identi…cation. In C. Castelfranchi and Y. Tan, editors, Trust and Deception in Virtual Societies, pages 1–26. Kluwer Academic Publishers, 2000. 8. B. Barber and J. Davey. The Use of the CCTA Risk Analysis and Management Methodology CRAMM in Health Information Systems. In K. Lun, P. Degoulet, T. Piemme, and O. Rienho¤, editors, Proceedings of MEDINFO’92, pages 1589–1593. North Holland Publishing Co, Amsterdam, 1992. 9. T. Beth, M. Borcherding, and B. Klein. Valuation of Trust in Open Networks. In D. Gollmann, editor, Proceedings of the 3rd European Symposium on Research in Computer Security - ESORICS ’94, volume 875 of Lecture Notes in Computer Science, Brighton, UK, November 1994. Springer-Verlag. 10. M. Branchaud and S. Flinn. xTrust: A Scalable Trust Management Infrastructure. In Proceedings of the Second Annual Conference on Privacy, Security and Trust (PST 2004), pages 207–218, October 14-15 2004.
222
References
11. M. Burrows, M. Abadi, and R. Needham. A Logic of Authentication. ACM Transactions on Computer Systems, 8(1), February 1990. 12. C. Wohlin and P. Runeson and M. Höst and C.O. Ohlsson and B. Regnell and A. Wesslé. Experimentation in Software Engineering: An Introduction. Kluwer Academic Publishers, 2000. 13. CERT Advisory CA-1996-21. TCP SYN ‡ooding and IP spoo…ng attacks, November 2000. CERT Coordination Centre, http://www.cert.org/advisories/CA-199621.html. 14. M. Cohen et al. Trust in Decision Aids: A Model and a Training Strategy. Technical Report USAATCOM TR 97-D-4, Cognitive Technologies Inc., Fort Eustis, VA, 1997. 15. ISO 15408:2006 Common Criteria for Information Technology Security Evaluation, Version 3.1, Revision 1, CCMB-2006-09-001, CCMB-2006-09-002 and CCMB-2006-09003, September 2006. 16. R. Cooke. Experts in Uncertainty: Opinion and Subjective Probability in Science. Oxford University Press, 1991. 17. R. Cooke and L. Goossens. Procedures Guide for Structured Expert Judgement in Accident Consequence Modelling. Radiation Protection and Dosimetry, 90(3):303–311, 2000. 18. R. Cooke and K. Slijkhuis. Expert Judgment in the Uncertainty Analysis of Dike Ring Failure Frequency. Case Studies in Reliability and Maintenance, pages 331–350, 2003. 19. CORAS (2000–2003). IST-2000-25031 CORAS: A Platform for risk analysis of security critical systems, Accessed 18 February 2006. 20. CORAS project. The CORAS methodology for model-based risk assessment, Deliverable D2.4, August 2003. 21. P.-J. Courtois, N. Fenton, B. Littlewood, M. Neil, L. Strigini, and D. Wright. Bayesian Belief Network Model for the Safety Assessment of Nuclear Computer-Based Systems. Second year report part 2, Esprit Long Term Research Project 20072-DeVa, 1998. 22. D. Matheson and I. Ray and I. Ray and S.H. Houmb. Building Security Requirement Patterns for Increased E¤ectiveness Early in the Development Process. In Symposium on Requirements Engineering for Information Security (SREIS), Paris, France, 29 August 2005. 23. K. Delic, M. Mazzanti, and L. Stringini. Formilizing engineering judgment on software dependability via belied netowrks. In DCCA-6, Sixth IFIP International Working Conference on Dependable Computing for Critical Applications, "Can We Rely on Computers?", Garmisch-Partenkirchen, Germany, 1997.
References
223
24. Department of Defence. DoD 5200.28-STD: Trusted Computer System Evaluation Criteria, August 15 1985. 25. Department of Trade and Industry. The National Technical Authority for Information Assurance, June 2003. http://www.itsec.gov.uk/. 26. Department of Trade and Industry (DTI). Information Security Breaches Survey 2006, April 2007. 27. European Parliament. Directive 2002/58/EC of the European Parliament and of the council of 12 July 2002 concerning the processing of personal data and the protection of privacy in the electronic communications sector (Directive on privacy and electronic communications), July 2002. 28. European Parliament. Directive 2006/24/EC of the European Parliament and of the council of 15 March 2006 on the retention of data generated or processed in connection with the provision of publicly available electronic communications services or public communication networks and amending Directive 2002/58/EC (Directive on data retention), March 2006. 29. N. Fenton, B. Littlewood, M. Neil, L. Strigini, A. Sutcli¤e, and D. Wright. Assessing Dependability of Safety Critical Systems using Diverse Evidence. IEEE Proceedings of Software Engineering, 145(1):35–39, 1998. 30. N. Fenton and M. Neil. A critique of software defect prediction models. IEEE Transaction of Software Engineering, 25(5):675–689, 1999. 31. B. D. Finetti. Theory of Probability Volume 1. John Wiley & Sons, 1973. 32. B. D. Finetti. Theory of Probability Volume 2. John Wiley & Sons, 1973. 33. R. France, D.-K. Dim, S. Ghosh, and E. Song. A UML-based pattern speci…cation technique. IEEE Transactions on Software Engineering, 3(30):193–206, 2004. 34. R. France, I. Ray, G. Georg, and S. Ghosh. Aspect-oriented approach to design modeling. IEE Proceedings on Software, 4(151):173–185, 2004. 35. G. Georg, S. Houmb, and I. Ray. Aspect-Oriented Risk Driven Development of Secure Applications. In E. Damiani and P. Liu, editors, Proceedings of 20th Annual IFIP WG 11.3 Working Conference on Data and Applications Security 2006 (DBSEC’06), pages 282–296, Sophia Antipolis, France, 31 July-2 August 2006. Spinger Verlag. LNCS 4127. 36. G. Georg, S.H.Houmb, and R. France. Risk-Driven Development (RDD) Pro…le. CS Technical Report 06-101, Colorado State University, 2006. 37. L. Goossens, R. Cooke, and B. Kraan. Evaluation Of Weighting Schemes For Expert Judgment Studies. In Joselh and Bari, editors, PSAM 4 Proceedings, pages 1937–1942. Springer, 1998.
224
References
38. L. Goossens, F. Harper, B. Kraan, and H. Meacutetivier. Expert Judgement for a Probabilistic Accident Consequence Uncertainty Analysis. Radiation Protection and Dosimetry, 90(3):295–303, 2000. 39. Government of Canada. The Canadian Trusted Computer Product Evaluation Criteria, Januart 1993. 40. B. A. Gran. The use of Bayesian Belief Networks for combining disparate sources of information in the safety assessment of software based systems. Doctoral of engineering thesis 2002:35, Department of Mathematical Science, Norwegian University of Science and Technology, 2002. 41. S. Houmb. Combining Disparate Information Sources When Quantifying Operational Security. In Proceedings of the 9th World Multi-Conference on Systemics, Cybernetics and Informatics, Volume I, pages 128–131. International Institute of Informatics and Systemics, July 2005. Orlando, Florida, USA. 42. S. Houmb and G. Georg. The Aspect-Oriented Risk-Driven Development (AORDD) Framework. In O. B. et al., editor, Proceedings of the International Conference on Software Development (SWDC-REX), volume SWDC-REX Conference Proceedings, pages 81–91, Reykjavik, Iceland, 2005. University of Iceland Press. 43. S. Houmb, G. Georg, R. France, R. Reddy, and J. Bieman. Predicting Availability of Systems using BBN in Aspect-Oriented Risk-Driven Development (AORDD). In Proceedings of the 9th World Multi-Conference on Systemics, Cybernetics and Informatics, Volume X: 2nd Symposium on Risk Management and Cyber-Informatics (RMCI’05), pages 396–403. International Institute of Informatics and Systemics, July 2005. Orlando, Florida, USA. 44. S. Houmb, G.Georg, R.France, J. Bieman, and J. Jürjens. Cost-Bene…t Trade-O¤ Analysis using BBN for Aspect-Oriented Risk-Driven Development. In Proceedings of Tenth IEEE International Conference on Engineering of Complex Computer Systems (ICECCS 2005), Shanghai, China, pages 195–204, June 2005. 45. S. Houmb, I. Ray, and I. Ray. Estimating the Relative Trustworthiness of Information Sources in Security Solution Evaluation. In Proceedings of the 4th International Conference on Trust Management (Itrust 2006), volume LNCS 3986, pages 135–149. Springer Verlag, 16-19 May 2006. Pisa, Italy. 46. S. Houmb and K. Sallhammar. Modelling System Integrity of a Security Critical System Using Colored Petri Nets. In Proceeding of Safety and Security Engineering (SAFE 2005), pages 3–12, Rome, Italy, 2005. WIT Press. 47. S. H. Houmb, G. Georg, R. France, and D. Matheson. Using aspects to manage security risks in risk-driven development. In 3rd International Workshop on Critical Systems Development with UML, number TU-Munich Technical Report number TUMI0415, pages 71–84. International Institute of Informatics and Systemics, 2004. 48. S. H. Houmb, G. Georg, J. Jürjens, and R. France. An Integrated Security Veri…cation and Security Solution Design Trade-O¤ Analysis. Integrating Security and Software Engineering: Advances and Future Visions, Chapter 9, 2006. 288 pages.
References
225
49. S. H. Houmb, O.-A. Johnsen, and T. Stålhane. Combining Disparate Information Sources when Quantifying Security Risks. In 1st Symposium on Risk Management and Cyber-Informatics (RMCI’04), Orlando, FL, pages 128–131. International Institute of Informatics and Systemics, July 2004. 50. HUGIN, Version 6.8, Hugin Expert A/S, Alborg, Denmark, April 19 2007. http://www.hugin.dk. 51. IEC 61508:1998 Functional safety of electical/electronic/progammable electronic safety-related systems, 1998. 52. IEEE Computer Society/Software & Systems Engineering Standards Committee. IEEE Std 1471-2000 Recommended Practice for Architectural Description of Software– Intensive Systems, 2000. 53. Institute of Electrical and Electronics Engineers. IEEE Computer Dictionary Compilation of IEEE Standard Computer Glossaries, 610, January 1990. 54. International Organization for Standardization (ISO/IEC). ISO/IEC TR 13335:2004 Information technology - Guidelines for management of IT Security, 2004. 55. International Organization for Standardization (ISO/IEC). ISO/IEC 17799:2005 Information technology - Code of Practice for information security management, 2005. 56. International Organization for Standardization (ISO)/International Electrotechnical Commission (IEC). ISO/IEC 10746: Reference Model for Open Distributed Processing, 1995. 57. S. Jajodia, P. Samarati, and V. Subrahmanian. A Logical Language for Expressing Authorizations. In Proceedings of the 1997 IEEE Symposium on Security and Privacy, Oakland, CA, USA, May 1997. IEEE Computer Society. 58. J.E. McGrath. Internation and Performance. Prentice Hall, 1984. 59. F. Jensen. An introduction to Bayesian Network. UCL Press, University College London, 1996. 60. A. Jones and B. Firozabadi. On the Characterization of a Trusting Agent –Aspects of a Formal Approach. In C.Castelfranchi and Y.Tan, editors, Trust and Deception in Virtual Societies. Kluwer Academic Publishers, 2000. 61. E. Jonsson. An integrated framework for security and dependability. In NSPW ’98: Proceedings of the 1998 workshop on New security paradigms, pages 22–29, New York, NY, USA, 1998. ACM Press. 62. E. Jonsson and T. Olovsson. A quantitative model of the security intrusion process based on attacker behavior. IEEE Transactions on Software Engineering, 4(235245):235, April 1997. 63. A. Jøsang. Arti…cial Reasoning with Subjective Logic. In Proceedings of the 2nd Australian Workshop on Commonsense Reasoning, Perth, Australia, December 1997.
226
References
64. A. Jøsang. A Subjective Metric of Authentication. In J.-J. Quisquater et al., editors, Proceedings of the 5th European Symposium on Research in Computer Security (ESORICS’98), volume 1485 of Lecture Notes in Computer Science, Louvain-la-Neuve, Belgium, September 1998. Springer-Verlag. 65. A. Jøsang. An Algebra for Assessing Trust in Certi…cation Chains. In Proceedings of the 1999 Network and Distributed Systems Security Symposium(NDSS’99), San Diego, California, February 1999. Internet Society. 66. M. Jouini and R. Clemen. Copula Models for Aggregating Expert Opinions. Operations Research, 44:444–457, 1996. 67. J. Jürjens. Secure Systems Development with UML. Springer Verlag, Berlin Heidelberg, New York, 2005. 68. M. Kallen and R. Cooke. Expert aggregation with dependence. Probabilistic Safety Assessment and Management, pages 1287–1294, 2002. 69. R. Kasman, J. Asundi, and M. Klein. Making architecture design decisions: An economic approach. Technical report CMU/SEI-2002-TR-035, CMU/SEI, http://www.sei.cmu.edu/pub/documents/02.reorts/pdf/02tr03.pdf, 2002. 70. R. Kazman, M. Klein, and P. Clements. ATAM: Method for architecture evaluation. Technical report CMU/SEI-2000-TR-004, CMU/SEI, http://www.sei.cmu.edu/pub/document/00.reports/pdf/00tr004.pdf, 2000. 71. G. Kirkebøen. Sjønn, formler og klinisk praksis: Hvorfor vurderer erfarne klinikere så dårlig enda de vet så mye? Tidsskrift for Norsk Psykologforening, 36(6):523–536, 1999. 72. B. Kraan and R. Cooke. Processing Expert Judgements in Accident Consequence Modelling. Radiation Protection Dosimetry (Expert Judgement and Accident Consequence Uncertainty Analysis; special issue), 90(3):311–315, 2000. 73. S. Lauritzen and D. Spiegelhalter. Local computations with probabilities on graphical structures and their application to expert systems (with discussion). Journal of the Royal Statistical Society, Series B 50(2):157–224, 1988. 74. B. Littlewood, S. Brocklehurst, N. Fenton, P. Mellor, S. Page, D. Wright, J. Dobson, J. McDermid, and D. Gollmann. Towards Operational Measures of Computer Security. Journal of Computer Security, 2:211–229, 1993. 75. B. Madan, K. Goseva-Popstojanova, K. Vaidyanathan, and K. Trivedi. Modeling and Quanti…cation of Security Attributes of Software Systems. In Proceedings of the International Conference on Dependable Systems and Networks (DSN‘02), volume 2, pages 505–514. IEEE Computer Society, 2002. 76. G. Munkvold, G. Seland, S. Houmb, and S. Ziemer. Empirical assessment in converging space of users and professionals. In Proceedings of the 26th Information Systemes Research Seminar in Scandinavia (IRIS’26), page 14 pages, Helsinki, August 9-12 2003.
References
227
77. N. Provos. Honeyd - A Virtual Honeypot Daemon. In Proceedings of the 10th DFN-CERT Workshop, Hamburg, Germany, February 2003. 78. NS-EN ISO/IEC 17025:2005 Generelle krav til prøvings- og kalibreringslaboratoriers kompetanse, 2nd edition, 2005. 79. K. Øien and P. Hokstad. Handbook for performing Expert Judgment. Technical report, SINTEF, 1998. 80. R. Ortalo and Y. Deswarte. Experiments with quantitative evaluation tools for monitoring operational security. IEEE Transactions on Software Engineering, 5(25):633– 650, Sept/Oct 1999. 81. M. Østvang. Using Honeynet as an information source in a business perspective: What are the bene…ts and what are the risks? Master’s thesis, Norwegian University of Science and Technology, 2004. 82. M. Østvang and S. Houmb. Honeypot technology in a business perspective. In 1st Symposium on Risk Management and Cyber-Informatics (RMCI’04), Orlando, FL, pages 123–127. International Institute of Informatics and Systemics, 2004. 83. J. Pearl. Probabilistic Reasoning in Intelligent Systems: Network forPlausible Inference. Morgan Kaufmann, 1988. 84. S. Purser. A Simple Graphical Tool For Modelling Trust. Computers & Security, 20(6), September 2001. 85. P. Rangan. An Axiomatic Basis of Trust in Distributed Systems. In Proceedings of the 1988 IEEE Computer Society Symposium on Security and Privacy, Oakland, California, April 1988. IEEE Computer Society. 86. Rational Software. The Rational Uni…ed Process. Rational Software, The Rational Uni…ed Process, version 5.0, Cupertino, CA, 1998. 87. I. Ray and S. Chakraborty. Vector Trust Model. In Proceedings of the 9th European Symposium on Research in Computer Security (ESORICS 2005), September 2004. 88. I. Ray and S. Chakraborty. A New Model for Reasoning About Trust in Systems Developed from Semi- or Un-trustworthy Components and Actors. In CSU Computer Science Research Symposium, April 2005. 89. RTCA. DO-178B: Software Considerations in Airborne Systems and Equipment Certi…cation, 1985. 90. D. Seibert. Participatory action research and social change. Ithaca, NY: Cornell Participatory Action Research Network, Cornell University, 3rd edition, 1998. 91. SERENE: Safety and Risk Evaluation using Bayesian Nets. ESPIRIT Framework IV nr. 22187, 1999. http://www.hugin.dk/serene/.
228
References
92. S. Singh, M. Cukier, and W. Sanders. Probabilistic Validation of an IntrusionTolerant Replication System. In J. de Bakker, W.-P. de Roever, and G. Rozenberg, editors, International Conference on Dependable Systems and Networks (DSN‘03), page ½ 615U624, San Francisco, CA, USA, June 2003. 93. W. Sonnenreich, J. Albanese, and B. Stout. Return On Security Investment (ROSI) - A Practical Quantitative Model. Journal of Research and Practice in Information Technology, 38(1):45–56, February 2006. ½ tracking hackers. Addison-Wesley, 2003. 94. L. Spitzner. Honeypot U95. W. Stallings. Network Security Essentials: Applications and Standards. Prentice Hall, 2nd edition, 2003. 96. Standards Coordinating Committee 10 (Terms and De…nitions) Jane Radatz (Chair). The IEEE Standard Dictionary of Electrical and Electronics Terms, volume IEEE Std 100-1996, 1996. 97. K. Stølen, F. den Braber, T. Dimitrakos, R. Fredriksen, B. Gran, S. Houmb, Y. Stamatiou, and J. Aagedal. Business Component-Based Software Engineering, chapter Model-based Risk Assessment in a Component-Based Software Engineering Process: The CORAS Approach to Identify Security Risks, pages 189–207. Kluwer, 2002. 98. G. Straw, G. Georg, E. Song, S. Ghosh, R. France, and J. Bieman. Model composition directives. In T. Baar, A. Strohmeier, A. Moreira, and S. Mellor, editors, UML 2004 - The Uni…ed Modelling Language: Modelling Languages and Applications. 7th International Conference, Lisbon, Portugal, October 11-15, 2004. Proceedings, volume 3273 of Lecture Notes in Computer Science, pages 84–97. Springer Verlag, 2004. 99. E. Stringer and W. Genat. Action research in health. Upper Saddle River, NJ: Pearson Pretence-Hall, 1st edition, 2004. 100. E. Trauth. Qualitative research in IS: issues and trends. Idea Group, 2001. 101. Usability First Web Site. Usability …rst Usability Glossary, Accessed June 8 2007. 102. D. Vose. Risk Analysis: A Quantitative Guide. John Wiley & Sons Ltd., 2000. 103. Walton-on-Thames: Insight Consulting. CRAMM User Guide, Issue 2.0, January 2001. 104. D. Wang, B. Madan, and K. Trivedi. Security Analysis of SITAR Intrusion Tolerance System. In Proceedings of the 2003 ACM workshop on Survivable and selfregenerative systems: in association with 10th ACM Conference on Computer and Communications Security, pages 23–32. ACM Press, 2003. 105. A. Welsh. Aspects of Statistical Inference. Wiley & Sons, 1996. 106. L. Xiong and L. Liu. A Reputation-Based Trust Model For Peer-To-Peer Ecommerce Communities. In Proceedings of the IEEE Conference on E-Commerce (CEC’03), pages 275–284, Newport Beach, California, June 2003.
References
229
107. R. Yahalom and B. Klein. Trust-based Navigation in Distributed Systems. Computing Systems, 7(1), Winter 1994. 108. R. Yahalom, B. Klein, and T. Beth. Trust Relationship in Secure Systems: A Distributed Authentication Perspective. In Proceedings of the 1993 IEEE Computer Society Symposium on Security and Privacy, Oakland, California, May 1993. IEEE Computer Society.
Part VII
Appendices
Appendix A: AORDD Concepts
De…nition Accountability means that actions of an entity may be traced uniquely to the entity [54]. De…nition Assets are entities that has value to one or more of the system stakeholders (modi…ed from [15]). De…nition Asset value is the value of an asset in terms of its relative importance to a particular stakeholder. This value is usually expressed in terms of some potential business impacts. This could in turn lead to …nancial losses, loss of revenue, market share or company image (modi…ed from the risk management standard AS/NZS 4360:2004 [4]). De…nition Authenticity ensures that the identity of a subject or resource is the one claimed [54]. De…nition Availability means that system services are accessible and usable on demand by an authorised entity [54]. De…nition Basic security threat is the initial security threat that exploits one or more vulnerabilities in the ToE or the ToE security environment and leads to a chain of misuses. De…nition Conceptual assets are non-physical entities of value to one or more stakeholders, such as people and their skills, training, knowledge and experience, and the reputation, knowledge and experience of an organisation (interpretation of de…nition given in [20]). De…nition Con…dentiality (or secrecy) means that information is made available or disclosed only to authorised individuals, entities or processes [54]. De…nition Development environment is the environment in which the ToE is developed [15]. De…nition Evaluation authority is a body that implements the Common Criteria for a speci…c community by means of an evaluation scheme and thereby sets the standards and monitors the quality of evaluation conducted by bodies within that community [15].
234
Appendix A.1: AORDD Concepts
De…nition Evaluation scheme is the administrative and regulatory framework under which the Common Criteria is applied by an evaluation authority within a speci…c community [15]. De…nition Gain is an increase in the asset value for one asset. De…nition Information system is a system containing physical and conceptual entities that interacts as a potential target for intended or unintended security attacks which might a¤ ect either the system itself, its data or its stakeholders and end-users (modi…ed from IEEE Std 1471–2000 [52]). De…nition Information security comprises all perspectives related to de…ning, achieving, and maintaining con…dentiality, integrity, availability, nonrepudiation, accountability, authenticity and reliability of an information system (adapted and modi…ed for information security from ISO/IEC TR 13335 [54]). De…nition Integrity means that information is not destroyed or altered in an unauthorised manner and that the system performs its intended function in an unimpaired manner free from deliberate or accidental unauthorised manipulation of the system [54]. De…nition Loss is a reduction in the asset value for one asset. De…nition Misuse is an event that a¤ ects one or more of the security attributes con…dentiality, integrity, availability, authenticity, accountability, non-repudiation or reliability of one or more assets. De…nition Misuse frequency is a measure of the occurrence rate of a misuse expressed as either the number of occurrences of a misuse in a given time frame or the probability of the occurrence of a misuse in a given time frame (modi…ed from AS/NZS 4360:2004 [4]). De…nition Misuse impact is the non-empty set of either a reduction or an increase of the asset value for one asset. De…nition Non-repudiation is the ability to prove that an action or event has taken place in order to prevent later repudiation of this event or action [54]. De…nition Operational environment is the environment in which the ToE is operated [15]. De…nition Physical assets are physical entities of value to one or more stakeholders, such as hardware and other infrastructure entities, operating systems, application and information (interpretation of de…nition given in [20]). De…nition Protection Pro…le (PP) is an implementation-independent statement of security needs for a TOE type [15].
Appendix A.1: AORDD Concepts
235
De…nition Reliability is the ability of an item to perform a required function under stated conditions [96] (Please note that the use of the term “item” intentionally allows for the calculation of reliability for individual components or for the system as a whole.). De…nition Safeguard is an existing practice, procedure or security mechanism in the ToE and/or the ToE security environment that reduces or prevents security threats from exploiting vulnerabilities and thus reduces the level of risk (modi…ed from ISO 13335 [54]). De…nition Stakeholder is an individual, team or organisation (or classes thereof ) with interest in or concerns relative to an information system (modi…ed from the software architectural standard IEEE 1471 [52]). De…nition Security critical information system is an information system where there are assets with values for which it is critical to preserve one or more of the security properties of(modi…ed from [15]). De…nition Security Risk Acceptance Criteria is a description of the acceptable level of risk (modi…ed from AS/NZS 4360:2004 [4]). De…nition Security Risk is the combination of exactly one misuse frequency, one misuse impact, one mean time to misuse (MTTM) and one mean e¤ort to misuse (METM) (modi…ed from AS/NZS 4360:2004 [4] by taking in the concepts for operational security level from Littlewood et al. [74]). De…nition Security solution is any construct that increases the level of con…dentiality, integrity, availability, authenticity, accountability, non-repudiation, and/or reliability of a ToE. Examples of security solutions are security requirements, security protocols, security procedures, security processes and security mechanism, such as cryptographic algorithm and anti-virus software. De…nition Security Target (ST) is an implementation-dependent statement of the security needs for a speci…c TOE [15]. De…nition Security Threat is a potential undesired event in the ToE and/or the ToE security environment that may exploit one or more vulnerabilities a¤ ecting the capabilities of one or more of the security attributes con…dentiality, integrity, availability, authenticity, accountability, non-repudiation or reliability of one or more assets (modi…ed from AS/NZS 4360:2004 [4]). De…nition Target of Evaluation (ToE) is a set of software, …rmware and/or hardware possibly accompanied by guidance [15]. De…nition Trade-o¤ Analysis is making decisions when each choice has both advantages and disadvantages. In a simple trade-o¤ it may be enough to list each alternative and the pros and cons. For more complicated decisions, list the decision criteria and weight them. Determine how each option rates on
236
Appendix A.1: AORDD Concepts
each of the decision score and compute a weighted total score for each option. The option with the best score is the preferred option. Decision trees may be used when options have uncertain outcomes [101]. De…nition User is any external entity (human user or machine user) to the ToE that interacts (or may interact) with the ToE [15]. De…nition Vulnerability is a weakness in the ToE and/or the ToE security environment that if exploited a¤ ects the capabilities of one or more of the security attributes con…dentiality, integrity, availability, authenticity, accountability, non-repudiation or reliability of one or more assets (modi…ed from AS/NZS 4360:2004 [4]).
Appendix B.1: P.16: Houmb and Georg (2005)
Siv Hilde Houmb and Geri Georg. The Aspect-Oriented Risk-Driven Development (AORDD) Framework. In Proceedings of the International Conference on Software Development (SWDC-REX). Pages 81-91, University of Iceland Press. Reykjavik, Iceland, 2005. ISBN 9979-54-648-4.
238
Appendix B.1: P.16: Houmb and Georg (2005)
The Aspect-Oriented Risk-Driven Development (AORDD) Framework Siv Hilde Houmb Department of Computer and Information Science Norwegian University of Science and Technology Sem Sælands Vei 7-9, NO-7491 Trondheim, Norway
[email protected] Geri Georg Software Assurance Laboratory Department of Computer Science, Colorado State University 601 S. Howes St., Fort Collins, CO 80523-1873
[email protected]
Abstract Security critical systems development needs to integrate both project and product risks assessment into the development. Such systems need to balance time to market constraints, cost demands, functional requirement, as well as security requirements. This advocate the use of techniques that support coste¤ective and risk-driven development. The aspect-oriented risk-driven development (AORDD) framework combines risk-driven development (RDD) with aspect oriented modeling (AOM). Development is incremental, iterative, and risk-driven, and each development cycle ends with a combined project and product risk assessment. The result of the assessment is a list of project and product risks in need of treatment. Cost-e¤ective treatment of risks is handled by the AORDD cost-bene…t trade-o¤ analysis. The paper focuses on product risks, and in particular security risks, and provides an overview of the AORDD framework and the AORDD cost-bene…t trade-o¤ analysis.
Keywords: Development framework, Risk-Driven Development (RDD), trade-o¤ analysis, Aspect Oriented Modeling (AOM), and Bayesian Belief Networks (BBN).
1. Introduction Lifecycle models and development processes are useful means of describing the various phases of a development project, from the conception of a system to
Appendix B.1: P.16: Houmb and Georg (2005)
239
its eventual decommissioning [15]. Several standards exist to guide the development of critical systems, e.g. ISO/IEC 61508 Functional safety of electical/electronic/progammable electronic safety related systems [7] for safety-critical systems and ISO 15408 Common Criteria [8] for security critical systems. Certi…cation of critical systems is only concerned with development and design activities [13]. For security critical systems this is not su¢ cient. The security level of an resulting system is not just dependent on the quality of the development process, since such systems are subject to in‡uence from the dynamics of its rapidly changing environment. The aspect-oriented risk-driven development (AORDD) framework addresses these issues through its aspect-oriented risk-driven development process, and in particular through the AORDD costbene…t trade-o¤ analysis. The analysis aims at identifying the most cost-e¤ective set of treatment strategies. The analysis consists of two main phases. The …rst phase deals with evaluating risks against a set of risk acceptance criteria, while the second phase compute Return of Security Investment (RoSI) for security risk treatment strategies and Return of Project Investment (RoPI) for project strategies. The AORDD cost-bene…t trade-o¤ analysis is implemented using Bayesian Belief Nets (BBN). Due to space restrictions we focus on security related product risks in this paper. Project risks are handled using the same techniques.
2. Related Work Risk-driven development combines development and risk management to e¤ectively handle security issues throughout the development. The main goal is to cost-e¤ectively achieve a correct level of security. The two most important riskdriven approaches in this context are the CCTA Risk Analysis and Management Methodology, CRAMM, [2] and the CORAS framework [12]. CRAMM o¤ers a structured approach to manage computer-based systems. CRAMM is assetdriven, meaning that the focus is on identifying the main assets connected to the system as well as identify and assess risks to those assets. The CORAS framework is inspired by CRAMM and has adapted the asset-driven strategy. CORAS uses UML as their modeling language in the context of model-based risk assessment (MBRA). A growing number of researchers are developing approaches that supports multidimensional separation of concerns throughout the development. In the Aspect Oriented Modeling (AOM) approach developed by the AOM team at Colorado State University (CSU) [3] UML aspect models are used to describe crosscutting solutions that address dependability concerns such as security.
240
Appendix B.1: P.16: Houmb and Georg (2005) AORDD framework
Aspect repository
Estimation repository
BBN-based cost-benefit trade-off analysis
Rules for how to annotate UML models
Rules for transferring info to the BBN topology
Fig. .1. The main components of the AORDD framework
Our work makes use of the asset-driven approach of CRAMM and is based on the integrated system development and risk management process of CORAS. The CORAS approach is integrated with the AOM approach developed at CSU to provide support for specifying and implementing security risk treatments as aspects, and thereby support the process of evaluating alternative treatments as input to the AORDD cost-bene…t trade-o¤ analysis.
3. The AORDD Framework The AORDD framework combines risk-driven development (RDD) with aspect oriented modeling (AOM). The framework consists of the iterative AORDD process, security treatment aspect repository, estimation repository, rules for how to annotate UML models with information used for estimation, a BBN-based cost-bene…t trade-o¤ analysis, and rules for how to transfer information from the annotated UML models into the BBN topology. Fig. 1 gives an overview of the main components of the AORDD framework, which is a subsystem of a larger prediction framework. The main component in the framework is the cost-bene…t trade-o¤ analysis. The other components in the framework are supportive components and provide information and services to the cost-bene…t trade-o¤ analysis. Fig. 2 gives an overview of the interaction between the trade-o¤ analysis and the supporting components. Whenever a decision request (1) is initiated the prediction manager sends a request to the composer, which integrates the aspect model with the primary model (2-4), and sends the composed model to the prediction manager (5). The predic-
Appendix B.1: P.16: Houmb and Georg (2005)
241
Fig. .2. Overview of the interaction between the components in the AORDD framework
tion manager examines the composed model to identify the type of system and the quality attributes that needs to be estimated, which is annotated in the UML models. It then requests appropriate estimation sets (6 and 7) and feeds it into the BBN topology (8 and 9). The BBN topology is the implementation of the cost-bene…t trade-o¤ analysis. The estimation repository is connected to the security treatment aspect repository, where the aspect models is stored. Furthermore, for both repositories we have a company con…dentially and a public repository. These two repositories are updated whenever new information is available. A decision can be initiated at any time during a development and the repositories include information at di¤erent levels of abstraction. The structure of the repositories re‡ects the phases of the AORDD process (requirement, design, implementation, and maintenance) and are represented at di¤erent levels of abstraction within each phase. 3.1 Aspect Oriented Modeling (AOM) Aspect oriented modeling (AOM) techniques allow system developers to describe solutions that crosscut a design in separate design views called aspects [3]. An aspect is a pattern that characterizes a family of concern realizations. An aspect model consist of a set of Uni…ed Modeling Language (UML) diagrams, both structural and behavioral, specifying the internal structure and the behavior of the aspect. An AOM design model consist of one or more aspects models and a primary model, which is speci…ed using a set of UML diagrams. The aspect models describe solutions that crosscut the modular structure of the primary model.
242
Appendix B.1: P.16: Houmb and Georg (2005)
Using the AOM approach, developers of security-critical systems can separate security treatment strategies from other concerns, by modeling security treatments as aspects. This eases the evolving of security mechanism, as well as the evaluation of alternative treatment strategies in the trade-o¤ analysis.
4. The AORDD process The AORDD process [5] is based on the CORAS iterative system development and risk management process, structured according to the phases of the Rational Uni…ed Process (RUP), and the viewpoints of the Reference Model for Open Distributed Processing (RM-ODP). In each iteration, one design, analyze, and compose a part of the system or the system as a whole according to a particular RM-ODP viewpoint. Fig. 3 illustrates the iterative nature of the AORDD process, consisting of a requirement phase, a design phase, implementation phase, deployment phase, and a maintenance phase. Development spirals through requirements to maintenance, and in each phase development activities are structured into iterations. Work moves from one phase to the next after …rst iterating through various sub-phases that end with acceptable testing results. In the AORDD framework we focus on the requirement and design phase. Details on the main steps in these two phases is given in Fig. 4. The result of a risk assessment is a set of misuses and a set of alternative security treatment strategies. Each security treatment strategy is modeled as an aspect to enhance software evolution, software reuse, and to ease the evaluation of the strategies. Security risk treatment aspects are possible solutions to the misuses, which are evaluated in the AORDD cost-bene…t trade-o¤ analysis. This is done by assessing the e¤ect and cost of each treatment strategy. The use of aspects in the trade-o¤ analysis makes it easy to swap in and out strategies and compute their e¤ect. To evaluate treatment e¤ect and to validate the quality of a treatment strategy the aspect models need to be weaved with the primary model. In order to make sure that a treatment strategy ful…ls the requirements each composed model is tested. As illustrated in Fig. 4 we have both a risk assessment and a testing activity. The risk assessment activity addresses security risks or a design stress point, while the testing activity covers design ‡aws. A design ‡aw is undesirable emergent behavior arising as a result of integrating aspects with primary model, while a design stress point is a non-robust part of the design that can be exploited to produce unauthorized behavior, a vulnerability. The main di¤erence between the testing and the risk assessment activity is that risk assessment focus on how
Appendix B.1: P.16: Houmb and Georg (2005)
Fig. .3. Outline of the AORDD process
Fig. .4. Details for the requirement speci…cation and design phase
243
244
Appendix B.1: P.16: Houmb and Georg (2005)
the system environment may in‡uence the system, while testing tries to uncover ‡aws within the system. The methods used for testing depends on the size and the criticality of the system, and might involve model checking and di¤erent types of testing, utilizing formally de…ned operational semantics for UML models that supports rigorous static and dynamic analysis.
5. Concepts and ontology for the AORDD framework Risk management is the culture, processes, and structures that are directed towards e¤ective management of potential opportunities and adverse e¤ects [1]. Since managing risks is a multidisciplinary task and involves a variety of stakeholders we need to establish a common understanding of the concepts involved, as well as their relations. In AORDD the decision support for management of risks is handled by the costbene…t trade-o¤ analysis. The input to the trade-o¤ analysis is the result from risk assessment, which includes risk identi…cation, analysis, evaluation, and treatment [5]. Fig. 5 illustrate the relationship between the main concepts involved in AORDD risk assessment. This represents the AORDD risk assessment ontology, which speci…es the structure of the inputs to the AORDD cost-bene…t trade-o¤ analysis. Assets are something to which an organization directly assigns value and, hence, for which the organization requires protection [1]. One asset has one associated value for each stakeholder. The asset value is measured in terms of the importance to the business. These values are usually expressed in terms of potential business impacts of misuses. This could, in turn, lead to …nancial losses, loss of revenue, market share, or company image. Assets are part of the target of assessment, which speci…es the boundaries for what is being assessed. A security policy describes rules, directives, and practices that govern how assets are managed, protected, and distributed within an organization and its information systems [9]. Security policies pose security requirements upon a target of assessment. These requirements are designed to protect the value of assets. A security threat is a potential cause of an misuse, which may lead to harm to a system or organization [9]. One or more security threats may exploit one or more vulnerability and lead to a misuse. Each misuse has an associate impact and frequency of occurrence. An impact leads to loss of asset value. The combination of misuse, impact, and frequency comprise the risk level. Security risk acceptance criteria describes acceptable levels of loss. Security risk treatment represents the selection and implementation of appropriate options for dealing with risks [1]. Treatments
Appendix B.1: P.16: Houmb and Georg (2005)
245
Fig. .5. Concepts and their relationship in AORDD
are directed towards misuse and designed to reduce their frequency, impact or both. The AORDD risk assessment ontology represents an enterprize (high level overview) view of the relations we need to specify in order to compute RoSI. The ontology represents a general description of the situation for a security critical system at any time in its life-cycle. This means that it needs to be re…ned for each type of security critical system assessed.
6. The BBN-based AORDD cost-bene…t trade-o¤ analysis The trade-o¤ analysis consist of two phases: 1.) Evaluate security risks against security acceptance criteria and 2.) Trade-o¤ design alternatives by computing and comparing Return of Security Investments (RoSI) of treatment strategies. The …rst phase takes the set of identi…ed misuses and their associated risk levels as input and evaluate them against a set of security risks acceptance criteria. The result of this phase is a list of misuses in need of treatment. Security risk acceptance criteria addresses risk level. An example of such a criteria is that all
246
Appendix B.1: P.16: Houmb and Georg (2005)
Fig. .6. Overview of the trade-o¤ analysis
risks greater than or equal to security risk level “HIGH” must be treated. In this context treated means reducing the risk level to lower than “HIGH”. Such criteria should be provided either by the decision-makers, or through the business security policy or similar information sources. Note that all security risks lower than “HIGH” is disregarded. Inputs to the second phase is the list of misuses in need of treatment, as well as a list of alternative security treatment strategies. The evaluation is done using a set of priorities, standards, laws and regulations, and in particular business strategies and policies. RoSI for a particular strategy is derived by evaluating treatment strategy e¤ect and cost against misuse impact and frequency. Fig. 6 gives an overview of the trade-o¤ analysis. 6.1 The BBN topology The AORDD cost-bene…t trade-o¤ analysis is implemented using BBN [10]. Fig. 7 depict the top level BBN for phase 2. The target node is RoSI. The nodes budget (BU), law and regulations (LR), security risk acceptance criteria (SAC), policies (POL), and priorities (PRI) is observable nodes, meaning that these nodes represent information and evidence that can be directly observed or in other ways obtained. The node security level (SL) is an intermediate node and requires inputs from other nodes. The node SL receives information and evidence from the three intermediate nodes static security level (CC EAL), dynamic security level (OS
Appendix B.1: P.16: Houmb and Georg (2005)
247
Fig. .7. Top level BBN for AORDD cost-bene…t trade-o¤ analysis
DL), and treatment level (TL). Each of these three nodes are decomposed into BBN subnets, and receives information and evidence from its respective subnets. The target node, RoSI, represent the objective of the assessment. The node is described using eight variables: cost, con…dentiality, integrity, availability, nonrepudiation, accountability, authenticity, and reliability. The node BU, the budget available for mitigating misuses, is given as the interval [min, max]. The other observable nodes in the top-level BBN is described using the seven security attributes as de…ned by the security standard ISO 13335 [9] as variables. When doing trade-o¤ the values of the strictest sequence of the variables POL, SAC, LR, BG, and BU is inserted into the intermediate node AL, acceptance level, and evaluated against the values of the variables of the intermediate node security level (SL). SL is computed by evaluating TL, treatment level, against OS DL, the dynamic security level, and CC EAL, the static security level. The variables of the node SL is cost, con…dentiality, integrity, availability, non-repudiation, accountability, authenticity, and reliability, which is the same as for the target node. The variable cost is given as (T E T C) (M F M I), where T E = treatment e¤ ect, T C = treatment cost, M F = misuse frequency, and M I = misuse impact. Note that in order to consider interrelations between misuses and treatment strategies one need to group misuses and treatments into themes before doing trade-o¤.
248
Appendix B.1: P.16: Houmb and Georg (2005)
7. Annotating UML models with information used for estimation UML is a family of languages, which means that one needs to tailor the use of UML for di¤erent domains. This is done using UML pro…les. There exist a set of UML pro…les targeting the security domain, such as UMLsec [11], SecureUML [14], and the CORAS UML pro…le for MBRA [16]. Due to space restrictions we here only describe the information that needs to be annotated for the prediction manager to identify the type of system and the related attributes used for estimation. Recalling the AORDD risk assessment ontology from Section 5. The BBN topology covers the concepts and relations as described in the ontology. However, to compute RoSI of treatment strategies we need to add annotations to the target of assessment models, which is modeled using UML. Annotations are modeled using the standard UML extension mechanisms, Stereotypes and tagged values. Stereotypes de…ne new types of modeling elements. Their notation consists of the name of the stereotype written in double angle brackets , attached to the extended model element. This model element is then interpreted according to the meaning ascribed to the stereotype. To explicitly de…ne a property of a stereotype one attach a tagged value to a model element. A tagged value is a name-value pair, where the name is referred to as the tag. The corresponding notation is {tag=value} with the name tag, and a corresponding value to be assigned to the tag. Estimation sets are domain speci…c. In order to make the prediction manager able to select the right estimation set from the estimation repository it needs to know the type of system being assessed. This is annotated using stereotypes as depict in Fig. 8. The frame is not part of the UML model, but added to mark the boundaries of the system, to limit the area where the prediction manager search for information (which means that it can consist of a set of UML diagrams). When modeling a system one makes use of a set of UML diagrams, both structural and behavior models. The annotations given in this section is general, meaning that the same annotations are used across the di¤erent UML diagrams. Fig. 9 gives an overview of the annotations used.
Appendix B.1: P.16: Houmb and Georg (2005)
249
{type=ecommerce}
ToA UML models
Fig. .8. Annotating type of system for UML models
8. Rules for how to transfer information from the annotated UML models into the BBN topology Recall that security treatment strategies are modeled as aspects. When doing trade-o¤ between alternative treatment strategies in AORDD we consider one treatment strategy at the time. As described earlier, aspects are used to separate security concerns from the primary model. This makes it easy to swap strategies in and out. Before trade-o¤ the prediction manager traverse the primary model for input to the BBN topology. Then the particular misuse scenario (for which we want to treat) is composed with the primary model. This identi…es impacts of the misuse as well as their associated cost. Finally, we weave the aspect model with the primary model to examine treatment e¤ect and cost. The reader is referred to [3] for details on weaving strategies. The information provided by the primary model, before composed with the misuse and weaved with the aspect, provides input to the CC EAL subnet. The composed misuse scenario and primary model gives input to the OS DL subnet, and the weaved aspect and composed model gives input to the treatment level subnet. The observable nodes in the top level BBN is given otherwise, as discussed earlier.
9. Conclusion and further work The AORDD framework handles project and product risks as an integrated part of the development. In this paper we have focused on security related product risks. In AORDD risks are addressed through a set of speci…c activities in the development process. Cost-e¤ective treatment of security risks is expressed in
250
Appendix B.1: P.16: Houmb and Georg (2005)
Fig. .9. Annotations of information used as input to the BBN topology
Appendix B.1: P.16: Houmb and Georg (2005)
251
terms of RoSI, which is computed in the BBN-based AORDD cost-bene…t tradeo¤ analysis. The trade-o¤ analysis is the main component of the framework and requires a set of supporting components, the security treatment aspect repository, the estimation repository, rules for how to annotate UML models with information used for estimation, and rules for how to transfer information from the annotated UML models into the BBN topology. Due to space restrictions we have not included an example in this paper. Examples can be found in [4] and [6]. Future papers will provide an extensive example to demonstrate the feasibility of the AORDD framework, as well as give more thorough description of the supporting components. We will also concentrate on establishing the public version of the security treatment aspect and estimation repositories.
References 1. AS/NZS. AS/NZS 4360:1999, Risk Management. Standards Australia, Strath…eld, 1999. 2. B. Barber and J. Davey. The use of the ccta risk analysis and management methodology cramm in health information systems. In K.C. Lun, P. Degoulet, T.E. Piemme, and O. Rienho¤, editors, MEDINFO 92, pages 1589–1593, Amsterdam, 1992. North Holland Publishing Co. 3. G. Georg, R. France, and I. Ray. An aspect-based approach to modeling security concerns. In Workshop on Critical Systems Development with UML (CSDUML’02). Dresden, Germany, October 2002. 4. S. H. Houmb, G. Georg, R. France, J. Bieman, and J. Jürjens. Cost-bene…t trade-o¤ analysis using bbn for aspectoriented risk-driven development. Accepted for the International Conference on Engineering of Complex Computer System (ICECCS2005) in Shanghai, China, 16-20 June 2005. 5. S. H. Houmb, G. Georg, R. France, and D. Matheson. Using aspects to manage security risks in risk-driven development. In 3rd International Workshop on Critical Systems Development with UML, number TUM-I0415, pages 71– 84. TUM, 2004. 6. S. H. Houmb, G. Georg, R. France, R. Reddy, and J. Bieman. Predicting availability of systems using bbn in aspectoriented risk-driven development (aordd). In Proceeding of SCI 2005, RMCI 2005, Orlando, July 2005. 7. ISO/IEC. ISO/IEC 61508 Functional safety of electical/ electronic/progammable electronic safety–related systems, 1998. 8. ISO/IEC. Common Criteria for Information Technology Security Evaluation, Version 2.1, CCIMB–99–031 edition, August 1999.
252
Appendix B.1: P.16: Houmb and Georg (2005)
9. ISO/IEC. ISO/IEC 13335: Information technology –Guidelines for management of IT Security, 2001. 10. F. Jensen. An introduction to Bayesian Network. UCL Press, University College London, 1996. 11. J. Jürjens. Secure Systems Development with UML. Springer-Verlag, Berlin Heidelberg New York, 2004. 12. K. Stølen, F. den Braber, R. Fredriksen, B. A. Gran, S. H. Houmb, Y. C. Stamatiou, J. Ø. Aagedal. Model-based risk assessment in a component-based software engineering process - using the CORAS approach to identify security risks, chapter Chapter 11 in Business Component-based Software Engineering. Kluwer Academic Publishers, 2002. 13. B. Littlewood, S. Brocklehurst, N. Fenton, P. Mellor, S. Page, D. Wright, J. Dobson, McDermid J., and D. Gollmann. Towards operational measures of computer security. Journal of Computer Security, 2:211–229, 1993. 14. T. Lodderstedt and J. Basin, D. Doser. SecureUML: A UML-Based Modeling Language for Model-Driven Security. In Proceedings of UML 2002 – The Uni…ed Modeling Language, 2002. 15. N. G. Leveson. Safeware: System Safety and Computers. Addison–Wesley, 1995. ISBN 0-201-11972-2. 16. S. H. Houmb, F. den Braber, M. Soldal Lund, K. Stølen. Towards a UML pro…le for Model–Based Risk Assessment. In UML’2002, Satellite Workshop on Critical Systems Development with UML, 2002.
Appendix B.2: P.26; Houmb et al. (2006)
Siv Hilde Houmb, Geri Georg, Robert France, and Jan Jürjens. An Integrated Security Veri…cation and Security Solution Design Trade-o¤ Analysis. In Haralambos Mouratidis and Paolo Giorgini (Eds), Integrating Security and Software Engineering: Advances and Future Visions. Chapter 9, Pages 190-219. Idea Group Inc, 2007. ISBN: 1-59904-147-6. 288 pages.
254
Appendix B.2: P.26; Houmb et al. (2006)
An Integrated Security Veri…cation and Security Solution Design Trade-O¤ Analysis Approach Siv Hilde Houmb1 , Geri Georg2 , Jan Jürjens3 , and Robert France2 1
Department of Computer and Information Science, Norwegian University of Science and Technology, Sem Sælands vei 7-9, NO-7491 Trondheim, Norway Phone: +47 7359 3440 Fax: +47 7359 4466
[email protected] 2
Department of Computer Science, Colorado State University, 601 S. Howes St., Fort Collins, CO-80523-1873, USA Phone: +1 970 491 6765 Fax: +1 970 49 2466
{georg/france}@CS.ColoState.EDU 3
Systems Engineering,
TU Munich, Boltzmannstr. 3, 805748 München/Garching, Germany Phone: +49 89 289 17338 Fax: +49 89 289 17307
[email protected]
Appendix B.2: P.26; Houmb et al. (2006)
255
Abstract This chapter describes the integrated security veri…cation and security solution design trade-o¤ analysis (SVDT) approach. SVDT is useful when there is a diverse set of requirements imposed upon a security critical system, such as a required security level, time-to-market and budget constraints and end users’ expectations. Balancing these needs requires developers to evaluate alternative security solutions, and SVDT makes this evaluation e¤ective. UMLsec, an extension to UML for secure systems development, is used to specify security requirements, and UMLsec tools are used to verify if the alternative design solutions satisfy security requirements. Veri…ed design alternatives are then evaluated by the security solution design trade-o¤ analysis. The trade-o¤ analysis is implemented using Bayesian Belief Nets (BBN) and makes use of a set of trade-o¤ parameters, such as budget, business goals, and time-to-market constraints, to support design decisions regarding how to best meet security requirements while also ful…lling other diverse system requirements.
Keywords: Software Development, Decision Support Systems – DSS, Software Evaluation, IT Evaluation Methods, Bayesian Belief Networks (BBN), Security Veri…cation, Aspect-Oriented Modeling (AOM), Software Architecture, Quality of Service, Security Management, Security Risk, Decision Models, Internet Security, Web-Based Applications; E-Commerce Models, E-Commerce Measurement
1. Introduction Security critical systems must perform at the required security level, make e¤ective use of available resources and meet end-user expectations. Balancing these needs, while ful…lling budget and time-to-market constraints, requires developers to design and evaluate alternative security solutions. Standards and techniques exist to aid in this work, but most address a single facet of a system, such as its development, or rely on specially trained assessors. For example, ISO 15408 Common Criteria for Information Technology Security Evaluation (ISO15408, 1999) is based on a qualitative assessment, performed by one or a few certi…ed assessors, and focuses on system development activities. The Common Criteria certify security critical systems against seven Evaluation Assurance Levels (EAL) that de…ne the security level of a target system. The Common Criteria do not capture the notion of a system’s operational security level. This is the security level observed during its operation at a particular point in time, as described by Littlewood (1993). Trade-o¤ techniques, such as ATAM (Kazman et al., 2000) and CBAM (Kasman et al., 2002) provide well-tested approaches to aid decision making at the architectural level. CBAM also takes economical implications into consideration during the analysis. However, these techniques rely on the presence
256
Appendix B.2: P.26; Houmb et al. (2006)
of an assessor who is familiar with the technique and who has proper experience in multiple areas of architectural trade-o¤ analysis. This makes it di¢ cult for developers with little experience in the security domain, or with trade-o¤ analysis processes, to consider alternative security solutions during system design. Evaluating solution alternatives during design is critical to providing security by design within budget constraints. Security and architectural evaluations are also, in many cases, time-consuming and resource intensive, which precludes their use in situations where time-to-market, budget and rapid incremental development constraints exist. The integrated security veri…cation and security solution design trade-o¤ analysis (SVDT) approach described in this chapter takes into consideration both development and operational security level concerns by integrating security veri…cation, risk assessment, design trade-o¤ analysis and relevant parts of the Common Criteria. SVDT consists of four main steps: (1) identify potential misuses and assess their risks, (2) identify alternative security solutions for misuses that must be addressed, (3) perform UMLsec security veri…cation of these security solutions to ensure they prevent the target misuse and (4) perform security solution design trade-o¤ analysis among the alternative solutions. This chapter focuses on steps (3) and (4), using UMLsec and its related toolsupport to verify that potential security solutions do meet their intended requirements, and using a trade-o¤ analysis tool that evaluates the relative ability of di¤erent solution designs to meet the complete set of system constraints. The trade-o¤ tool incorporates the notion of a static security level to address the security level derived from development activities, and a dynamic security level to address the security level derived from predicting events when the system is operating. Determination of the static security level is based on the Common Criteria recommendations, while the dynamic security level is derived from information regarding both normal use and potential misuse of the system. The dynamic security level is estimated using a prediction model (Houmb et al., 2005b) that uses the following parameters: misuse frequency (MF), misuse impact (MI), security solution cost (SC) and security solution e¤ect (SE). The static security level, dynamic security level, standards, policies, laws and regulations, priorities, business goals, security risk acceptance criteria, and time-tomarket (TTM) and budget constraints are all parameters to the trade-o¤ analysis, which computes the Return on Security Investment (RoSI) for each security solution. To better facilitate the trade-o¤ analysis and security veri…cation, an aspect-oriented modelling (AOM) technique is used to separate security solutions from system core functionality. Security solutions are speci…ed and analysed in isolation before examining their in‡uence on the system. Inappropriate or insuf…cient solutions that fail security veri…cation can be quickly discarded from con-
Appendix B.2: P.26; Houmb et al. (2006)
257
tinued consideration, while complete analysis is reserved for the most promising alternatives. The results of trade-o¤ analysis of di¤erent design alternatives are compared using their Return on Security Investment (RoSI) value, and developers can make decisions regarding which alternatives best meet security requirements while also meeting other diverse system constraints. The chapter is organised as follows. Background information on the techniques used in SVDT and related techniques is presented in the next section. This is followed by a discussion of the SVDT approach, concentrating on security veri…cation and security solution design trade-o¤ analysis. Both of these topics are presented in detail, in the context of a running example of the design of a portion of an e-Commerce prototype platform. Future trends in the design of security critical systems follow this discussion, and the chapter concludes with a discussion of the controlled development of secure systems.
2. Background Techniques used in SVDT to facilitate security veri…cation and security solution design trade-o¤ analysis are presented in this section. We also discuss other techniques often used in these areas and their relation to the SVDT approach. The SVDT approach is based on model-driven development (MDD). MDD is a development method proposed by the Object Management Group (OMG) in which software development activities are carried out on models (OMG, 2003). The goal is to obtain the implementation of a system by transforming models from high levels of abstraction to lower levels of abstraction and eventually into code. Analysis and re…nement can occur at any level of abstraction. Risk-driven development is used in conjunction with MDD to combine development and security risk management throughout system development. Model-based risk-driven development uses models to identify security risks, assess alternative treatments to these risks, and document the resulting design. The goal of model-based riskdriven development is to cost-e¤ectively achieve a required level of security. The two steps of the SVDT approach that are discussed in detail in this chapter are security veri…cation of potential solutions and security solution design tradeo¤ analysis among these potential designs. Both steps require that alternative design solutions be easily analysed and interchanged in the system design. For this reason the SVDT approach uses AOM techniques. AOM allows the separation of security solutions from system core functionality. Security solutions can then be analysed to verify their security properties without the added complexity of other system components. The security solutions must be integrated (or composed) into the core system design for trade-o¤ analysis, and AOM techniques also support
258
Appendix B.2: P.26; Houmb et al. (2006)
this integration. Analysing an alternative solution is easily achieved by integrating it with the core system and performing the analysis again. The AOM technique allows reuse of previous experience and domain knowledge since the security solution design aspects are completely reusable in their generic form. Aspects are UML template patterns speci…ed using a specialised role-based modelling language and must be instantiated in the context of a system prior to composition (France et al., 2004a). The instantiation step includes binding the names of model elements in the aspect to those of comparable model elements in the core design. Model elements that are targets of composition are unrestricted as long as they are speci…ed as targets in the aspect. Thus, classes, methods, attributes, relations, arguments, sequence fragments, messages, stereotypes and tags are all potential points where composition can occur. Composition consists of merging two models using default merging rules. Composition can result in adding model elements, deleting model elements, replacing model elements, or augmenting, deleting or replacing behaviour (France et al., 2004b). Composition directives can be used when it is necessary to change the default merging rules to obtain correct behaviour in the composed model (Straw et al., 2004). We have developed composition techniques for UML static structure diagrams and sequence behaviour diagrams. The composition of sequence diagrams is used in the SVDT approach. Our AOM techniques di¤er from others in two respects. First, many AOM techniques require that an aspect contain information regarding where and how in the system core functionality it will be applied (Jacobson, 2003a; Jacobson, 2003b; Kiczales et al., 2001), whereas our generic aspect models have no knowledge of any core system and are thus completely reusable. We create context-speci…c aspect models to specify system-speci…c information regarding where the aspect will be applied through model element name bindings. Secondly, other AOM techniques typically provide composition mechanisms to augment or replace model elements and behaviour (Clarke, 2002; Clarke et al., 2005), but we have also found the need to delete model elements and behaviour, as well as interleave behaviour. These capabilities are included in our AOM techniques. Recall that in step (3) of the SVDT approach, security veri…cation is performed on potential security solutions. SVDT uses security veri…cation for two purposes. The …rst purpose of security veri…cation is to verify that potential security design solutions ful…l their respective security requirements. The second purpose is to verify that these potential designs prevent the targeted misuse scenarios. Security requirements and potential design solutions must therefore be speci…ed using a method that supports veri…cation. Although there are many possible security veri…cation approaches, we have chosen UMLsec because of its link to UML and the tool-support it provides (Jürjens, 2004). UMLsec eases the task of integrating AOM techniques, security veri…cation and security solution design trade-o¤
Appendix B.2: P.26; Houmb et al. (2006)
259
analysis through its capabilities. AOM techniques, UMLsec security veri…cation and trade-o¤ analysis are linked together in such a way that each builds on the other to make the process as e¢ cient as possible. Security design solutions and security requirements are both speci…ed using UMLsec, and this allows us to use UMLsec tool-support to verify whether potential designs meet their requirements. UMLsec is also used to model adversary behaviour in a misuse scenario, and again its tool-support can be used to verify whether a potential design solution prevents the adversary from successfully achieving the misuse. The security veri…cation is thus used to ensure that only those security solutions that will ful…l the security requirements and su¢ ciently solve the misuse scenarios are evaluated in the trade-o¤ analysis. The security solution design trade-o¤ analysis step of the SVDT approach utilises a specialised trade-o¤ analysis tool that is based on Bayesian Belief Networks (BBN). Related trade-o¤ analysis techniques exist, but none are tailored to the security domain. This does not mean that one cannot use these techniques when performing security solution design trade-o¤ analyses, but rather that a specialised technique is more e¢ cient, particularly for developers unfamiliar with the security domain. The main reason for this is that the e¤ects of a series of security solution decisions are conceptually hard for humans to analyse due to the interrelations and dependencies between the security solutions. The two most often used software design trade-o¤ analysis methods are the Architecture Tradeo¤ Analysis Method (ATAM) and the Cost Bene…t Analysis Method (CBAM). In addition, there are variations on these two methods available. Both ATAM and CBAM were developed by the Software Engineering Institute (SEI). The focus of ATAM is to provide insight into how quality goals interact with and trade o¤ against each other. ATAM consist of nine steps and aids in eliciting sets of quality requirements along multiple dimensions, analysing the e¤ects of each requirement in isolation, and then understanding the interactions of these requirements. This uncovers architectural decisions, which are then linked to business goals and desired quality attributes. CBAM is an extension of ATAM and looks at both the architectural and the economic implications of decisions. The focus in CBAM is on how an organisation should invest its resources to maximise gains and minimise risks. CBAM is still an architecture-centric method, but incorporates cost, bene…t and schedule implications of decisions into the trade-o¤ analysis. The security solution design trade-o¤ analysis presented in this chapter is a security speci…c design trade-o¤ analysis. It incorporates ideas from both ATAM and CBAM and is extended to use security solution and misuse-speci…c parameters, in addition to the economic implications, as input to the trade-o¤ analysis. It is also extended to evaluate the required security level by combining both static and
260
Appendix B.2: P.26; Houmb et al. (2006)
dynamic security levels. Analysing the consequence of security solution design decisions is also supported, because a composed model containing both the system and security solution is utilised. Because the security solution design trade-o¤ analysis is coupled with AOM techniques, analysing several di¤erent alternatives is easy to do and developers can test a wide range of possible alternatives in order to …nd the design that presents the best ful…lment of competing requirements.
3. The Approach System security consists of de…ning, achieving and maintaining the following properties: con…dentiality, integrity, availability, nonrepudiation, accountability, authenticity and reliability, as de…ned by the security standard ISO 13335: Information technology - Guidelines for management of IT Security (ISO13335, 2001). The integrated SVDT approach targets all security properties, however the example given in this chapter only considers the security property con…dentiality, which is also referred to as secrecy. SVDT consists of the following four steps: (1) identify potential misuses and assess their risks, (2) identify alternative security solutions for misuses that must be addressed, (3) perform UMLsec security veri…cation of these security solutions to ensure they prevent the target misuse and (4) perform security solution design trade-o¤ analysis among the alternative solutions. This chapter focuses on step (3), the security veri…cation of security solutions, and step (4), security solution design trade-o¤ analysis. Step (1), identify potential misuses and assess their risk, and step (2), identify alternative security solutions, are performed using the CORAS risk assessment platform (CORAS Platform, 2005). This platform is based on the CORAS model-based risk assessment methodology (Stølen et al., 2002). For the reminder of the chapter we therefore assume that potential misuses, their associated risk and potential alternative security solutions are already identi…ed and assessed. Fig. 1 shows an overview of the SVDT approach for steps (3) and (4). The alternative security solutions for a particular misuse are represented by the set A, where a represents one of the security solutions in A. Security solutions are modelled as security aspects using UMLsec notation and security veri…cation is performed using UMLsec tools. Design trade-o¤ analysis is only performed on a security solution if it passes the veri…cation by the UMLsec tools.
Appendix B.2: P.26; Houmb et al. (2006)
261
Fig. .10. Overview of the security veri…cation and security solution design trade-o¤ analysis (SVDT) approach
3.1 Security Veri…cation The security veri…cation performed in step (3) of the SDVT approach uses the UMLsec pro…le and tools (Jürjens, 2005). Potential security design solutions must be modelled as security aspects using the pro…le. 3.1.1 UMLsec The UMLsec pro…le allows a developer to specify security-related information within the diagrams of a UML system speci…cation. The pro…le uses the standard UML extension mechanisms stereotypes, tagged values and constraints. Stereotypes are used together with tags to formulate security requirements and assumptions related to the system environment, and constraints give criteria used to determine whether the requirements are met by the system design. Stereotypes de…ne new types of modelling elements and extend the semantics of existing types or classes in the UML metamodel. Stereotype names are written in double angle brackets and are attached to a model element. The model element is then interpreted according to the extended meaning ascribed to the stereotype.
262
Appendix B.2: P.26; Houmb et al. (2006) Table 1. A subset of the UMLsec profile Base Class
Tags
Constraints
Description
critical
object, subsystem
secrecy, integrity, authenticity
data security
subsystem
adversary
secrecy, integrity and authenticity
basic data security requirements
secure links
subsystem
adversary
secrecy, integrity and authenticity matched by links
enforces secure communication links
LAN
link, node
LAN connection
Internet
link
Internet connection
Stereotype critical object or subsystem
Properties are explicitly de…ned by attaching a tagged value to a model element. A tagged value is a name-value pair, where the name is referred to as the tag. The notation is {tag=value} with value to be assigned to the tag. Information can also be added to a model element by specifying constraints to re…ne its semantics. Stereotypes are used to attach tagged values and constraints as pseudo-attributes of the stereotyped model elements. Table 1 presents a fragment of the UMLsec stereotypes, together with their tags and constraints. More details can be found in Jürjens (2004). Each stereotype in Table 1 can be applied to particular types of model elements. For example, the critical stereotype can be applied to an object or a subsystem, whereas the LAN stereotype must be applied to a link or a node. Speci…c tags can be associated with the stereotypes, e.g., secrecy can be associated with a critical subsystem, or adversary can be associated with a secure links subsystem. The adversary tag speci…es a type of attacker (e.g., default or insider ) and thus what type of adversary model should be used when verifying that a design meets its UMLsec speci…cation. An adversary model speci…es what capabilities an attacker has; for example, a default adversary has the ability to read, delete, insert and access information passed across an unencrypted Internet link. 3.1.2 Security Requirements for ACTIVE Modelled using UMLsec The example used in this chapter is an e-Commerce platform prototype that provides electronic purchase of goods over the internet. The ACTIVE e-Commerce platform prototype was developed by the consortium of the EU project EP-27046ACTIVE (ACTIVE, 2001). The design models presented here are a combination of re…ned models based on design descriptions provided by the ACTIVE project and new design models that take into consideration the result of the three risk assessments performed by the EU-project IST-2000-25031 CORAS (CORAS
Appendix B.2: P.26; Houmb et al. (2006)
263
e-Commerce platform {adversary = default} User PC
e-Commerce Site Browser
HTTP
Application Server Web Server TCP/IP TCP/IP ISP/Proxy
JDBC
RDBMS
Fig. .11. e-Commerce platform deployment diagram (re…ned from ACTIVE designs)
Project, 2005). For details on ACTIVE, the reader is referred to the publications of the two EU projects. The infrastructure of the e-Commerce platform consists of a web server running Microsoft Internet Information Server (IIS), a Java application server (Allaire JSP Engine) and a database server RDBMS running Microsoft SQL server. The communication between the application server and the database is handled using the JDBC protocol. Potential customers access the web server from a Java enabled web browser using the HTTP protocol. The system deployment architecture is shown in Fig. 2. UMLsec, as described in the previous section, is used to model the security requirements. The security requirements can either be developed directly or derived from the results of a risk assessment giving misuses that need to be treated. In Fig. 2 the communication link l1 between the User PC and the e-Commerce Site is over the Internet using the communication protocol TCP/IP. The communication link l2 between server-side components (e.g., web server and application server) occurs over a LAN. The UMLsec de…ned stereotypes , and are used to indicate the type of communication link between nodes, and the stereotype is, as de…ned in the previous section, used to specify the requirements for data transmitted over the communication links. The meaning ascribed to the stereotype is speci…ed in the class diagram in Fig. 3. The example in this chapter uses the login mechanism of the ACTIVE platform. To access any of the services in the e-Commerce platform a user must either login as a visitor or as a registered user. The UMLsec stereotype , speci…ed for the subsystem S in the deployment diagram in Fig. 2, is re…ned
264
Appendix B.2: P.26; Houmb et al. (2006) eCommerceclient {secrecy=uname, pword} {authenticity= loginManager}
-uname -pword
loginManager
*
1
{secrecy=uname, pword} * {authenticity= eCommerceclient}
*
UAcctManager {secrecy=uname, pword} +validate()
+requestLoginPage() +login()
Fig. .12. e-Commerce platform login service class diagram
using the associated tagged values in the class diagram shown in Fig. 3. The security requirement “login information must be kept secret” means that the user name, modelled as uname in the class diagram, and password, modelled as pword in the class diagram, must be kept secret. In order to preserve the communicating parties also need to know the authenticity of the other party, which is modelled using the associated tagged values fauthenticity = loginM anagerg and fauthenticity = eCommerceclientg.
After specifying the system using UMLsec, the list of misuses in need of treatment is modelled as adversary models. Adversary models describe potential adversary behaviour and thus the set of concrete threats against the system. Adversary models are functions of the form that take an adversary type M and a stereotype s as inputs and return a subset of fdelete; read; insert; accessg as adversary capabilities. These capabilities are de…ned as follows: delete means that the adversary is able to delete data speci…ed as protected by the UMLsec stereotypes, read means that the adversary is able to read these data, insert means that the adversary is able to insert additional data, and access means that the adversary is able to access protected data. These functions are derived from the speci…cation of the physical layer of the system, which in this example is the deployment diagram in Fig. 2. The risk assessment of the ACTIVE user authentication mechanism (Dimitrakos et al., 2002) identi…ed the ACTIVE login process as being vulnerable to man-in-the-middle attacks. During this kind of attack user names and passwords can be intercepted by an attacker and used later to impersonate a valid user. This means that a default adversary (i.e., an attacker able to perform standard attacks) M , with communication stereotype s, has the set T hreatsM (s) = freadg for s = Internet and T hreatsM (s) = for s = LAN . Thus for communication link l1 = Internet in Fig. 2, the result is that the default adversary M can read the secret data, uname and pword, that are speci…ed in the class diagram of Fig. 3. One potential security solution for this misuse or adversary behaviour is to use transport layer security (TLS). Since the original TLS sequence includes potential vulnerabilities (Jürjens, 2004), a variant of TLS described by Jürjens (2004) is
Appendix B.2: P.26; Houmb et al. (2006) :|Client
265
:|Server init (iNonce, CPublicKey, selfSignedCCert (|C, CPublicKey))
extract (usingCPublicKey, |C, CPublicKey)
alt
[extractedCPublicKey = CPublicKey’ ] sign (usingSPrivateKey, sessionKey, iNonce', CPublicKey')
encrypt (usingCPublicKey', signedMessage) respond (encryptedSignedMessage, CASignedSCert (|S, SPublicKey))
extract (usingCAPublicKey, |S', SPublicKey')
alt
[|S’= |S] decrypt (usingCPrivateKey, encryptedSignedMessage)
extract (usingSPublicKey', sessionKey', iNonce', CPublicKey')
alt [iNonce’= iNonce and CPublicKey’= CPublicKey] |continue
[else] |abortCOperation
[else] |abortCOperation
[else] |abortSOperation
Fig. .13. TLS mechanism aspect; interaction template
used. This security solution is then modelled as a security aspect using UMLsec, and the UMLsec tools are used to verify that it meets the security requirements and prevents the attack. This security veri…cation occurs prior to evaluating the TLS security solution in the security solution design trade-o¤ analysis. 3.1.3 TLS Aspect Security Veri…cation Security veri…cation of the TLS aspect means checking whether the default adversary A will be able to obtain secret information. Fig. 4 depicts the interaction template for the security aspect variant of TLS. More information on the TLS aspect can be found in Houmb et al. (2005c). The TLS aspect model contains two class templates; client and server, which are shown as instances in the sequence diagram in Fig. 4. For the purposes of this example, certi…cate creation and certi…cate authority public keys are assumed to be obtained in a secure manner. The client must have the certi…cate authority’s public key and the server must have a certi…cate, signed by the certi…cate authority (CA), containing its name and public key. Primed variables are used to
266
Appendix B.2: P.26; Houmb et al. (2006)
distinguish between sent and received values. For example, the guard [jS0 = jS] tests the received value of jS against the previously sent value of the same variable. Other assumptions include the fact that both nonces (message sequence identi…ers) and session keys must change each time the protocol is initiated. Security veri…cation of the aspect model is performed by transferring the UML diagram in Fig. 4 to UMLsec formal semantics, which are expressed in terms of Abstract State Machines (ASMs). These ASMs are built on the UML statechart semantics described by Börger et al. (2000). Since the security aspect is analysed against the adversary behaviour, both the security aspect and the default adversary behaviour are modelled as an ASM adversary machine. The security aspect is executed in the presence of an adversary type M . The adversary machine models the actual behaviour of an adversary type M as part of the security aspect a. This is accomplished with an ASM consisting of two sets of information: (1) the set of control 2 State, where State is the complete set of states in the ASM and control is the set of control states; (2) the set of adversary knowledge K Exp, where Exp consists of all possible information that an adversary might gain, i.e., all UMLsec stereotyped data in the system speci…cation. In this example we are only interested in whether an adversary can gain the secret data uname and pword. The UMLsec tool iteratively executes the ASM according to the following schema: Specify the initial state control = control0 and the initial adversary knowledge Ko , Perform security analysis by checking the data in the link queues and, if the data of any of the link queues (in-queue and out-queue of link l connected to the current state) belonging to a link l with read 2 threatssM (l), where S denotes the subsystem being analysed, the data is added to K, else is unchanged, Chose the next control state non-deterministically from the set of control states. The veri…cation stops when all control states have been visited or if the secret knowledge has been gained, in our example that {uname, pword} . Since the UMLsec tool analyses link queues, these must be speci…ed for each message in Fig. 4. Message link queues are speci…ed by …rst placing the content of the message in the out-queue (outQu) of the sending object. Next the content of the message is sent on the communication link l by removing it from the out-queue of the sender and inserting it into the in-queue (inQu) of the receiver. For example, for the init(: : :) message in the TLS aspect, the content of the message is put in the out-queue of the Client, outQuC = fiN once; CP ublicKey; self SinedCCert(jC; CP ublicKey)g. The message is sent on the communication link l1 (since the communication between client =
Appendix B.2: P.26; Houmb et al. (2006)
267
eCommerceclient and server = loginM anager is over the Internet as speci…ed in the deployment diagram in Fig. 2) by removing the content from the out-queue for the client outQuC and inserting it into the in-queue of the Server inQuS. Since this message does not contain the secret data uname and pword, the adversary does not gain the data. Each control state is visited, and each message is processed as described above. None of the messages in the TLS aspect contain the secret data uname and pword, so this information is never added to K. Thus, the security of the aspect is veri…ed, and the tool gave this result in …ve seconds. 3.2 Security Solution Design Trade-O¤ Analysis When choosing among alternative security solutions the decision-maker needs a measurable and relational expression of the security level of the alternative security solutions. The security solution design trade-o¤ analysis supports this by computing and comparing the expected RoSI of the security solutions. RoSI is computed using a set of trade-o¤ parameters, such as priorities, security risk acceptance criteria, standards, laws and regulations, and in particular, business goals, budget, TTM and policies. RoSI for a particular solution is derived by evaluating the e¤ect and cost of the solution against the security requirements, or the misuse impact and frequency, if the solution is intended to treat a misuse. Fig. 5 gives an overview of the security solution design trade-o¤ analysis. The parameters on the left side of the …gure (security requirement, solution e¤ect, solution cost, misuse cost and misuse impact) are input parameters, meaning the information that is traded o¤. The parameters on the right side of the …gure (security risk acceptance criteria, standards, policies, laws and regulation, priorities, business goals, TTM and budget) are trade-o¤ parameters, meaning the information that is used to trade-o¤ the input parameters. There might be other input and trade-o¤ parameters that are important and should be included, which can be done by tailoring the trade-o¤ analysis, as discussed later in the chapter. Potential misuses may reduce the security level of a security solution and are measured in terms of misuse frequency or probability and misuse impact. Misuse impact is given in terms of loss of asset value, and misuse frequency refers to the anticipated number of times within a time period p that the misuse might occur. Asset is something to which an organisation directly assigns value and, hence, for which the organisation requires protection (AS/NZS 4360, 2004). The value of assets is given in terms of their importance to the business. Security solutions address misuses by either reducing their impact, frequency or both and include mechanisms such as encryption, security protocols, authentication protocols, security extensions to applications and protocols and other similar
268
Appendix B.2: P.26; Houmb et al. (2006)
solution effect solution cost misuse frequency misuse impact
Trade-off analysis
security risk acceptance criteria policies standards laws and regulation priorities business goals budget TTM
RoSI
Fig. .14. Overview of the trade-o¤ analysis
techniques. Each security solution is characterised by its security properties, its e¤ect and its cost. 3.2.1 Structure of the Trade-O¤ Analysis For each security solution, the solution treatment e¤ect SE and the solution cost SC need to be estimated. This is done using appropriate estimation sets (Houmb & Georg, 2005a). If estimation information does not exist, one may collect and combine such information using di¤erent information sources as described by Houmb (2005). The structure of the trade-o¤ analysis is constructed such that it is easy to tailor, change and maintain. The structure supports a step-wise trade-o¤ procedure and is hierarchically constructed. The step-wise trade-o¤ procedure is as follows: 1. Estimate the input parameters in the set I, where I = fM I; M F; SE; SCg and M I is misuse impact, M F is misuse frequency, SE is security solution e¤ect and SC is security solution cost. 2. Estimate the static security level using information from the development for part 3 of Common Criteria, the security assurance requirements. 3. Estimate the dynamic security level or the operational security level by computing the risk level, using the prediction model described in Houmb et al. (2005b), based on the parameters M I and M F . 4. Estimate the treatment level, using the prediction model in Houmb et al. (2005b), based on the parameters SE and SC. 5. Estimate the trade-o¤ parameters in the set T , where T = fSAC; P OL; ST A; LR; BG; T T M; BU g and SAC is security acceptance criteria, P OL is policies, ST A is standards, LR is law and regulation, BG is business goal, T T M is time-to-market and BU is budget. 6. Compute RoSI by a) combining the static and dynamic security level, b) evaluating the treatment e¤ect on the combined security level by considering
Appendix B.2: P.26; Houmb et al. (2006) Static Security Level
Dynamic Security Level
269
Level 1
AND
Solution Treatment Level
Security Level
Level 2
AND
Trade-Off Parameters
Treatment Effect and Cost
Level 3
AND
RoSI for Security Solution
Level 4
Fig. .15. Hierarchical overview of the structure of the trade-o¤ analysis
both the security solution e¤ect and the security solution cost and c) Compute RoSI by evaluating the result of a) using the trade-o¤ parameters. 7. Evaluate RoSI for a particular security solution against the rest of the potential security solutions in the security solution set A. Fig. 6 shows the hierarchical structure of the trade-o¤ analysis. The structure consists of four levels and follows the step-wise description from above. The AND gates in the …gure mean that all incoming events linked to the incoming arches are combined. The out-going arches from an AND gate carry the result of the combination to the next level of the analysis. Each of the squares in the …gure represents a set of information, for example the set of information that contributes to the static security level.
270
Appendix B.2: P.26; Houmb et al. (2006)
3.3 BBN Implementation of the Trade-O¤ Analysis The security solution design trade-o¤ analysis is implemented using Bayesian Belief Networks (BBN). BBN handles large scale conditional probabilities and has proven to be a powerful technique for reasoning under uncertainty. BBN is used for various uncertainty problems, such as support of disease determination based on a set of symptoms in the medical domain, and for the help function in Microsoft O¢ ce. It has also been successfully applied when assessing the safety of systems (SERENE Project, 1999). The BBN methodology is based on Bayes rule and was introduced in the 1980s by Pearl (1988). HUGIN (Hugin Expert A/S, 2004) is the leading tool supporting BBN. Bayes rule calculates conditional probabilities. A BBN is a connected and directed graph consisting of a set of nodes or variables and directed arches. Nodes correspond to events or concepts and are represented in a set of states. The potential states of a node are expressed using probability density functions (pdf). Pieces of information or evidence are inserted into the leaf nodes and propagated through the network using the pdfs. A pdf describes one’s con…dence in the various outcomes of the node and depends conditionally on the status of the connected nodes. There are three types of nodes: (1) target nodes, which represent targets of the assessment, (2) intermediate nodes, that are nodes for which one has limited information or beliefs (the intermediate level) and (3) observable nodes, which represent information and evidence that can be directly observed (e.g., the number of people on a particular bus at a particular time) or in other ways obtained. Application of the BBN method consists of three tasks: (1) construction of the BBN topology, (2) elicitation of probabilities to nodes and edges and (3) making computations. Further information on BBN, and in particular on the application of BBN for software safety assessment, can be found in Gran (2002) and the SERENE Project (1999). 3.3.1 The BBN Topology of the Security Solution Design Trade-O¤ Analysis Fig. 8 gives an overview of the BBN topology of the trade-o¤ analysis. The topology consists of four levels (as llustrated in Fig. 6). Here the focus is on the two upper levels of the topology. Evidence and information can be inserted at any level, because the levels are linked together as input and output nodes that carry information between the di¤erent levels. In Fig. 7 the four nodes tradeo¤ parameters, static security level, risk level and security solution treatment level are input nodes (they hide the three other levels), and are indicated by dotted ovals. Each of the input nodes actually consists of additional subnets, but information or evidence can be inserted directly into the input nodes that exist at any particular level.
Appendix B.2: P.26; Houmb et al. (2006)
271
Fig. .16. BBN topology for security solution trade-o¤ analysis
Fig. 8 shows the top-level net in the BBN topology. The network consists of four main parts: (1) trade-o¤ variables, which are combined by the trade-o¤ priorities utility; (2) security level variables, which are combined by the security level utility; (3) security risk acceptance variables, which are combined with the security level variables by the accept risk level utility; and (4) RoSI variables, which are combined with the variables from the other parts, using the RoSI utility. The utility functions (the diamonds in the …gure) de…ne the relationship between the nodes on the incoming edges. They are speci…ed using pdfs and can be simple lookup tables or more sophisticated relational expressions (such as if-then-else expressions). The decision variables (the squares in the …gure) specify the output from the utility functions. In some cases these variables work as helper variables, e.g., the security level decision variable and the trade-o¤ priorities decision variable. The security level utility computes the security level based on the static security level variable, risk level variable, and security solution treatment level variable. Each of these variables is computed from its associated subnet. Since the HUGIN propagation algorithm (Jensen, 1996), which is used for the computations, starts with the leaf nodes and propagates one level at the time, the security level and the trade-o¤ priorities are the …rst to be computed. These two sets of variables are independent and can be computed separately. The next part computed is the acceptable risk level, since it depends on the security level utility, and all other variables depend on this part of the network. Last the RoSI is computed based on the trade-o¤ priorities, acceptable risk level and the variable priorities (PRI). PRI is used as input both when computing the tradeo¤ priorities and when computing RoSI. The reason for this is that the variable are used to determine the outcome of the trade-o¤ priorities utility function, and then used to ensure that those priorities are ful…lled when computing RoSI. PRI represent company or domain-speci…c issues that must be preserved and, therefore, determines how the other trade-o¤ variables are handled.
272
Appendix B.2: P.26; Houmb et al. (2006)
Fig. .17. Top-level net in the BBN topology
The target node RoSI represents the objective of the assessment. The trade-o¤ variables each represent di¤erent issues that in‡uence which security solution is best for the problem under consideration. The node BU denotes the budget available for mitigating security risks and is given as the interval [min, max], where min is the minimum budget available for mitigating security risks (in many cases set to 0) and max is the maximum budget available for mitigating risks. The variable BG speci…es business goals regarding security issues. BG consists of seven states: con…dentiality, integrity, availability, authenticity, accountability, non-repudiation and reliability, according to the security de…nition of the security standard ISO/IEC 13335: Information technology –Guidelines for management of IT security (ISO/IEC 13335, 2001). The variable STA is used to include standards to which the system must adhere. BS covers security issues related to the business strategy. LR covers laws or regulations for security issues that the system must meet. SAC represents security risk acceptance criteria and speci…es acceptable and non-acceptable risks. PRI is used to prioritize the other trade-o¤ variables and makes the BBN topology company, system and domain speci…c. TTM is given as the interval [min_date, max_date], where min_date is the earliest TTM date and max_date is the latest TTM date. Table 2 depicts the nodes/variables and states for the top-level BBN. Fig. 9 shows the static security level subnet, which feeds evidence into the SSLE node in the top-level BBN. This network consists of two parts in three levels: (1) the security assurance requirements of Common Criteria (part 3 of CC) that has three levels and (2) assets and their environment. Part 3 of Common Criteria, the
Appendix B.2: P.26; Houmb et al. (2006)
273
Table 2. Nodes, states and variables of the top-level BBN States Node/variables RoSI
Conf, Integr, Avail, NonR, Accnt, Auth and Relia
PRI
BU, BG, LR, BS and POL
BU
BU_costlimit
TTM
[min_date,max_date]
BG
Conf, Integr, Avail, NonR, Accnt, Auth and Relia
BS, LR, POL and SAC
Conf, Integr, Avail, NonR, Accnt, Auth and Relia
SL, ARL and TOP
Conf, Integr, Avail, NonR, Accnt, Auth and Relia
security assurance requirements, describe di¤erent general and security speci…c aspects of a development process and target the evaluation of system against the seven EAL of Common Criteria. Each EAL determines a set of security assurance requirements that needs to be validated by the evaluator during the certi…cation process. We use these criteria rather than part 2 of Common Criteria, the functional security requirements, since such requirements are domain speci…c and also evolve over time. Certi…cation according to Common Criteria is achieved using the documentation provided during system development and covers the requirement, design and implementation phases. By including the assurance class AMA, maintenance of assurance, the BBN hierarchy also covers the maintenance phase of a system’s life-cycle. The asset and asset environment portion of the BBN is used to specify assets that need to be protected and the related security policies, organisational issues, context in which the assets exist and the stakeholder that either owns or is related to the assets by assigning them a value. A stakeholder is an individual, team, or organisation (or classes thereof) with interest in, or concerns relative to, one or more assets. The context is the strategic or organisational environment in which an asset exists. An organisation is a company, …rm, enterprise or association, or other legal entity that has its own function(s) and administrations. Security policy concerns the rules, directives and practices that govern how assets are managed, protected and distributed within an organisation and its systems. The computation order for this subnet is that the common criteria utility and the asset value utility are computed …rst, since their variables are independent. The static security level is then computed based on the results from the common criteria and asset value utilities. Fig. 10 shows the risk level subnet. This subnet represents the dynamic security level and feeds evidence into the RL node in the top-level BBN. The subnet consists of three parts in two levels. First the operational risk level and the
274
Appendix B.2: P.26; Houmb et al. (2006)
Fig. .18. Static security level subnet
Fig. .19. Risk level subnet
security risk level are computed. The operational risk level is computed based on the variables M T T M and M ET M , while the risk level is computed based on the variables M U SE, M F and M I. Last the risk level is computed using the result of the operation risk level and risk level computations and M C. Fig. 11 shows the security solution treatment level subnet. This subnet feeds input into the SSTL node in the top-level BBN. The treatment level is computed based on the variables SE, SC and SS. SE and SS use the seven security attributes of ISO 13335 as states. The node SC consists of one state, the sc_costlimit, which is given as the interval [min; max], where min is the minimum expected cost for the security solution and max is the maximum expected cost for the security solution.
Appendix B.2: P.26; Houmb et al. (2006)
275
Fig. .20. Security solution treatment level subnet
Each subnet has at least one output node that represents the information being transferred to the level above in the BBN topology. Similarly, input nodes represent information given as input from associated subnets. Input nodes are modelled using grey dashed lines. If there are no observations or information available for some of the observable nodes, they are left empty. An example is when the security solution does not target a misuse. In this case the related variables are left empty and not taken into consideration when computing RoSI. Due to space restrictions, we only discuss the security solution treatment level subnet in the example given in the next section. 3.4 Demonstration of Security Solution Design Trade-O¤ Analysis for TLS Earlier we described the e-Commerce platform ACTIVE, described a misuse scenario and described a potential security solution treating the misuse; a variant of TLS. In this section the SSTL part of the BBN topology is used to demonstrate how to use the security solution trade-o¤ analysis. Recall that the BBN methodology consists of construction of the BBN topology, elicitation of probabilities to nodes and edges and making computations. The previous section described the BBN topology for the security solution design trade-o¤ analysis. This topology is an implementation of the trade-of analysis and is a general topology for computing RoSI for security solution evaluation. The elicitation of probabilities and computations is, however, domain speci…c and needs to be assessed in each case. Before evidence can be entered into the subnet, the utility function for SSTL needs to be de…ned. Tables 3, 4 and 5 show parts 1, 2 and 3 of the SSTL utility function used in this example. The state category_a of the variable SS refers to the
276
Appendix B.2: P.26; Houmb et al. (2006) Table 3: SSTL utility function part 1 State
Variable SSTL
Low
SS
category_a
SC SE Utility
category_b
min
max
min
max
Conf
Integr
Conf
Integr
Conf
Integr
Conf
Integr
0.2
0.2
0.4
0.4
0.5
0.5
0.7
0.7
Table 4: SSTL utility function part 2 State
Variable SSTL
Medium
SS
category_a
SC SE Utility
category_b
min
max
min
max
Conf
Integr
Conf
Integr
Conf
Integr
Conf
Integr
0.7
0.7
1.0
1.0
0.7
0.7
1.0
1.0
Table 5: SSTL utility function part 3 State
Variable SSTL
High
SS
category_a
SC SE Utility
category_b
min
max
min
max
Conf
Integr
Conf
Integr
Conf
Integr
Conf
Integr
0.8
0.8
1.0
1.0
0.9
0.9
1.0
1.0
situation when the TLS variant is separate from the web application and works as an add-in to the web application. This means that TLS is not integrated into the application. This also means that the login information is not encrypted between the add-in and the web application, which makes it possible for an attacker to gain the secret information by using directed software sni¤ers. The state category_b of the variable SS refers to the situation when the TLS variant is integrated into the web application. The di¤erent utilities assigned for min and max for the variable SC, related to each of the states of SS, determines the e¤ect of the cost spent on the solution. For example, when the variable SST L is high, the utility for min is set to 0:9. This value of min re‡ects that not thoroughly checking the implementation (e.g., due to lack of time or money) leads to a small probability that there are mistakes in the implementation, even if the security solution itself is proven to be completely secure and non-modi…able. The reader should treat the utilities given in Tables 3, 4, and 5 as a simple example of how utilities can be used. They do not re‡ect a general and actual e¤ect and relational speci…cation. Fig. 12 shows an example of a computation on the SSTL subnet for the TLS variant when the pdf for SC is set to P (min) = 0:7 and P (max) = 0:3. Fig. 13 shows the e¤ect on the computation when the pdf for SE is set to P (Conf ) = 0:7 and P (Integr) = 0:3. By inserting evidence in the observable nodes the e¤ects can be observed in the network.
Appendix B.2: P.26; Houmb et al. (2006)
277
Fig. .21. Result of computation when pdf for SC is P (min) = 0:7 and P (max) = 0:3
Fig. .22. Result of computation when pdf for SE is P (Conf ) = 0:7 and P (Integr) = 0:3
As shown in the SSTL utility functions and by the two example …gures, elicitation of probabilities and computation requires information regarding the relation between the di¤erent variables as well as values of the variables themselves. The elicitation of probabilities refers to establishing the prior pdf, Pprior (Xi ), for each state for each node/variable in the network. To compute the e¤ect of information or evidence entered into the network likelihood functions need to be de…ned, which is done in the utility functions. The utility functions then de…ne the relationship between all sets of states in the network. This is necessary in order to propagate the evidence through the network. Propagate means computations, which is done using the HUGIN propagation algorithm described earlier. The utility functions, or likelihood functions, are used to update the network. This means that the utility functions are a critical part of the network, but it also means that a BBN topology can be tailored for a particular case by changing the utility functions. As argued by both Gran (2002) and SERENE Project (1999), the construction of the network is critical to the outcome of the propagation. One way to aid the construction of the topology and the speci…cation of the utility functions is by using ontologies. We are currently exploring this subject in order to perform topology veri…cation. The current version of the security solution design trade-o¤ analysis is constructed using domain knowledge and is analysed to …nd the critical parts and the sensitive nodes in the network.
278
Appendix B.2: P.26; Houmb et al. (2006)
Evidence or information to feed into the network can come from various sources. Houmb (2005) discusses types of information sources and techniques that can be used to combine these sources. There are two main information sources available for estimating the variables in the BBN topology: empirical or observable information and subjective information, such as subjective expert judgments. Observable sources are sources that have directly or indirectly observed the phenomena. Such sources have not been biased by human opinions, meaning that the source has gained knowledge or experience only by observing facts. One type of observable information source is real-time information sources, such as Intrusion Detection Systems (IDS), log-…les from Firewalls and honeypots. Other observable information sources are company experience repositories, public experience repositories, domain knowledge, recommendations (best practise) and related standards. Examples of public repositories are the quarterly reports from Senter for Informasjonssikkerhet (SIS) in Norway, CERT.com, reports from the Honeynet-project and other attack trend reports. Subjective information sources can be direct or indirect, meaning that the expert may have direct or indirect knowledge or experience that he or she uses when o¤ering information or evidence. For example, direct knowledge consists of actual events that the expert has observed. Indirect knowledge refers to events observed by another expert or an observable information source. Here the subjective information source interprets the information given by other sources before providing information. Examples of subjective information sources are subjective expert judgment and expert judgment on prior experience from similar systems. When considering experience from similar systems, the experts need to provide a description of their reasoning about the di¤erences between the systems and the e¤ect of those di¤erences on the con…guration being assessed. For more information see Houmb (2005). There might also be situations where there is no information or evidence available. In such situations the symbol is used to indicate lack of information. The variable is still included in the computation, however, to distinguish between no relation, which is denoted P(event)=0, and no information available.
4. Future Trends The techniques described in this chapter compliment the model-driven development (MDD) paradigm. However, for a wide acceptance and application of MDD techniques they must make e¢ cient use of resources and be easy to use across all facets of development. Frameworks that combine MDD techniques and provide
Appendix B.2: P.26; Houmb et al. (2006)
279
tool-support for these techniques must be available to guide the developer in all steps of development of a secure system. An example of such a framework is the Aspect-Oriented Risk-Driven Development (AORDD) framework (Houmb & Georg, 2005a). The security veri…cation and security solution design trade-o¤ analysis techniques described in this chapter are part of the AORDD framework. The framework consists of an iterative risk-driven development process that uses AOM techniques and two repositories with associated rules that support the BBN implementation of the security solution design trade-o¤ analysis. The repositories store experience for reuse, such as security aspects and their related estimation sets. (Recall that estimation sets include estimations of misuse impacts and frequency, as well as security solution e¤ectiveness and cost.) The rule sets guide annotation of design models (currently UML models) and how information is transferred from those models to the BBN topology. Once the system design is completed, MDD techniques that generate code can be used to realise the system (Jürjens & Houmb, 2005). Frameworks such as AORDD will help developers unfamiliar with the security domain successfully develop secure systems using the MDD paradigm.
5. Conclusion The chapter describes an integrated SVDT approach for e¤ective and controlled development of secure systems. SVDT addresses con‡icting issues, such as ful…lling a required security level, making e¤ective use of available resources and meeting end-user expectations. Security veri…cation using UMLsec tool-support and security solution design trade-o¤ analysis are two techniques of SVDT. Security veri…cation is used to verify that security requirements are ful…lled by analysing a security solution design that is modelled as a security aspect using UMLsec. The security solution design trade-o¤ analysis is implemented using BBN. The BBN topology consists of four levels that interact through input and output nodes. The topology covers the static security level, risk level, security solution treatment level and trade-o¤ parameters. The topology is organised using subnets to ease the propagation of evidence. Elicitation of probabilities is achieved using available empirical or observable information sources combined with subjective information sources. Probabilities are obtained from experience and stored in the repositories described in the previous section. Computations are performed using the HUGIN propagation algorithm. The trade-o¤ analysis is demonstrated using an example. The BBN topology used in the security solution design trade-o¤ analysis is a general topology and is not limited to security solution evaluation. However, it is
280
Appendix B.2: P.26; Houmb et al. (2006)
security-speci…c in its current version, since the variables used are security-related variables. Tailoring the topology for other types of decision support is possible if other trade-o¤ variables are added. Modifying or changing the security level and risk level nodes and subnets may also be necessary. The topology can also be tailored to a particular security policy or made company-speci…c by modifying the priorities in the PRI node and by tailoring the TOP, ARL, SL and RoSI utilities in the top-level BBN. It is important to note that even though the BBN topology automates part of the decision process, it is still merely a representation of the combination of domain knowledge and human interpretation of what is important to take into consideration in such decisions. This means that both a di¤erent structure of the BBN topology and di¤erent estimation sets will in‡uence the outcome of the computation.
References ACTIVE (2001). EP-27046-ACTIVE, Final Prototype and User Manual. Version 2.0. Deliverable 4.2.2. AS/NZS 4360 (2004). AS/NZS 4360:2004: Australian/New Zealand Standard for Risk Management. Standards Australia, Strath…eld. Börger, E. & Cavarra, A. & Riccobene, E. (2000). Modeling the dynamics of UML State Machines. In Gurevich, Y. and Kutter, P. and Odersky, M. and Thiele, L., editors, Abstract State Machines: Theory and Applications, vol. 1019 of LNCS, 223-241. Springer. Clarke, S. (2002). Extending standard UML with model composition semantics. In Science of Computer Programming. 44(1). 71-100. Elsevier. Clarke, S. & Banaissad, E. (2005). Aspect-oriented analysis and design. AddisonWesley Professional. CORAS Project (2005). IST-2000-25031 CORAS: A platform for risk analysis of security critical systems. http://coras.sourceforge.net/. Accessed 28 October 2005. CORAS Platform (2005). CORAS risk assessment platform, version 2.0. http://sourceforge.net/project/show…les.php?group_id=88350&package_id= 133388&release_id=276903. Accessed 26 September 2005. Dimitrakos, T. & Ritchie, B. & Raptis, D. & Aagedal, J. O. & den Braber, F. & Stølen, K., & Houmb, S. (2002). Integrating model-based security risk management into Ebusiness systems development: The CORAS approach. In Monteiro, J., Swatman, P., and Tavares, L., editors, Second IFIP Conference on E-
Appendix B.2: P.26; Houmb et al. (2006)
281
Commerce, E-Business, E-Government (I3E 2002), volume 233 of IFIP Conference Proceedings, 159-175. Kluwer. France, R. B. & Kim, D.-K. & Ghosh, S. & Song, E. (2004a). A UML-based pattern speci…cation technique. In IEEE Transactions on Software Engineering. 30(3). 193-206. IEEE Computer Society. France, R. B. & Ray, I. & Georg, G. & Ghosh, S. (2004b). An aspect-oriented approach to design modeling. In IEE Proceedings on Software, Special Issue on Early Aspects: Aspect-Oriented Requirements Engineering and Architecture Design, 151(4), 173-185. IEEE Computer Society. Gran, B.A. (2002). The use of Bayesian Belief Networks for combining disparate sources of information in the safety assessment of software based systems. Doctoral of engineering thesis 2002:35, Department of Mathematical Science, Norwegian University of Science and Technology. Houmb, S.H. (2005). Combining Disparate Information Sources when Quantifying Operational Security. In Callaos, N., Lesso, W., Hansen, E., editors, Proceeding of 9th World Multi-Conference on Systemics, Cybernetics and Informatics (SCI 2005), 1:228-235, Orlando, Florida, USA. Houmb, S. H. & Georg, G. (2005a). The Aspect-Oriented Risk-Driven Development (AORDD) Framework. In Benediktsson, O. et al, editors, Proceedings of the International Conference on Software Development (SWDC/REX), 81-91, Reykjavik, Iceland. Gutenberg. Houmb S.H. & Georg, G & Reddu, R. & France, R. & Bieman, J. (2005b). Predicting availability of systems using BBN in aspect-oriented risk-driven development (AORDD). 2nd Symposium on Risk Management and Cyber-Informatics (RMCI ’05). In Callaos, N., Lesso, W., Hansen, E., editors, Proceeding of 9th World Multi-Conference on Systemics, Cybernetics and Informatics (SCI 2005), Orlando, Florida,USA. Houmb, S.H. & Georg, G. & France, R. & Bieman, J. & Jürjens, J (2005c). CostBene…t Trade-O¤ Analysis Using BBN for Aspect-Oriented Risk-Driven Development, Proceedings of 10th IEEE International Conference on Engineering of Complex Computer Systems (ICECCS 2005), 185-195, Shanghai, China. Hugin Expert A/S (2004). BBN-tool HUGIN ExplorerTM, ver. 6.3. Alborg, Denmark. http://www.hugin.dk. Accessed 24 August 2005. ISO 15408 (1999). ISO 15408 Common Criteria for Information Technology Security Evaluation. http://www.commoncriteria.org/. ISO/IEC 13335 (2001). ISO/IEC 13335: Information technology - Guidelines for management of IT Security.
282
Appendix B.2: P.26; Houmb et al. (2006)
Jacobson, I. (2003a). Case for aspects –Part I. In Software Development Magazine. October. 32-37. Jacobson, I. (2003b). Case for aspects –Part II. In Software Development Magazine. November. 42-48. Jensen, F. (1996). An introduction to Bayesian Network. UCL Press. ISBN: 185728-332-5. Jürjens, J. (2004). Secure Systems Development with UML. Springer-Verlag, Berlin Heidelberg, New York. ISBN: 3-540-00701-6. Jürjens, J. & Houmb, S.H. (2005). Dynamic Secure Aspect Modeling with UML: From Models to Code. In Briand, L. & Williams, C., editors, Proceedings of 8th International Conference on Model Driven Engineering Languages and Systems (MoDELS 2005), 142-155, Montego Bay, Jamaica. Jürjens, J. (2005). UMLsec-Webinterface: tool-support for security veri…cation using UMLsec. http://www4.in.tum.de/~umlsec/csduml/interface/. Accessed 8 November 2005. Kasman, R. & Asundi, J. & Klein, M. (2002). Making Architecture Design Decisions: An Economic Approach. Technical report CMU/SEI-2002-TR-035. http://www.sei.cmu.edu/pub/documents/02.reports/pdf/02tr035.pdf Kazman, R. & Klein M. & Clements, P. (2000). ATAM: Method for Architecture Evaluation. Technical report CMU/SEI-2000-TR-004. http://www.sei.cmu.edu/pub/documents/00.reports/pdf/00tr004.pdf. Kiczales, G. & Hilsdale, E. & Hugunin, J. & Kersten, M. & Palm, J. & Griswold, W. (2001). Getting started with AspectJ. In Communications of the ACM. (44)10. 59-65. ACM. Littlewood, B. & Brocklehurst, S. & Fenton, N. & Mellor, P. & Page, S. & Wright, D. & Dobson, J. & McDermid J. & Gollmann, D. (1993). Towards operational measures of computer security. Journal of Computer Security, 2:211-229. Object Management Group (2003). OMG MDA guide. OMG. Version 1.0.1. http://www.omg.org Pearl, J. (1988). Probabilistic Reasoning in Intelligent Systems: Network for Plausible Inference. Cambridge University Press. ISBN: 0521773628. SERENE Project (1999). SERENE: Safety and Risk Evaluation using Bayesian Nets. ESPIRIT Framework IV no 22187. http://www.hugin.dk/serene/. Accessed 30 October 2005. Stølen, K. & den Braber, F. & Dimitrakos, T. & Fredriksen, R. & Gran, B.A. & Houmb, S.H. & Stamatiou, Y. C. & Aagedal, J. Ø. (2002). Model-based risk assessment in a component-based software engineering process: The CORAS ap-
Appendix B.2: P.26; Houmb et al. (2006)
283
proach to identify security risks. In Barbier, F., editor, Business ComponentBased Software Engineering, 189-207. Kluwer. ISBN: 1-4020-7207-4. Straw, G. & Georg, G. & Song, E. & Ghosh, S. & France, R. & and Bieman, J. (2004). Model composition directives. In Baar, T. & Strohmeier, A. & Moreira, A. & Mellor, S., editors, Proceedings UML 2004, 7th International Conference on UML, volume 3273 of LNCS, 84-97. Springer-Verlag.
Appendix B.3: P.17; Houmb et al. (2005)
Siv Hilde Houmb, Geri Georg, Robert France, Jim Bieman, and Jan Jürjens. CostBene…t Trade-O¤ Analysis Using BBN for Aspect-Oriented Risk-Driven Development. In Proceedings of the Tenth IEEE International Conference on Engineering of Complex Computer Systems (ICECCS2005). Pages 195-204, IEEE Computer Society Press. Shanghai, China, 2005. ISBN 0-7695-2284-X.
286
Appendix B.3: P.17; Houmb et al. (2005)
Cost-Bene…t Trade-O¤ Analysis using BBN for Aspect-Oriented Risk-Driven Development Siv Hilde Houmb Department of Computer Science Norwegian University of Science and Technology Sem Sælands Vei 7-9, NO-7491 Trondheim, Norway
[email protected] Geri Georg, Robert France, and James Bieman Software Assurance Laboratory Department of Computer Science, Colorado State University 601 S. Howes St., Fort Collins, CO 80523-1873 (georg/france/bieman)@CS.colostate.edu Jan Jürjens Systems Engineering, TU Munich Boltzmannstr. 3, 85748 M¨ unchen/Garching, Germany
[email protected]
Abstract Security critical systems must perform at the required security level, make e¤ective use of available resources, and meet end-users expectations. Balancing these needs, and at the same time ful…lling budget and time-to-market constraints, requires developers to design and evaluate alternative security treatment strategies. In this paper, we present a development framework that utilizes Bayesian Belief Networks (BBN) and AspectOriented Modeling (AOM) for a cost-bene…t trade-o¤ analysis of treatment strategies. AOM allows developers to model pervasive security treatments separately from other system functionality. This ease the trade-o¤ by making it possible to swap treatment strategies in and out when computing Return on Security Investments (RoSI). The trade-o¤ analysis is implemented using BBN, and RoSI is computed by estimating a set of variables describing properties of a treatment strategy. RoSI for each treatment strategy is then used as input to choice of design.
Keywords: Trade-o¤ analysis, Bayesian Belief Networks (BBN), Aspect-Oriented Modeling (AOM), and Risk-Driven Development (RDD).
Appendix B.3: P.17; Houmb et al. (2005)
287
1. Introduction In risk-driven development (RDD) security risks are identi…ed, evaluated, and treated as an integrated part of the development. The Aspect-Oriented RiskDriven Development (AORDD) framework addresses the choice of security treatment strategy using a cost-bene…t trade-o¤ analysis. The quality of a treatment strategy is measured in terms of Return on Security Investments (RoSI). RoSI describes the value of loss reduction to money invested on security treatments. The cost-bene…t trade-o¤ analysis is implemented using Bayesian Belief Networks (BBN). BBN use probability theory to manage uncertainty by explicitly representing the conditional dependencies between the di¤erent knowledge components. We do not have su¢ cient amount of experience data available to support choice of treatment strategies, and need to combine disparate information sources and utilize whatever information available. Aspect Oriented Modeling (AOM) separates security treatment strategies from the core functionality. Each treatment strategy is modeled as an aspect model, and then composed with the primary model. This makes it possible to swap treatment strategies in and out during evaluation. Trade-o¤ is done using a set of variables that estimate the properties of each treatment strategy, which are annotated in the composed model. Estimates are then fed into the BBN topology. The trade-o¤ analysis provides decision-support for design choices, and follows a two step procedure; 1) evaluate security risks against the security risk acceptance criteria, and 2) trade-o¤ design alternatives by computing and comparing RoSI of treatment strategies. In the following we give a brief description of the AORDD framework and the BBN methodology. We then present the BBN topology followed by an example to demonstrate its use. The paper is organized as follows. Section 2 describes the AORDD framework, and Section 3 gives a brief introduction to the BBN methodology. In Section 4 we present the BBN topology and discuss how to manage security risks using the AORDD cost-bene…t trade-o¤ analysis. Section 5 gives a small example to demonstrate the approach, while Section 6 addresses unsolved problems as well as discuss further work.
2. The AORDD Framework The AORDD framework combines risk-driven development (RDD) [26] with aspect-oriented modeling (AOM) [7]. The framework consists of the AORDD iterative development process [9], security treatment aspect repositories, estimation repositories, rules for how to annotate UML models with information used
288
Appendix B.3: P.17; Houmb et al. (2005)
for estimation, rules for how to transfer information from the annotated UML models into the BBN topology, and a BBN-based cost-bene…t trade-o¤ analysis. Separation of concerns is important when making design trade-o¤ decisions. We model each security treatment strategy as an aspect, perform security veri…cation [15] of the aspect model, compose the aspect with the primary model, and perform functional veri…cation to ensure that the functionality of the primary model still con…rms to the requirement speci…cation. Security veri…cation is done on the aspect model and analyze the ful…lment of the security requirements, in this case the ability of the security treatment strategy to withstand the identi…ed misuse. An example of security veri…cation is provided in Section 5. This is done for all treatment strategies. We then chose an appropriate estimation set from the estimation repositories. The estimation set depends on the variables used in the trade-o¤ analysis. In the example provided in Section 5, we describe treatment e¤ect using the variables maintenance, cost, and security level. The estimation set is then applied on the composed model and given as input to the BBN topology. 2.1 The AORDD cost-bene…t trade-o¤ analysis The trade-o¤ analysis consists of two phases; 1) evaluate security risks against the security risk acceptance criteria, and 2) trade-o¤ design alternatives by computing and comparing RoSI of treatment strategies. Fig. 1 gives an overview of the inputs and outputs of the two-phase trade-o¤ analysis. The …rst phase takes a set of identi…ed misuses and their associated risk levels as input, and evaluates them against a set of security risk acceptance criteria. Misuses can be intentional system attacks or simple erroneous system usage. The associated risk levels indicate the damage that can occur to the system as a result of the misuse. Risks can vary from a degradation of supplied system services to economic loss due to assets being compromised. Risk levels is determined by combining the impact and frequency of the misuse. Security risk acceptance criteria partition these security risk levels into those risks that must be treated, and those risks that can be discarded from further consideration. The result of the …rst phase of trade-o¤ analysis is a list of misuses in need of treatment. An example of a security risk acceptance criteria used to partition risk levels is that all risks with levels greater than or equal to security risk level “HIGH” must be treated. In this context treated means reducing the risk level to lower than “HIGH”. Such criteria should be provided either by system decisionmakers, the business security policy, or similar information sources. Note that in this example, all security risks lower than “HIGH” are disregarded. Input to the second phase of the trade-o¤ analysis is the list of misuses in need of treatment and their associated alternative security treatment strategies. The
Appendix B.3: P.17; Houmb et al. (2005)
289
Fig. .2. Overview of the two-phase trade-o¤ analysis
evaluation is based on di¤erent sets of priorities, standards, laws and regulations, and in particular business strategies and policies. RoSI for a particular treatment strategy is derived by evaluating the e¤ect and the cost of each treatment strategy against the impact (loss or gain) and frequency of the misuse. The trade-o¤ analysis is implemented using BBN.
3. Bayesian Belief Networks (BBN) BBN have proven to be an powerful technique for reasoning under uncertainty, and have been successfully applied when assessing the safety of systems [3], [4], [5], [24], and [6]. The BBN methodology is based on Bayes rule, and was introduced in the 1980s by Pearl [22] and Lauritzen and Spiegelhalter [17]. HUGIN [11] is the leading tool supporting BBN. Bayes rule calculates conditional probabilities. Given the two variables X and Y, the probability P for the variable X given the variable Y can be calculated from: P(XjY)=P(YjX)*P(X)/P(Y). By allowing Xi to be a complete set of mutually exclusive instances of X, Bayes formula can be extended to calculate the conditional probability of Xi given Y. A BBN is a connected and directed graph consisting of a set of nodes and a set of directed arcs (or links) describing the relations between the nodes. Nodes
290
Appendix B.3: P.17; Houmb et al. (2005)
are de…ned as stochastic or decision variables, and multiple variables may be used to determine the state of a node. Each state of each node is expressed using probability density functions. Probability density expresses our con…dence in the various outcomes of the set of variables connected to a node, and depends conditionally on the status of the parent nodes at the incoming edges. We have three type of nodes; target node(s), intermediate nodes, and observable nodes. Target nodes are nodes about which the objective of the network is to make an assessment. An example of such a node is “RoSI”. Intermediate nodes are nodes for which we have limited information or beliefs. The associated variables are hidden variables. Typically hidden variables represent aspects that increase or decrease the belief in the target node, RoSI, such as “acceptance level” and “security level”. Observable nodes are nodes that can be directly observed or in other ways obtained. Examples of observable nodes for acceptance level are “priorities” and “security acceptance criteria”. Application of the BBN method consist of three tasks: construction of the BBN topology, elicitation of probabilities to nodes and edges, and making computations. For further information on BBN, and in particular the application of BBN for software safety assessment, the reader is referred to Gran [8] and the SERENE project [24].
4. The BBN topology for computing RoSI Fig. 2 depicts the top level BBN for phase 2 of the AORDD trade-o¤ analysis. The node “RoSI” is the target node of the network. The nodes priorities (PRI), budget (BU), business goals (BG), law and regulations (LR), security risk acceptance criteria (SAC), and policies (POL) are observable nodes, nodes that represent information and evidence that can be directly observed or in other ways obtained. The nodes acceptance level (AL) and security level (SL) are intermediate nodes and requires inputs from observable nodes. The node SL receives information and evidence from the three input nodes; static security level (CC EAL), dynamic security level (OS DL), and treatment level (TL). Each of these nodes are decomposed into BBN subnets, and receive information and evidence from their respective subnets. Recall that a target node gives the objective of the assessment, in this case RoSI of a security treatment strategy. In BBN there are two sets of variables; stochastic
Appendix B.3: P.17; Houmb et al. (2005)
291
Fig. .3. Top-level BBN for phase 2 of the AORDD cost-bene…t trade-o¤ analysis
and decision variables [13]. The decision variables represent decisions that need to be made. The stochastic variables represent the set of information on which a decision is based. We use nine stochastic variables to compute RoSI; treatment cost (TC), misuse cost (MC), con…dentiality (Conf), integrity (Integr), availability (Avail), non-repudiation (NonR), accountability (Accnt), authenticity (Auth), and reliability (Relia). Variables can be in a set of states. In the current version of the BBN topology all variables have three associated states; low, medium, and high. Table presents the variables and states of the nodes in the top-level BBN. Note that many of the nodes has overlapping variables. Variables with the same name represent the same type of information in di¤erent context. The node PRI determines the priorities for the trade-o¤ given as an ordered sequence of the variables for BU, BG, LR, SAC, and POL. The strictest sequence of states of the variables costlimit (the strictest of the two variables BU_costlimit and BG_costlimit), Conf, Integr, Avail, NonR, Accnt, Auth, and Relia is then inserted into the intermediate node SL. The state of the variables of the AL node is then evaluated against the states of the variables of the intermediate node security level (SL) as depict in Fig. 2. We use the same set of variables for the intermediate nodes SL and AL as for the target node RoSI. The only di¤erence is the names used for the cost variable, which are di¤erentiated to distinguish types of cost. Furthermore, the intermediate node SL receives information from the three intermediate nodes CC EAL, OS DL, and TL, representing the static security level, dynamic security level, and treatment level. Fig. 3 depict the subnet for the node CC EAL. The subnet re‡ects the structure of part 3, the security as-
292
Appendix B.3: P.17; Houmb et al. (2005)
Table .1. Variables and states of the nodes in the top-level BBN Node
Variables
States
RoSI
TC, MC, Conf, Integr, Avail, NonR, Accnt, Auth, and Relia
low, medium, and high
PRI
BU, BG, LR, SAC, and POL
low, medium, and high
BU
BU_costlimit
low, medium, and high
BG
BG_costlimit, Conf, Integr, Avail, NonR, Accnt, Auth, and Relia
low, medium, and high
LR, SAC, and POL
Conf, Integr, Avail, NonR, Accnt, Auth, and Relia
low, medium, and high
AL
AL_costlimit, Conf, Integr, Avail, NonR, Accnt, Auth, and Relia
low, medium, and high
SL
TC, MC, Conf, Integr, Avail, NonR, Accnt, Auth, and Relia
low, medium, and high
surance requirements, of the security standard ISO 15408: Common Criteria for Information Technology Security Evaluation [12]. These requirements describes di¤erent general and security speci…c properties of a development, and targets the evaluation of a system against seven Evaluation Assurance Levels (EAL). The assurance criteria represent general guidelines for development of security critical systems, and follows the same structure as the safety standard DO-178B: Software Considerations in Airborne Systems and Equipment Certi…cation [23]. The BBN topology for safety assessment of software based systems developed by Gran [8] (see Section 3) is based on DO-178B. Evaluation according to Common Criteria is done using the documentation provided during the development and targets the requirement, design, and implementation phase of the AORDD process [9]. By including the assurance class AMA, maintenance of assurance, the BBN topology does also cover the maintenance phase [9]. Fig. 4 depict the subnet for the node OS DL. The subnet targets the Australian risk management standard AS/NZS 4360:2004 [25], as well as addressing the concept of operational security as described by Littlewood et al. [18], Madan et al. [19], Jonsson and Olovsson [14], Ortalo [21], and Wang et al. [27]. AS/NZS
Appendix B.3: P.17; Houmb et al. (2005)
293
Fig. .4. Subnet for the intermediate node CC EAL
Fig. .5. Subnet for the intermediate node OS DL
4360:2004 consist of …ve sub-processes covering risk assessment and two risk management sub-processes. The cost-bene…t trade-o¤ analysis covers the risk treatment and the management sub-processes. The remaining four sub-processes is addressed by the security risk assessment activity of the AORDD process [9]. The observable nodes mean e¤ort to misuse, METM, and mean time to misuse, MTTM, targets the operational security level. METM and MTTM addresses one particular misuse, which is described by the nodes misuse scenario, MUSE, misuse frequency, MF, misuse impact, MI, and misuse cost, CO. Fig. 5 depict the subnet for the node TL. The subnet targets the treatment level and consists of the observable nodes treatment strategy, TS, e¤ect of treatment strategy, TE, and cost of treatment strategy, TC. The node TS describes a particular treatment strategy. The node TE has a set of associated stochastic variables, while TC describes treatment cost. Due to space restrictions we only look into the treatment level subnet in the example given in the next section.
294
Appendix B.3: P.17; Houmb et al. (2005)
Fig. .6. Subnet for the intermediate node TL
Each subnet has at least one output node, which is marked by a solid grey line, and which represent the information being transferred to the level above in the BBN topology. Similarly, input nodes represent information given as input from subnets. Input nodes are modeled using dashed lines.
5. Using the BBN topology to compute RoSI The e-Commerce platform ACTIVE was developed by the EU EP-27046-ACTIVE project [1]. ACTIVE is a standard e-Commerce system o¤ering a set of services to its end-users. To access any of the services in ACTIVE users must either login as a registered user or a visitor. Logging into the system presents a security risk if the login actions are not properly protected. One potential misuse to login is man-in-the-middle attacks. During this kind of attack, user names and passwords can be intercepted by an attacker, and used later to impersonate a valid user. The security attributes integrity and con…dentiality are both compromised in this type of attack, so mechanisms that address integrity and con…dentiality are potential security risk treatment strategies. We demonstrate the use of two such mechanisms, a variant of transport layer security (TLS) [15], and secure remote password (SRP) [28] to mitigate the misuse. We model these two treatment strategies using aspect models in order to verify their mitigation of the misuse, as well as analyze their e¤ect as input to the cost-bene…t trade-o¤ analysis in AORDD. By using aspect models we can easily swap strategies in and out and feed results into the BBN topology. Each aspect model goes through security veri…cation before being evaluated of the trade-o¤ analysis. In this case each aspect model is used as input to the re…ned treatment level subnet shown in Fig. 5. To measure treatment e¤ect, TE, we use two stochastic variables; treatment maintenance, _M, and treatment security level, _SL. The probability distribution functions for the three security level states; low, medium, and high is determined by veri…cation of the security treatment using an automated theorem prover (see Jürjens [15]). We do not
Appendix B.3: P.17; Houmb et al. (2005)
295
discuss maintenance metrics in this paper, since the main aim is to demonstrate that feeding di¤erence values into the BBN topology gives di¤erent outputs. We can establish that a security protocol such as the TLS variant here in fact satis…es its security requirements by making use of automated tool support which analyzes UML diagrams using automated theorem provers [16]. More speci…cally, we use the automated theorem prover e-SETHEO for verifying security protocols as a “black box”; A TPTP input …le is presented to the theorem prover and an output is observed. No internal properties of or information from e-SETHEO is used. This means that e-SETHEO can be used interchangeably with any other ATP accepting TPTP as an input format (such as SPASS, Vampire and Waldmeister) when it may seem …t. With respect to the security veri…cation, the results of the theorem prover have to be interpreted as follows. If the conjecture stating that an adversary may get to know the secret can be derived from the axioms that formalize the adversary model and the protocol speci…cation, this means that there may be an attack against the protocol. We then use an attack generation machine programmed in Prolog to construct the attack. If the conjecture cannot be derived from the axioms, this constitutes a proof that the protocol is secure with respect to the security requirement formalized as the negation of the conjecture, since the logical derivation is sound and complete with respect to semantic validity for …rst-order logic. Note that since …rst-order logic in general is undecidable, it can happen that the ATP is not able to decide whether a given conjecture can be derived from a given set of axioms. With respect to the TLS variant, e-SETHEO gives back the result that the conjecture knows(secret) cannot be derived from the axioms formalizing the protocol. Note that this result, which was delivered within 5 seconds, means that there actually exists no such derivation, not just that the theorem prover is not able to …nd it. This means in particular that an attacker cannot gain the secret knowledge anymore. If the security veri…cation shows that the aspect model ful…ls the requirements the aspect model is composed with the primary model using composition rules before doing trade-o¤. Fig. 6 depict the composed model of TLS with the ACTIVE login sequence. Login starts with the user’s web browser requesting a login page from the ecommerce web server. The server responds with a login page, an init message is sent, with a nonce (a non-repeating sequence value), the user’s public key, and a self-signed certi…cate containing the user name and user’s public key. The logic for the TLS handshake continues as described by Jürjens [15].
296
Appendix B.3: P.17; Houmb et al. (2005)
Fig. .7. e-Commerce login sequence composed with TLS aspect
5.1 Cost-bene…t trade-o¤ analysis For each treatment strategy we need to estimate treatment e¤ect, TE, and treatment cost, TC. This is done using a selection of estimation sets from the estimation repository in the AORDD framework. The set used depends on the type of system and the development phase. Recall from Section 3 that the BBN methodology consist of construction of the BBN topology, elicitation of probabilities to nodes and edges, and making computations. In Section 4 we described the BBN topology, which is a general topology for computing RoSI for the AORDD cost-bene…t trade-o¤ analysis. The elicitation of probabilities and computations is, however, domain speci…c and needs to be assessed in each case. Probability distribution functions (pdf) may be continuous functions or discrete values. In this example we use discrete values since this makes it conceptually easier for experts to assess, as well as making the computations much simpler.
Appendix B.3: P.17; Houmb et al. (2005)
297
Fig. .8. Variables and states for the specialized TL subnet
5.2 Elicitation of probabilities As an example of elicitation of probabilities we use a specialization of the TL subnet that is directly connected to the target node, RoSI, as depicted in Fig. 7. We use three discrete stochastic variables to describe each treatment strategy; maintenance (_M), security level (_S), and cost (_C). Since we are only evaluating two treatment strategies we include variables for both mechanisms in the same network. In Fig. 7 we have six stochastic variables; SRP_M, SRP_C, and SRP_SL representing maintenance, cost, and security level for SRP and TLS_M, TLS_C, and TLS_SL representing maintenance, cost, and security level for TLS. To perform a trade-o¤ analysis we need decision variables. Fig. 7 includes three decision variables, the ROSI_SRP, ROSI_TLS, and RoSI. The decision variables are shown as rectangles. Their values are calculated using the observed states of the stochastic variables. The stochastic variables are shown as ovals. The diamonds in Fig. 7 are utilities, and describe the interrelationships between the stochastic variables (in the cases of U2 and U3), or the interrelationships between the decision variables (in the case of U1). Utilities describe the resulting value of a decision variable given any combination of state values for the variables connected to it. Thus, the utility U2 speci…es the value of ROSI_SRP, given any combination of states of the variables SRP_M, SRP_C, and SRP_SL. Similarly, the utility U1 speci…es the value of RoSI given any combination of values of the decision variables ROSI_SRP and ROSI_TLS. In our example, the utilities are simple lookup tables, but they can be de…ned using more sophisticated decision logic if desired, e.g. if one variable is to be given more weight than another. Fig. 7 shows each of the stochastic variables, and the preliminary probability distri-
298
Appendix B.3: P.17; Houmb et al. (2005)
Table .2. Dependency matrix on the belief one has in the RoSI level of SRP given the cost of SRP SRP_C/ ROSI_SRP
Low
Medium
High
Low
1.0
0.0
0.0
Medium
0.0
1.0
0.0
High
0.0
0.0
1.0
butions for their associated states. These probability distribution functions are called prior distributions. During elicitation of probabilities we feed the prior distributions into the BBN topology. In our example we assume that expert judgment is collected and aggregated with empirical data prior to elicitation of probabilities. Several authors have discussed both aggregation techniques and expert judgment collection strategies [20], [2], and [10]. For simplicity we set the prior distribution for all observable variables to 0.33, meaning that all states of all variables are assigned the same prior distribution and have the same in‡uence on the outcome. This gives for all variables, P(X=low)=0.33, P(X=medium)=0.33, and P(X=high)=0.33. The function P(XjY) (see Section 3) expresses the belief one has in, for example, the RoSI level of SRP if one knew the cost of SRP, represented by the variable SRP_C. This information is expressed in a dependency matrix as given in Table 2. 5.3 Computation with the BBNs The BBN computation is done by …rst inserting observations in the observable nodes, and then use the rules for probability calculation backward and forward along the edges, from the observable nodes, through the intermediate nodes to the target node. Forward calculation is straight forward, while backward computation is more complicated. Backward calculation is solved using Bayes methodology (see Jensen [13] for details). Manual computation on large BBN topologies is not tractable, so we make use of the BBN tool HUGIN [11]. Note that the amount of information collected before a decision is made depends on the type of decision, the resources available, time frame, and budget, meaning that one should not spend more resources on collecting information than the value of the decision. Fig. 8 shows the result of the computation after observations are given as input to the BBN topology. Actual states of each of the stochastic variables are shown on the left side in the …gure. In this case the SRP_C variable is in the high state, the SRP_M variable is in the medium state, and the SRP_SL variable
Appendix B.3: P.17; Houmb et al. (2005)
299
is in the low state. Utilities U2 and U3 are used to determine the states of the decision variables ROSI_SRP and ROSI_TLS. In this example, the combination of states of the SRP variables means that the ROSI_SRP decision variable is twice as likely to be in the medium state as the high state, and it is one and onehalf times as likely to be in the medium state as the low state. The ROSI_TLS decision variable is twice as likely to be in the high state as the medium state, and one and one-half times as likely to be in the low state as the medium state. Utility U1 takes these distributions and calculates the state of the RoSI decision variable. The result shows that the TLS treatment is one and one-half times more e¤ective than the SRP treatment. Fig. 9 shows how changes in the observations entered propagates and change the result of the BBN computation. As in Fig. 8, the values for the states of each of the stochastic variables are shown on the left side in the …gure. The same utilities are used to calculate the states of the decision variables. In this …gure, the states of SRP_M, SRP_SL, and TLS_SL have been changed from the values given in Fig 8. The result is that the decision variable ROSI_SRP is twice as likely to be in the high state as the medium state, and one and one-half times as likely to be in the low state as the medium state. The ROSI_TLS variable is twice as likely to be in the medium state as the high state, and one and one-half times as likely to be in the medium state as the low state. As for the previous example the U1 utility is used to compute the state of the decision variable RoSI. In this case the result shows that the SRP treatment is one and one-half times more e¤ective than the TLS treatment.
6. Conclusion and further work This paper has brie‡y described the AORDD framework and focused on the costbene…t trade-o¤ analysis of AORDD. The trade-o¤ analysis is implemented using BBN. The BBN topology describes the security level of a system as the combination of its static security level, its dynamic security level, and the treatment level of a speci…c security treatment. The security level is evaluated against an acceptance level comprised of the budget, security acceptance criteria, law and regulations, business goals, and policies. The main goal of the trade-o¤ analysis is to compute RoSI of each treatment strategy, which is used as input to design decisions. The BBN methodology consists of three steps; (1) construction of the BBN topology, (2) elicitation of probabilities to nodes and edges, and (3) making computations. Elicitation of probabilities is done using available empirical or observable
300
Appendix B.3: P.17; Houmb et al. (2005)
Fig. .9. Example of observations in favor of TLS
information sources combined with subjective expert judgment, while computations are done using the algorithm provided by HUGIN. To demonstrate the approach we used two set of …ctive observations to estimate the treatment effect and treatment cost variables of two di¤erent treatment strategies. During development of systems, these values are obtained from experience within the company, general experience factories, in addition to using the stakeholders and participants in the development project as experts. The result of the cost-bene…t trade-o¤ analysis is highly dependent on the observation and evidence entered, as well as the variables used and the relation between them. Please note that even though the BBN topology automate part of the design decisions, it is merely a representation of the combination of domain experience and human interpretation of what is important variables. This means that both di¤erent structure of the BBN topology and di¤erent estimation sets used as input to the topology may give di¤erent results. We have not discussed estimation of variables in this paper, but will address this issue in further work. Estimation sets are domain-, abstraction level-, viewpoint-, and development phase-speci…c.
Appendix B.3: P.17; Houmb et al. (2005)
301
Fig. .10. Example of observations in favor of SRP
References 1. EP-27046-ACTIVE, Final Prototype and User Manual, D4.2.2, Ver. 2.0, 2001-02-22., 2001. 2. R. M. Cooke. Experts in Uncertainty: Opinion and Subjective Probability in Science. Oxford University Press, 1991. 3. P.-J. Courtois, N. E. Fenton, B. Littlewood, M. Neil, L. Strigini, and D. R. Wright. Bayesian belief network model for the safety assessment of nuclear computer-based systems. Second year report part 2, Esprit Long Term Research Project 20072-DeVa, 1998. 4. K. Delic, M. Mazzanti, and L. Stringini. Formilizing engineering judgment on software dependability via belief networks. In DCCA-6, Sixth IFIP International Working Conference on Dependable Computing for Critical Applications, ”Can We Rely on Computers?”, Garmisch-Partenkirchen, Germany, 1997.
302
Appendix B.3: P.17; Houmb et al. (2005)
5. N. Fenton, B. Littlewood, M. Neil, L. Strigini, A. Sutcli¤e, and D. Wright. Assessing dependability of safety critical systems using diverse evidence. IEEE Proceedings Software Engineering, 145(1), 1998. 6. N. Fenton and M. Neil. A critique of software defect prediction models. IEEE Transaction of Software Engineering, 25(5):675–689, 1999. 7. G. Georg, R. France, and I. Ray. An aspect-based approach to modeling security concerns. In Workshop on Critical Systems Development with UML (CSDUML’02). Dresden, Germany, October 2002. 8. B. A. Gran. The use of Bayesian Belief Networks for combining disparate sources of information in the safety assessment of software based systems. Doctoral of engineering thesis 2002:35, Department of Mathematical Science, Norwegian University if Science and Technology, 2002. 2002:35. 9. S. H. Houmb, G. Georg, R. France, and D. Matheson. Using aspects to manage security risks in risk-driven development. In 3rd International Workshop on Critical Systems Development with UML, number TUM-I0415, pages 71– 84. TUM, 2004. 10. S. H. Houmb, O. A. Johnsen, and T. Stålhane. Combining Disparate Information Sources when Quantifying Security Risks. In Proceeding of SCI 2004, RMCI 2004, Orlando, July 2004, 2004. 11. HUGIN. BBN Tool made by Hugin Expert A/S. Alborg, Denmark, 2004. http://www.hugin.dk. 12. ISO 15408:1999. Common Criteria for Information Technology Security Evaluation, Version 2.1, CCIMB–99–031 edition, August 1999. Part 1: Introduction and general model. 13. F. Jensen. An introduction to Bayesian Network. UCL Press, University College London, 1996. 14. E. Jonsson and T. Olovsson. A quantitative model of the security intrusion process based on attacker behavior. IEEE Trans. Software Eng., 4(25):235, April 1997. 15. J. Jürjens. Secure Systems Development with UML. Springer-Verlag, Berlin Heidelberg New York, 2004. 16. J. Jürjens and P. Shabalin. Tools for Critical Systems Development with UML. In N. Jardin Nunes, B. Selic, A. Silva, and A. Toval, editors, UML Modeling Languages and Applications. UML 2004 Satellite Activities, Lisbon, Portugal, October 11–15, 2004, Revised Selected Papers, volume 3297 of LNCS. Springer, 2004.
Appendix B.3: P.17; Houmb et al. (2005)
303
17. S. L. Lauritzen and D. J. Spiegelhalter. Local computations with probabilities on graphical structures and their application to expert systems (with discussion). Journal of the Royal Statistical Society, Series B 50(2):157–224, 1988. 18. B. Littlewood, S. Brocklehurst, N. Fenton, P. Mellor, S. Page, D. Wright, J. Dobson, McDermid J., and D. Gollmann. Towards operational measures of computer security. Journal of Computer Security, 2:211–229, 1993. 19. B. Madan, K. Vaidyanathan, and K. Trivedi. Modeling and quanti…cation of security attributes of software systems. In Proceedings of the International Conference on Dependable Systems and Networks (DSN‘02), 2000. 20. K. Øien and P. R. Hokstad. Handbook for performing expert judgment. Technical report, SINTEF, 1998. 21. R. Ortalo and Y. Deswarte. Experiments with quantitative evaluation tools for monitoring operational security. IEEE Trans. Software Eng., 5(25):633– 650, Sept/Oct 1999. 22. J. Pearl. Probabilistic Reasoning in Intelligent Systems: Network for Plausible Inference. Morgan Kaufmann, 1988. 23. RTCA/DO-178B. Software Considerations in Airborne Systems and Equipment Certi…cation (Guideline). RCTA/DO, 1999. 24. SERENE: Safety and Risk Evaluation using Bayesian Nets. ESPIRIT Framework IV nr. 22187, 1999. http://www.hugin.dk/serene/. 25. Standards Australia, Strath…eld. AS/NZS 4360:2004: Australian/ New Zealand Standard for Risk Management, 2004. 26. K. Stølen, F. den Braber, T. Dimitrakos, R. Fredriksen, B. A. Gran, S. H. Houmb, Y. C. Stamatiou, and J. Ø. Aagedal. Model-based risk assessment in a component-based software engineering process: The CORAS approach to identify security risks. In F. Barbier, editor, Business Component-Based Software Engineering, pages 189–207. Kluwer, 2002. ISBN: 1-4020-7207-4. 27. D. Wang, B. B. Madan, and K. S. Trivedi. Security analysis of sitar intrusion tolerance system. In ACM SSRS’03. ACM Press, 2003. 28. T. Wu. The srp authentication and key exchange system, 2000. RFC 2945, Network Working Group.
Appendix C: Publication List
P.1: Siv Hilde Houmb, Folker den Braber, Mass Soldal Lund and Ketil Stølen. Towards a UML Pro…le for Model-based Risk Assessment. In Proceedings of the First Satellite Workshop on Critical System Development with UML (CSDUML‘02) at the Fifth International Conference on the Uni…ed Modeling Language (UML’2002). Pages 79-92, TU-Munich Technical Report number TUM-I0208. Dresden, Germany, 2002. P.2: Theodosis Dimitrakos, Brian Ritchie, Dimitris Raptis, Jan Øyvind Aagedal, Folker den Braber, Ketil Stølen and Siv Hilde Houmb. Integrating modelbased security risk management into eBusiness systems development - the CORAS Approach. In Proceedings of the IFIP Conference on Towards The Knowledge Society: E-Commerce, E-Business, E-Government. Pages 159175, Vol. 233, Kluwer IFIP Conference Proceedings. Lisbon, Portugal, 2002. ISBN 1-4020-7239-2. P.3: Ketil Stølen, Folker den Braber, Rune Fredriksen, Bjørn Axel Gran, Siv Hilde Houmb, Mass Soldal Lund, Yannis C. Stamatiou and Jan Øyving Aagedal. Model-based risk assessment - the CORAS approach. In Proceedings of Norsk Informatikkonferanse (NIK’2002), Pages 239-249, Tapir, 2002. P.4: Siv Hilde Houmb, Trond Stølen Gustavsen, Ketil Stølen and Bjørn Axel Gran. Model-based Risk Analysis of Security Critical Systems. In FischerHubner and Erland Jonsson (Eds.): Proceedings of the 7th Nordic Workshop on Secure IT Systems. Pages 193-194, Karlstad University Press, Karlstad, Sweden, 2002. P.5: Ketil Stølen, Folker den Braber, Theodosis Dimitrakos, Rune Fredriksen, Bjørn Axel Gran, Siv Hilde Houmb, Yannis C. Stamatiou, and Jan Øyving Aagedal. Model-Based Risk Assessment in a Component-Based Software Engineering Process: The CORAS Approach to Identify Security Risks. In Franck Barbier (Eds.): Business Component-Based Software Engineering. Chapter 10, pages 189-207, Kluwer, ISBN: 1-4020-7207-4, 2002.
306
Appendix C: Publication List
P.6: Siv Hilde Houmb and Kine Kvernstad Hansen. Towards a UML Pro…le for Model-based Risk Assessment of Security Critical Systems. In Proceedings of the Second Satellite Workshop on Critical System Development with UML (CSDUML‘03) at the Sixth International Conference on the Uni…ed Modeling Language (UML’2003). Pages 95-103, TU-Munich Technical Report number TUM-I0323. San Francisco, CA, USA, 2003. P.7: Glenn Munkvoll, Gry Seland, Siv Hilde Houmb and Sven Ziemer. Empirical assessment in converging space of users and professionals. In Proceedings of the 26th Information Systems Research Seminar in Scandinavia (IRIS’26). 14 Pages. Helsinki, Finland, 9-12 August, 2003. P.8: Siv Hilde Houmb and Jan Jürjens. Developing Secure Networked Web-based Systems Using Model-based Risk Assessment and UMLsec. In Proceedings of IEEE/ACM Asia-Paci…c Software Engineering Conference (APSEC2003). Pages 488-498, IEEE Computer Society. Chiang Mai, Thailand, 2003. ISBN 0-7695-2011-1. P.9: Jan Jürjens and Siv Hilde Houmb. Tutorial on Development of SafetyCritical Systems and Model-Based Risk Analysis with UML. In Dependable Computing, First Latin-American Symposium, LADC 2003. Pages 364-365, LNCS 2847, Springer Verlag. Sao Paolo, Brazil, 21-24 October 2003. ISBN 3-540-20224-2. P.10: Siv Hilde Houmb and Ørjan M. Lillevik. Using UML in Risk-Driven Development. In H.R. Arabnia, H. Reza (Eds.): Proceedings of the International Conference on Software Engineering Research and Practice, SERP ’04. Volume 1, Pages 400-406, CSREA Press. Las Vegas, Nevada, USA, 21-24 June 2004. ISBN 1-932415-28-9. P.11: Siv Hilde Houmb, Geri Georg, Robert France, and Dan Matheson. Using aspects to manage security risks in risk-driven development. In Proceedings of the Third International Workshop on Critical Systems Development with UML (CSDUML‘04) at the Seventh International Conference on the Uni…ed Modeling Language (UML’2004). Pages 71-84, TU-Munich Technical Report number TUM-I0415. Lisbon, Portugal, 2004. P.12: Jingyue Li, Siv Hilde Houmb, and Axel Anders Kvale. A Process to Combine AOM and AOP: A Proposal Based on a Case Study. In Proceedings of the 5th Workshop on Aspect-Oriented Modeling (electronic proceeding) at the Seventh International Conference on the Uni…ed Modeling Language (UML’2004). 8 pages, ACM. Lisbon, Portugal, 11 October 2004. P.13: Jan Jürjens and Siv Hilde Houmb. Risk-driven development process for security-critical systems using UMLsec. In Ricardo Reis (Ed.): Information Technology, Selected Tutorials, IFIP 18th World Computer Congress, Tu-
Appendix C: Publication List
307
torials. Pages 21-54, Kluwer. Toulouse, France, 22-27 August 2004. ISBN 1-4020-8158-8. P.14: Mona Elisabeth Østvang and Siv Hilde Houmb. Honeypot Technology in a Business Perspective. In Proceedings of Symposium on Risk-Management and Cyber-Informatics (RMCI’04): the 8th World Multi-Conference on Systemics, Cybernetics and Informatics (SCI 2004). Pages 123-127, International Institute of Informatics and Systemics. Orlando, FL, USA, 2004. P.15: Siv Hilde Houmb, Ole-Arnt Johnsen and Tor Stålhane. Combining Disparate Information Sources when Quantifying Security Risks. In Proceedings of Symposium on Risk-Management and Cyber-Informatics (RMCI’04): the 8th World Multi-Conference on Systemics, Cybernetics and Informatics (SCI 2004). Pages 128-131, International Institute of Informatics and Systemics. Orlando, FL, USA, 2004. P.16: Siv Hilde Houmb and Geri Georg. The Aspect-Oriented Risk-Driven Development (AORDD) Framework. In Proceedings of the International Conference on Software Development (SWDC-REX). Pages 81-91, University of Iceland Press. Reykjavik, Iceland, 2005. ISBN 9979-54-648-4. P.17: Siv Hilde Houmb, Geri Georg, Robert France, Jim Bieman, and Jan Jürjens. Cost-Bene…t Trade-O¤ Analysis Using BBN for Aspect-Oriented RiskDriven Development. In Proceedings of the Tenth IEEE International Conference on Engineering of Complex Computer Systems (ICECCS2005). Pages 195-204, IEEE Computer Society Press. Shanghai, China, 2005. ISBN 0-76952284-X. P.18: Siv Hilde Houmb. Combining Disparate Information Sources When Quantifying Operational Security. In Proceedings of the 9th World Multi-Conference on Systemics, Cybernetics and Informatics, Volume I. Pages 128-131, International Institute of Informatics and Systemics. Orlando, USA, 2005. ISBN 980-6560-53-1. P.19: Siv Hilde Houmb, Geri Georg, Robert France, Raghu Reddy, and Jim Bieman. Predicting Availability of Systems using BBN in Aspect-Oriented Risk-Driven Development (AORDD). In Proceedings of 2nd Symposium on Risk Management and Cyber-Informatics (RMCI’05): the 9th World MultiConference on Systemics, Cybernetics and Informatics, Volume X. Pages 396403, International Institute of Informatics and Systemics. Orlando, USA, 2005. ISBN 980-6560-62-0. P.20: Siv Hilde Houmb and Karin Sallhammar. Modeling System Integrity of a Security Critical System Using Colored Petri Nets. In Proceedings of Safety and Security Engineering (SAFE 2005). Pages 3-12, WIT Press. Rome, Italy, 2005. ISBN 1-84564-019-5.
308
Appendix C: Publication List
P.21: Jan Jürjens and Siv Hilde Houmb. Dynamic Secure Aspect Modeling with UML: From Models to Code. In Model Driven Engineering Languages and Systems: 8th International Conference, MoDELS 2005. Pages 142-155, LNCS 3713, Springer Verlag. Montego Bay, Jamaica, 2-7 October 2005. ISBN 3-54029010-9. P.22: Dan Matheson, Indrakshi Ray, Indrajit Ray and Siv Hilde Houmb. Building Security Requirement Patterns for Increased E¤ectiveness Early in the Development Process. Symposium on Requirements Engineering for Information Security (SREIS). Paris, 29 August, 2005. P.23: Geri Georg, Siv Hilde Houmb and Dan Matheson. Extending Security Requirement Patterns to Support Aspect-Oriented Risk-Driven Development. Workshop on Non-functional Requirement Engineering at the 8th International Conference on Model Driven Engineering Languages and Systems, MoDELS 2005. Montego Bay, Jamaica, October 2-7 2005. P.24: Siv Hilde Houmb, Indrakshi Ray, and Indrajit Ray. Estimating the Relative Trustworthiness of Information Sources in Security Solution Evaluation. In Ketil Stølen, William H. Winsborough, Fabio Martinelli, and Fabio Massacc (Eds.): Proceedings of the 4th International Conference on Trust Management (iTrust 2006). Pages 135-149, LNCS 3986, Springer Verlag, Pisa, Italy, 16-19 May 2006. P.25: Geri Georg, Siv Hilde Houmb, and Indrakshi Ray. Aspect-Oriented Risk Driven Development of Secure Applications. In Damiani Ernesto and Peng Liu (Eds.), Proceedings of the 20th Annual IFIP WG 11.3 Working Conference on Data and Applications Security 2006 (DBSEC 2006). Pages 282-296, LNCS 4127, Springer Verlag, Sophia Antipolis, France, 31 July - 2 August 2006. P.26: Siv Hilde Houmb, Geri Georg, Robert France, and Jan Jürjens. An Integrated Security Veri…cation and Security Solution Design Trade-o¤ Analysis. In Haralambos Mouratidis and Paolo Giorgini (Eds), Integrating Security and Software Engineering: Advances and Future Visions. Chapter 9, Pages 190-219. Idea Group Inc, 2007. ISBN: 1-59904-147-6. 288 pages. P.27: Siv Hilde Houmb, Geri Georg, Robert France, Dorina C. Petriu, and Jan Jürjens (Eds.). In Proceedings of the 5th International Workshop on Critical Systems Development Using Modeling Languages (CSDUML 2006). 87 pages. Research Report Telenor R&I N 20/2006, 2006. P.28: Geri Georg, Siv Hilde Houmb, Robert France, Ste¤en Zschaler, Dorina C. Petriu, and Jan Jürjens. Critical Systems Development Using Modeling Languages – CSDUML 2006 Workshop Report. In Thomas Kühne (Eds.), Models in Software Engineering: Workshops and Symposia at MoDELS 2006,
Appendix C: Publication List
309
Genoa, Italy, October 1-6, 2006, Reports and Revised Selected Papers. Pages 27-31, LNCS 4364, Springer Verlag, 2007. P.29: Dorina C. Petriu, C. Murray Woodside, Dorin Bogdan Petriu, Jing Xu, Toqeer Israr, Geri Georg, Robert B. France, James M. Bieman, Siv Hilde Houmb and Jan Jürjens. Performance analysis of security aspects in UML models. In Proceedings of the 6th International Workshop on Software and Performance, WOSP 2007. Pages 91-102, ACM. Buenes Aires, Argentina, 5-8 February 2007. ISBN 1-59593-297-6.