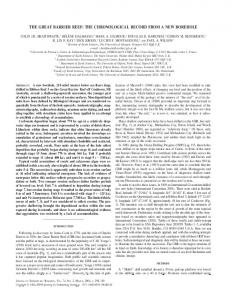
demonstrate such dual-labeled AuNP tube architectures. The image shown in Fig. 4A contains a single spiral of 5-nm AuNPs wrapped around a single spiral of 10-nm AuNPs (an architecture resembling a double helix). The image shown in Fig. 4B contains a double spiral of 5-nm AuNPs wrapped around a double spiral of 10 nm AuNPs (an architecture resembling a quadruplex). From the design, it is expected that the steric repulsion force among the 10-nm particles is greater than that among the 5-nm AuNPs so that the tubes would tend to have the 5-nm AuNPs wrapped inside and the 10-nm AuNPs displayed outside. However, when these tube samples were imaged by cryo-EM (Fig. 4, A and B) in which the native conformations of the tubes were preserved, the two AuNP sizes seemed to stay at about the same layer. It is possible that the 5-nm AuNPs repel one another sufficiently that they are squeezed outward through the gaps between the arms of the two DNA crossovers. These types of AuNP superstructures and 3D complexities reflect the kind of complex architectures that naturally existing systems display (for example, diatoms) but with artificial control of precision at nanometer scales. By further engineering the tile structures, it should be possible to place different sizes or types of nanoparticles in or outside of the tubes. For example, self-assembled nanoinductors could be constructed when magnetic nanoparticles are placed inside of spiral wires made of metallic nanoparticles, which might represent a substantial advancement in small-scale device applications.
References and Notes 1. U. Simon, in Nanoparticles: From Theory to Application, G. Schmid, Ed. (Wiley-VCH, Weinheim, Germany, 2004), pp. 328–362. 2. A. P. Alivisatos et al., Nature 382, 609 (1996). 3. A. Fu et al., J. Am. Chem. Soc. 126, 10832 (2004). 4. Z. Deng, Y. Tian, S.-H. Lee, A. E. Ribbe, C. Mao, Angew. Chem. Int. Ed. 117, 3648 (2005). 5. J. D. Le et al., Nano Lett. 4, 2343 (2004). 6. J. Zhang, Y. Liu, Y. Ke, H. Yan, Nano Lett. 6, 248 (2006). 7. J. Zheng et al., Nano Lett. 6, 1502 (2006). 8. J. Sharma, R. Chhabra, Y. Liu, Y. Ke, H. Yan, Angew. Chem. Int. Ed. 45, 730 (2006). 9. F. Aldaye, H. F. Sleiman, Angew. Chem. Int. Ed. 45, 2204 (2006). 10. F. Aldaye, H. F. Sleiman, J. Am. Chem. Soc. 129, 4130 (2007). 11. J. H. Lee et al., Angew. Chem. Int. Ed. 46, 9006 (2007). 12. X. Xu, N. L. Rosi, Y. Wang, F. Huo, C. A. Mirkin, J. Am. Chem. Soc. 128, 9286 (2006). 13. J. Sharma et al., Angew. Chem. Int. Ed. 47, 5157 (2008). 14. J. Sharma et al., J. Am. Chem. Soc. 130, 7820 (2008). 15. D. Nykypanchuk, M. M. Maye, D. van der Lelie, O. Gang, Nature 451, 549 (2008). 16. S. Park et al., Nature 451, 553 (2008). 17. F. Mathieu et al., Nano Lett. 5, 661 (2005). 18. S. H. Park et al., Nano Lett. 5, 693 (2005). 19. S. M. Douglas, J. J. Chou, W. M. Shih, Proc. Natl. Acad. Sci. U.S.A. 104, 6644 (2007). 20. H. Yan, S. H. Park, G. Finkelstein, J. H. Reif, T. H. LaBean, Science 301, 1882 (2003). 21. P. W. K. Rothemund et al., J. Am. Chem. Soc. 126, 16344 (2004). 22. J. C. Mitchell, J. R. Harris, J. Malo, J. Bath, A. J. Turberfield, J. Am. Chem. Soc. 126, 16342 (2004). 23. D. Liu, S. H. Park, J. H. Reif, T. H. LaBean, Proc. Natl. Acad. Sci. U.S.A. 101, 717 (2004). 24. H. Liu, Y. Chen, Y. He, A. E. Ribbe, C. Mao, Angew. Chem. Int. Ed. 45, 1942 (2006).
Declining Coral Calcification on the Great Barrier Reef Glenn De’ath,* Janice M. Lough, Katharina E. Fabricius Reef-building corals are under increasing physiological stress from a changing climate and ocean absorption of increasing atmospheric carbon dioxide. We investigated 328 colonies of massive Porites corals from 69 reefs of the Great Barrier Reef (GBR) in Australia. Their skeletal records show that throughout the GBR, calcification has declined by 14.2% since 1990, predominantly because extension (linear growth) has declined by 13.3%. The data suggest that such a severe and sudden decline in calcification is unprecedented in at least the past 400 years. Calcification increases linearly with increasing large-scale sea surface temperature but responds nonlinearly to annual temperature anomalies. The causes of the decline remain unknown; however, this study suggests that increasing temperature stress and a declining saturation state of seawater aragonite may be diminishing the ability of GBR corals to deposit calcium carbonate. here is little doubt that coral reefs are under unprecedented pressure worldwide because of climate change, changes in water quality from terrestrial runoff, and overexploitation (1). Recently, declining pH of the
T
Australian Institute of Marine Science, Townsville, Queensland 4810, Australia. *To whom correspondence should be addressed. E-mail:
[email protected]
116
upper seawater layers due to the absorption of increasing atmospheric CO2 [termed ocean acidification (2)] has been added to the list of potential threats to coral reefs, because laboratory studies show that coral calcification decreases with declining pH (3–6). Coral calcification is an important determinant of the health of reef ecosystems, because tens of thousands of species associated with reefs depend on the structural complexity provided by the calcareous coral
2 JANUARY 2009
VOL 323
SCIENCE
25. P. Yin et al., Science 321, 824 (2008). 26. Y. Ke, Y. Liu, J. Zhang, H. Yan, J. Am. Chem. Soc. 128, 4414 (2006). 27. F. Liu, R. Sha, N. C. Seeman, J. Am. Chem. Soc. 121, 917 (1999). 28. Materials and methods are available as supporting material on Science Online. 29. We thank for financial support the National Science Foundation (NSF) and Army Research Office (ARO) (to Y.L.), the Air Force Office of Scientific Research, Office of Naval Research, NSF, Alfred P. Sloan Fellowship, ARO, and NIH (to H.Y.), and Technology and Research Institute Funds funds from Arizona State University (to H.Y. and Y.L.). Some of the work presented here was conducted at the National Resource for Automated Molecular Microscopy, which is supported by NIH though the National Center for Research Resources’ P41 program (RR17573). We thank C. Potter and B. Carragher for helpful discussion and technical advice on the electron tomography work. IMOD software (Boulder Laboratory for 3D Electron Microscopy of Cells, Boulder, CO) used for tomographic reconstruction is supported by NIH grant P41 RR000592. 3D graphic images were produced using the University of California, San Francisco (UCSF) Chimera package from the Resource for Biocomputing, Visualization, and Informatics at UCSF (supported by NIH grant P41 RR-01081). We thank M. Palmer for technical assistance. We acknowledge the use of the EM facility in the School of Life Sciences at Arizona State University. We thank C. Lin for assistance in schematic figure drawings and Y. Ke for assistance in creating movies from the tomography reconstructions. We thank C. Flores for help proofreading the manuscript.
Supporting Online Material www.sciencemag.org/cgi/content/full/323/5910/112/DC1 Material and Methods Fig. S1 to S21 Table S1 Movies S1 to S7 11 September 2008; accepted 19 November 2008 10.1126/science.1165831
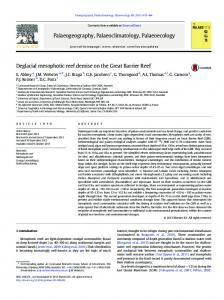
skeletons. Several studies have documented globally declining coral cover (7) and reduced coral diversity (8). However, few field studies have so far investigated long-term changes in the physiology of living corals as indicated by coral calcification. We investigated annual calcification rates derived from samples from 328 colonies of massive Porites corals [from the Coral Core Archive of the Australian Institute of Marine Science (9, 10)] from 69 reefs ranging from coastal to oceanic locations and covering most of the >2000-km length of the Great Barrier Reef (GBR, latitude 11.5° to 23° south; Fig. 1, A and B) in Australia. Like other corals, Porites grow by precipitating aragonite onto an organic matrix within the narrow space between their tissue and the previously deposited skeletal surface. Massive Porites are commonly used for sclerochronological studies because they contain annual density bands (11), are widely distributed, and can grow for several centuries. Numerous studies have established that changes in environmental conditions are recorded in their skeletons (12). Annual data for three growth parameters [skeletal density (grams per cubic centimeter), annual extension (linear growth) rate (centimeters per year), and calcification rate (the
www.sciencemag.org
Downloaded from www.sciencemag.org on January 4, 2009
REPORTS
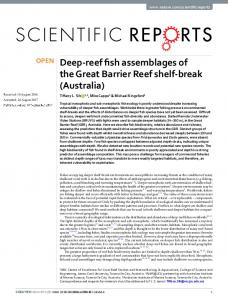
REPORTS termined by cross-validation (17). Results are illustrated through partial-effects plots. Three sets of analyses were conducted; the first and second focused solely on temporal change and used the 1900–2005 and 1572–2001 data sets, whereas the third used only the 1900–2005 data set but also included the three SST components and the relative distance across the shelf and along the GBR. The temporal models of calcification, extension, and density from the 1900–2005 data showed strong patterns of change (Fig. 2, A to C). The rate of calcification increased from ~1.67 g cm−2 year−1 in the period 1900–1930 to a maximum of ~1.76 g cm–2 year–1 in 1970, but since 1990 has declined from 1.76 to 1.51 g cm−2 year−1, an overall decline of 14.2% (SE = 2.3%). The rate of this decline has increased from 0.3% year−1 in 1990 to 1.5% year−1 in 2005. The decline in calcification was largely due to the decline in extension from 1.43 to 1.24 cm year−1 (13.3%, SE = 2.1%). Density varied nonlinearly from 1.24 to 1.22 g cm−3 (1.7%; SE = 1.9%) over the period 1990–2005. The 1572–2001 data showed that calcification increased in the 10 colonies from ~1.62 g cm−2 year−1 before 1700 to ~1.76 g cm–2 year–1 in ~1850, after which it remained relatively constant before a decline from ~1960 (Fig. 2D). However, this finding should be treated with caution because of the small sample size (7 reefs and 10 colonies). Smooth terms in the three SST components and two spatial predictors (across and along the reef) were then added to the temporal models of the 1900–2005 data. SST-TEMP and distance
A
N
B 300
12°S 250
200
Colony
14°S
150
100
16°S
Latitude
50 18°S
0 1900 1920 1940 1960 1980 2000
C Sea surface temperature
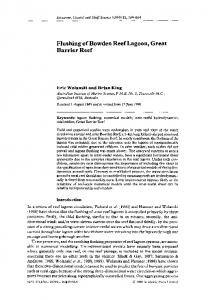
Fig. 1. (A) Map of the GBR, showing locations of the sampled reefs and large-scale spatial patterns in SST averaged over the past 105 years (color ramp, in °C). Blue circles indicate the 13 reefs with Porites cores sampled in 2005, and green circles indicate the 56 reefs sampled before 1993. (B) Distribution of age ranges of the 328 Porites colonies. Truncated records extend back in time as far as 1572. (C) Temporal trends in annual SST for 2° latitudinal bands (labeled with colored numbers, in °S) in the GBR.
139 colonies (48.9%) declining at 0.16% year−1 (SE = 0.21%). This strongly suggests that the 1990–2005 decline in calcification was specific to that period, rather than reflecting ontogenetic properties of the outermost annual growth bands in coral skeletons. Because of the imbalance of sampling intensity over years and the desire to focus on time scales varying from a few years to centuries, the records were broken into two data sets for further analyses. The 1900–2005 data set contained all 328 colonies, whereas the 1572–2001 data set focused only on long-term change and contained 10 long cores from colonies that covered all or most of that period. The dependencies of calcification, extension, and density of annual growth bands on year (the year the band was laid down), location (the relative distance of the reef across the shelf and along the GBR), and SST were assessed with linear mixed-effects models (16) [supporting online material (SOM)]. SST covaries strongly with space and year (Fig. 1, A and C), and to understand the confounding of these effects and to assist in the interpretation of temperature effects, SST was partitioned into three components: the large-scale spatial trend (SST-SPAT; predominantly latitudinal), the long-term temporal trend (SST-TEMP), and the anomalies (SST-ANOM). The latter represent annual deviations from the large-scale and long-term trends in SST. The models included fixed effects in year, SST components, and location, and random effects in reef, colony, and year (SOM). Fixed effects were represented as smooth splines, with the degree of smoothness being de-
Downloaded from www.sciencemag.org on January 4, 2009
product of skeletal density and annual extension; grams per square centimeter per year)] were obtained from each colony with the use of standard x-ray and gamma densitometry techniques (10, 13). Mean annual sea surface temperature (SST) records were obtained from the HadISST1 global SST compilation (1°-square resolution) for the period 1900–2006 (14, 15) (Fig. 1, A and C). The composite data set contains 16,472 annual records, with corals ranging from 10 to 436 years in age, most of which were collected in two periods covering 1983–1992 and 2002–2005 (Fig. 1B). Preliminary exploratory analysis of the data showed strong declines in calcification for the period 1990–2005, based on growth records of 189 colonies from 13 reefs. Despite high variation of calcification between both reefs and colonies, the linear component of the decline was consistent across both reefs and colonies for 1990–2005. Of the 13 reefs, 12 (92.3%) showed negative linear trends in calcification rate, with an average decline of 1.44% year−1 (SE = 0.31%), and of the 189 colonies, 137 (72.5%) showed negative linear trends, with an average decline of 1.70% year−1 (SE = 0.28%). To determine whether this decline was an ontogenetic artifact, we compared these findings with similar analyses of the past 15 years of calcification for each of the remaining 139 colonies sampled before 1990. In this group, linear increases and declines were approximately equal in number, with 29 of the 56 reefs (51.7%) declining at an average rate of 0.11% year−1 (SE = 0.18%), and 68 of the
20°S
22°S 24
24°S
27
200km 144°E
26
11 13 15 17 19
25
21 23
24 146°E
148°E
150°E
152°E
SCIENCE
VOL 323
1900 1920 1940 1960 1980 2000
Year
Longitude
www.sciencemag.org
27
2 JANUARY 2009
117
REPORTS
Density
Extension
2000
Calcification
1980
118
A
1.8
B
1.50
C
1.6
1.30
1.40
Density
1.7
Extension
Calcification
1.45
1.35 1.30
1.25
1.25
1.5
1.20
1.20 1.15
1.4 1900
1920
1940
1960
1980
2000
1900
1920
1940
1960
1980
2000
1900
1920
1940
1960
1980
2000
25.5
26.0
26.5
27.0
Year 2.0 1.9
D
1.5
E
1.35
F
1.8 1.7 1.6 1.5
Density
1.4
Extension
Calcification
1.30
1.3 1.2
1.25 1.20 1.15
1.1
1.4 1.0 25.0
25.5
26.0
26.5
27.0
1.10 25.0
25.5
26.0
26.5
27.0
25.0
SST spatial 1.80
1.50
G
1.28
H
1.45
1.65
1.40
Density
Extension
1.70
1.35
1.55
1.25 −0.5
0.0
0.5
1.0
1.24
1.22
1.30
1.60
I
1.26
1.75
Calcification
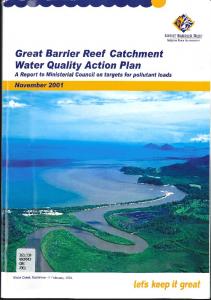
across and along the GBR were nonsignificant and were omitted from all models (SOM); and year, SST-SPAT, and SST-ANOM were retained (Fig. 3). The models showed that calcification varied little between 1900–1990, followed by a decline since 1990 from 1.76 to 1.51 g cm−2 year−1, or 14.2% (SE = 2.3%). As with the purely temporal model, this was largely due to a decline in extension rate from 1.43 to 1.24 cm year−1 (13.3%, SE = 2.1%). The variation in density over this period was indistinguishable from the purely temporal model. Calcification also increased linearly with SST-SPAT at a rate of 0.122 g cm−2 year-1 oC−1 (SE = 0.041), corresponding to an increase of 0.36 g cm−2 year−1 from south to north of the GBR due to the 3°C mean temperature difference. Calcification also decreased with negative SST-ANOM values but was highly variable for positive SST-ANOM. The causes for the GBR-wide decline in coral calcification of massive Porites remain unknown, but this study shows that the causes are probably large-scale in extent and that the observed changes are unprecedented within the past 400 years. Cooper et al. (18) previously demonstrated a 21% decline (1988–2002) in the calcification rate of 38 small Porites colonies; however, the study was limited to two GBR inshore locations; comprised short time series, thereby precluding comparison with earlier periods; and local environmental effects such as coastal influences could not be excluded. Factors known to determine coral growth and calcification include competition for space, water quality, salinity, diseases, irradiance, currents, large-scale and longterm oceanographic oscillations, SST, temperature stress, and carbonate saturation state (6, 10, 19).
2000
1.20 −0.5
0.0
0.5
1.0
−0.5
0.0
0.5
1.0
SST anomaly
Fig. 3. Partial-effects plots showing the variation of calcification (grams per square centimeter per year), linear extension (centimeters per year), and density (grams per cubic centimeter) over time (A to C) and with SST (D to I). The effects of SST are partitioned into large-scale spatial (predominantly latitudinal) patterns in SST and SSTANOM that represent annual deviations from the spatial-temporal trends. The models are based on all 328 Porites colonies from 1900–2005. Light blue bands indicate 95% confidence intervals for comparison between years or SST, and gray bands indicate 95% confidence intervals for the predicted value at a chosen level of the predictor.
2 JANUARY 2009
VOL 323
SCIENCE
www.sciencemag.org
Downloaded from www.sciencemag.org on January 4, 2009
Calcification
1.50 Fig. 2. Partial-effects A B C 1.8 plots showing the varia1.45 1.30 tion of calcification (grams 1.40 per square centimeter per 1.7 year), linear extension (cen1.35 1.25 timeters per year), and 1.6 1.30 density (grams per cubic centimeter) in Porites over 1.25 1.5 time. Plots (A) to (C) are 1.20 1.20 based on 1900–2005 data for all colonies, and 1900 1920 1940 1960 1980 2000 1900 1920 1940 1960 1980 2000 1900 1920 1940 1960 plot (D) on data for the Year 10 long cores. Light blue bands indicate 95% con1.9 D fidence intervals for com1.8 parison between years, and gray bands indicate 1.7 95% confidence intervals for the predicted value 1.6 for any given year. Calcifi1.5 cation declines by 14.2% from 1990–2005 (A), pri1.4 marily due to declining 1.3 extension (B). Density de1600 1700 1800 1900 clines from 1900 onward (C). The 1572–2001 data Year show that calcification increased weakly from ~1.62 before 1700 to ~1.76 in ~1850, after which it remained relatively constant (D) before a weak decline since ~1960.
REPORTS atmospheric CO2 by the oceans’ surface waters (26). Thus, our results may suggest that, after a period of a slight increase in extension and prolonged decline in density, a tipping point was reached in the late 20th century. The nonlinear and delayed responses may reflect synergistic effects of several forms of environmental stress, such as more frequent stress from higher temperatures and declining Warag. Laboratory experiments have provided the first evidence documenting strong synergistic effects on corals (27), but clearly more studies are needed to better understand this key issue. Laboratory experiments and models have predicted negative impacts of rising atmospheric CO2 on the future of calcifying organisms (5, 6). Our data show that growth and calcification of massive Porites in the GBR are already declining and are doing so at a rate unprecedented in coral records reaching back 400 years. If Porites calcification is representative of that in other reef-building corals, then maintenance of the calcium carbonate structure that is the foundation of the GBR will be severely compromised. Verification of the causes of this decline should be made a high priority. Additionally, if temperature and carbonate saturation are responsible for the observed changes, then similar changes are likely to be detected in the growth records from other regions and from other calcifying organisms. These organisms are central to the formation and function of ecosystems and food webs, and precipitous changes in the biodiversity and productivity of the world’s oceans may be imminent (28).
7. J. Bruno, E. Selig, PloS ONE 2, e711 10.1371/journal. pone.0000711 (2007). 8. K. E. Carpenter et al., Science 321, 560 (2008). 9. J. M. Lough, D. Barnes, J. Exp. Mar. Biol. Ecol. 211, 29 (1997). 10. J. M. Lough, D. J. Barnes, J. Exp. Mar. Biol. Ecol. 245, 225 (2000). 11. D. Knutson, R. Buddemeier, S. Smith, Science 177, 270 (1972). 12. M. Gagan et al., Quat. Sci. Rev. 19, 45 (2000). 13. B. E. Chalker, D. J. Barnes, Coral Reefs 9, 11 (1990). 14. R. W. Reynolds, N. A. Rayner, T. M. Smith, D. C. Stokes, W. Wang, J. Clim. 15, 1609 (2002). 15. N. A. Rayner et al., J. Geophys. Res. 108, 10.1029/ 2002JD002670 (2003). 16. N. E. Breslow, D. G. Clayton, J. Am. Stat. Assoc. 88, 9 (1993). 17. G. Wahba, J. R. Statist. Soc. Ser. B. Methodol. 45, 133 (1983). 18. T. Cooper, G. De'ath, K. E. Fabricius, J. M. Lough, Glob. Change Biol. 14, 529 (2008). 19. A. Suzuki et al., Coral Reefs 22, 357 (2003). 20. M. McCulloch et al., Nature 421, 727 (2003). 21. C. Pelejero et al., Science 309, 2204 (2005). 22. F. Bessat, D. Buigues, Palaeogeogr. Palaeoclimatol. Palaeoecol. 175, 381 (2001). 23. A. Marshall, P. Clode, Coral Reefs 23, 218 (2004). 24. C. D. Clausen, A. A. Roth, Mar. Biol. (Berlin) 33, 93 (1975). 25. J. M. Lough, Geophys. Res. Lett. 35, L14708 (2008). 26. J. C. Orr et al., Nature 437, 681 (2005). 27. S. Reynaud et al., Glob. Change Biol. 9, 1660 (2003). 28. J. E. N. Veron, A Reef in Time: The Great Barrier Reef from Beginning to End (Harvard Univ. Press, Cambridge, MA, 2008). 29. We thank M. Devereux, E. Matson, D. Thomson, T. Cooper, and R. Berkelmans for collecting and preparing coral samples. This study was funded by the Australian Institute of Marine Science. The long coral core growth data are lodged with the National Oceanographic and Atmospheric Administration Paleoclimatology Data Center (www.ncdc.noaa.gov/paleo/).
Downloaded from www.sciencemag.org on January 4, 2009
Competition with neighboring corals is unlikely to have intensified during a period when coral cover has either remained similar or declined on most GBR reefs (7). Terrestrial runoff and salinity, although potentially affecting inshore reefs (20), are also unlikely causes because calcification declines at similar rates on offshore reefs away from flood plumes. Diseases can also be excluded because only visibly healthy colonies were sampled. Benthic irradiance depends on turbidity and cloud cover, but there are no data suggesting they have recently changed at GBR-wide scales. The Interdecadal Pacific Oscillation has been associated with changing currents and pH in a lagoon (21); however, these and other large-scale long-term oceanographic oscillations can be excluded because they would have affected Porites calcification not only after 1990 but throughout the observation period. Hence, by excluding these potential alternatives, we suggest that SST and carbonate saturation state are the two most likely factors to have affected Porites calcification at a GBR-wide scale. SST is an important environmental driver of coral growth. Our data confirmed previous studies (10, 22) that coral calcification increases linearly with large-scale mean annual SST. However, studies addressing shorter time periods show declining calcification at both high and low SST (18, 23, 24) and that thermally stressed corals show reduced calcification for up to 2 years (19). In our study, calcification was likewise reduced during coolerthan-average years (negative SST-ANOM). However, during warmer years it was highly variable, suggesting increasing calcification in some warm years but declines in others. This is possibly due to the year-averaged SST-ANOM inconsistently reflecting short hot periods that reduce calcification during warm years. The recent increase in heat stress episodes (25) is likely to have contributed to declining coral calcification in the period 1990–2005. The supersaturation of tropical sea surface waters with the calcium carbonate mineral forms calcite and aragonite is considered a prerequisite for biotic calcification, with saturation state being a function of pH and temperature. Since industrialization, global average atmospheric CO2 has increased by ~36% (from 280 to 387 parts per thousand), the concentration of hydrogen ions in ocean surface waters has increased by ~30% (a 0.1 change in pH), and the aragonite saturation state (Warag) has decreased by ~16% (6, 26). Studies based on meso- or microcosm experiments show that reduced Warag, due to the doubling of CO2 as compared with preindustrial levels, reduces the growth of reef-building corals by 9 to 56% (6), with most of these experiments suggesting a linear relationship between calcification and Warag. Warag data from the GBR or adjacent waters are sparse, but estimates of a global decline in Warag of 16% since the beginning of global industrialization are similar in magnitude to our finding of a 14.2% decline in calcification in massive Porites. However, the decline in calcification observed in this study began later than expected, based on the model of proportional absorption of
References and Notes 1. 2. 3. 4. 5. 6.
J. M. Lough, J. Environ. Monit. 10, 21 (2008). K. Caldeira, M. Wickett, Nature 425, 365 (2003). J. A. Kleypas et al., Science 284, 118 (1999). S. Ohde, M. M. Hossain, Geochem. J. 38, 613 (2004). O. Hoegh-Guldberg et al., Science 318, 1737 (2007). J. M. Guinotte, V. J. Fabry, Ann. N. Y. Acad. Sci. 1134, 320 (2008).
Supporting Online Material www.sciencemag.org/cgi/content/full/323/5910/116/DC1 Materials and Methods References 29 August 2008; accepted 25 November 2008 10.1126/science.1165283
Stretching the Envelope of Past Surface Environments: Neoproterozoic Glacial Lakes from Svalbard Huiming Bao,1* Ian J. Fairchild,2 Peter M. Wynn,3 Christoph Spötl4 The oxygen isotope composition of terrestrial sulfate is affected measurably by many Earth-surface processes. During the Neoproterozoic, severe “snowball” glaciations would have had an extreme impact on the biosphere and the atmosphere. Here, we report that sulfate extracted from carbonate lenses within a Neoproterozoic glacial diamictite suite from Svalbard, with an age of ~635 million years ago, falls well outside the currently known natural range of triple oxygen isotope compositions and indicates that the atmosphere had either an exceptionally high atmospheric carbon dioxide concentration or an utterly unfamiliar oxygen cycle during deposition of the diamictites. errestrial sulfate (SO4−2) has diverse origins and participates in many important physicochemical and biological processes that can be inferred from large ranges
T
www.sciencemag.org
SCIENCE
VOL 323
in stable sulfur and oxygen isotope compositions (1). The d18O (2) of sulfate ranges from ~+8 to ~+27 per mil (‰) [Vienna standard mean ocean water (VSMOW)] (3) for marine sulfate
2 JANUARY 2009
119