ods based on statistical pattern analysis techniques [5, 9] are generally more robust. ... candidate zone is evaluated and assigned a cost according to a learned ...
Decompose Document Image Using Integer Linear Programming Dashan Gao Dept. of Electrical and Computer Engineering University of California, San Diego 9500 Gilman Drive La Jolla, CA 92093-0409 USA Abstract Document decomposition is a basic but crucial step for many document related applications. This paper proposes a novel approach to decompose document images into zones. It first generates overlapping zone hypotheses based on generic visual features. Then, each candidate zone is evaluated quantitatively by a learned generative zone model. We formulate the zone inference problem into a constrained optimization problem, so as to select an optimal set of nonoverlapping zones that cover a given document image. The experimental results demonstrate that the proposed method is very robust to document structure variation and noise.
1 Introduction Document decomposition is a basic but crucial step for many document related tasks, such as document classification, recognition, and retrieval. The goal is to segment document images into zones. Each zone is a perceptually compact and consistent unit (at certain scale), e.g. a paragraph of text, a textural image patch. Methods for document image decomposition can be classified into three categories: bottom-up methods[4, 8, 12], top-down methods[11, 1, 6, 7], and combination of the two[10]. Typical examples of bottom-up methods utilize detected connected components, and progressively aggregate them into higher level structures, e.g. words, text lines, and paragraphs (zones). Conversely, top-down methods decompose larger components into smaller ones. Usually, both types of methods heavily depend on detecting connected components, separating graphics and white space, or certain document generating rules and heuristics. However, both parameters for detecting document components and rules/heuristics used to segment documents are often manually tuned and defined by observing data from a development set. Thus, the adaptability and robustness of these methods are limited. It is hard for them to be generalized
Yizhou Wang, Haitham Hindi, Minh Do Palo Alto Research Center (PARC) 3333 Coyote Hill Rd. Palo Alto, CA 94304-1314 USA
from document to document. When there exist ambiguities (e.g. text in document is noisy or has accidental proximity), neither type of method decomposes pages reliably. Methods based on statistical pattern analysis techniques [5, 9] are generally more robust. However, current reported methods, so far, are still relatively naive. For example, features are ad hoc, and computation engines are greedy. This paper proposes a novel approach to decompose document images using machine learning and pattern recognition techniques. Given a document image, it first proposes over-complete overlapping zone hypotheses in a bottom-up way based on generic visual feature classifiers. Then, each candidate zone is evaluated and assigned a cost according to a learned generative probabilistic zone model. Finally, a zone inference is formulated into a constrained optimization problem, so that the selected optimal set of non-overlapping zones that covers a given document image corresponds to the global optimal page decomposition solution. The most outstanding advantage of this method is that it organically combines a convenient document representation, an elaborated computational data structure, and an efficient inference algorithm together to solve the page decomposition problem. In other words, it seamlessly incorporates data(documents), models(representation) and computing (computational data structure and algorithm) into an integrated framework. Thus, it makes the model effective for data representation and computation; and it also makes the computation efficient due to the convenient model and computational data structure. We first introduce a document image representation in Section 2. We discuss document models and model learning in Section 3. In Section 4, we formulate zone inference into a constrained integer linear optimization problem. Some results are shown in Section 5. Finally, we summarize the proposed method in Section 6.
2 Document Image Representation We represent a document image by a 2-layer model. The first layer is primitive layer. Given a document image I, we apply standard techniques, such as [13], to detect “words” as atomic primitives, and connect these words into a wordgraph, denoted as Gw . Gw =< V, E >,
(1)
where Nz is the number of zones. Each zone is defined as (j)
zj = ({ci
(j)
: i = 1, . . . , ncj }, {vk : k = 1, . . . , nwj }), (2) (j)
which is a polygon representation; ci is a corner of a zone bounding polygon. ncj is the number of vertices/corners of zone-j’s bounding polygon. nwj is the number of “words” comprising zone-j. Most conventional zoning algorithms heavily depend on connected component and white-space analysis, which involve ad hoc parameter tuning and rigid rule based reasoning. Consequently, the adaptability and robustness of the algorithms are limited. However, our zone representation is based on corners, which is a well-known generic low-level robust visual feature, and it is independent of language. As corner detection is invariant to rotation, our method tolerates page skew. (Corners of the textural image bounding polygon is still obtained by connected component analysis.) Note that the zone’s polygon representation is not necessarily a rectangle. Compared with other work, our method is more robust and more generalizable to different document images, where there exist large variations across different document genres(Fig.3). From generative model point of view, we have the following causal dependence Z → Gw . We integrate the two layers into a joint probability of Gw (derived from an input document image I) and the hidden representation Z: p(Gw , Z) = p(Gw |Z)p(Z),
3 Models and Learning We first discuss features and data preparation for models and learning.
3.1
where V = {vi ; i = 1, . . . , Nw }, each “word” is a graph node v. Nw is the number of “words” in a document. The edge set, E = {(e = (i, j), wij ) : vi , vj ∈ V, wij ∈ R}, tells the neighborhood relation of pairs of “words.” Each edge is associated with a weight, wij , representing bounding force between a pair of “words.” Note that these detected “words” need not to be legitimated words, a fraction of word or an image patch is fine. The only purpose of this step is to reduce the image representation from pixels to a compact atomic “word” representation for the sake of computational efficiency. The second layer is layout layer, where the detected “words” are grouped into zones and form a zone-map, denoted as Z. Z = (Nz , {zj : j = 1, . . . , Nz }),
where p(Gw |Z) is a generic zone likelihood model, and p(Z) is a prior model for zone relations.
(3)
Features
Generic visual features In this project, we adopt 21 Harr-like filters to extract features from document images. These 21 filters are derived from 5 prototype Harr-filters (including a horizontal step edge, a vertical step edge, a horizontal bar(ridge), a vertical bar, and a diagonal blocks) by varying their size and scale. These features are generic and important visual features, and the filter responses can be computed in constant time at any scale and location using integral images. “Word” related features “Word” related features are very important and convenient features for document analysis. In this project, we identified six types of generic and low-level such features on word-graph g, denoted as (5) (0) fw (g), · · · , fw (g). For example, there are features measuring compactness of a zone, “word” height consistency in a zone, and average edge-weight cut by zone bounding box borders. Due to space limit, please refer to our technical report at PARC for details.
3.2
Data preparation
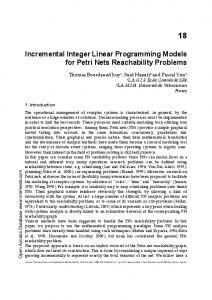
3.2.1 Generating word-graph – the primitive layer Given a document image we first compute a word-graph Gw using a neighbor finding algorithm based on Voronoi tessellation algorithm[8](Fig.1.(a)). Then, we compute edge weights, which tell how likely a pair of connected words belongs to the same zone. The edge weights are posterior probabilities returned by an edge classifier discussed below. Learning word-graph edge classifier We adopt Support Vector Machines (SVM) to learn a binary classifier to assign weights to word-graph edges. Given a number of Voronoi word-graphs derived from training images, we learn the SVM edge classifier as follows: 1. Data Preparation: We manually label zone bounding boxes on the training word-graphs. Positive edge samples are the edges within zone bounding boxes; negative samples are those cut by bounding box borders. 2. Feature Extraction: We extract a 22-dimensional feature vector including a feature accounting height difference of a pair of “words”, and 21 Harr-like filter responses (described above) from an image patch. The image patch is cut from I centering at the mid-point of an edge, and its size is twice large of the union of the two “words” bounding boxes.
(a)
(b) Figure 1. (a) A Voronoi word-graph. (b) The same word-graph after prune edges whose weighs are less than 0.5 assigned by an edge classifier. 3. SVM Training: We train a LibSVM[2] classifier on the extracted feature vectors. Fig.1.(b) shows a word-graph after pruning edges whose weighs are less than 0.5 assigned by the SVM edge classifier. Note that as the connection of a pair of “words” is computed based on generic features, the measure is more robust than pre-defined adhoc heuristic rules.
(a)
(b) Figure 2. (a) Detected corners. (b) Proposed top candidate zones. miss any possible corners. Fig.2.(a) shows detected zone corners. We propose all possible candidate zones by pairing all the detected upper-left with all lower-right corners. Fig.2.(b) shows top 51 candidate zones with least costs proposed by this method. For the sake of computation efficiency, the rest of zones with higher costs are discarded. The zone costs are assigned by a learned generative zone model introduced below.
3.3 3.2.2 Generating zone hypotheses In Eqn.2, the zone representation is a generic polygon. In this paper, we demonstrate the power of the representation by simply using rectangles for zones without losing much generality due to the data set. Thus, Eqn.2 is reduced to (j) zj = (cul , clr , {vk : k = 1, . . . , nwj }), where cul and clr are upper-left and lower-right corners of a zone bounding box. In order to propose candidate zones efficiently, we train two classifiers, which detect upper-left and lower-right corners in document images, as follows: 1. Data Preparation: We obtain positive samples of zones’ upper-left and lower-right corners using the labeled zones’ corners in training word-graphs; Negative samples are collected by randomly selecting “word” bounding boxes’ corners, which are not the corners of labeled zones. 2. Feature Extraction: We extract a 21-dimension generic visual feature vector (described above) from an image patch, which is cut from I centering at an upper-left or lower-right corner, and its size is 400 × 400 pixels. 3. SVM Training: We train LibSVM corner classifiers on the extracted feature vectors. We augment the corner set by including bounding box corners of word-graph connected components in order not to
A likelihood model for zones
This section discusses a generic zone model, which is used to assign costs to candidate zones. In Eqn.3, p(Gw |Z) can be factorized into p(Gw |Z) = p(gw¯ )
Nz Y
p(gi |zi ),
i=1
where gw¯ is sub-graphs of “words” not covered by any zone. p(gw¯ ) = exp(−|gw¯ |), and | · | denotes the cardinality function. gi is sub-word-graph(s) subsumed in zone-i, and p(gi |zi ) is a generative model for zones. Intuitively, p(g|z) governs how “words” are organized (j) in zones in term of the features fw (·) described in Section.3.1. We want to construct a probabilistic model p on word-sub-graphs, such that the expected value of each feature is the same as its average on the observed feature extracted from training data. That is, given n labeled zones, Ej [fw(j) (g|z)] =
n X
p(gi |zi )fw(j) (gi |zi )
i=1 n 1 X (j) = f (gi |zi ) = µj , n i=1 w
j = 0, . . . , 5.
The observed feature statistics serve as constraints. Thus, based on maximum entropy principle, the likelihood model
for zones is derived as p(g|z) = c exp{−
5 X
λj fw(j) (g|z)},
(4)
j=0
where λ’s are Lagrange multipliers or, in this case, feature weights to be estimated. c is the normalizing constant. Note (2) (3) (4) that as the features fw , fw , fw are “context sensitive,” the zone model encode certain amount of context information. In Eqn.4, generally, there is no closed form Maximum Likelihood Estimation (MLE) solution for (λ0 , . . . , λ5 ). We adopt a numerical method called Generalized Iterative Scaling (GIS) proposed by [3] to solve them iteratively.
3.4
A prior model for zone-map
The prior model of zone-maps governs not only each zone’s shape, but also spatial distribution of zones in a page, e.g. similarity, proximity, symmetry. It is characterized by a statistical ensemble called Gestalt ensemble for various Gestalt patterns[14]. The model makes zone evaluation context sensitive. However, learning such a prior model is very expensive. In this project, we take advantage of the specificity of the document set by simply enforcing that each zone is a rectangle and there is no overlap Q between any two zones, such that p({z1 , . . . , zNz }) = i6=j δ(zi ∩ zj ), where δ(·) is the Dirac delta function. Thus, p(Z) = p(Nz )Πi6=j δ(zi ∩ zj ),
(5)
where p(Nz ) is a prior knowledge on zone cardinality, which we assume a uniform distribution. In summary, the joint probability of a word-graph Gw and zone partition Z is
=
p(Gw , Z) = p(Gw |Z)p(Z) z p(gw¯ ){ΠN i=1 p(gi |zi )}p(Nz )Πi6=j δ(zi ∩ zj ) (6)
4 Zone Inference Document image decomposition can be formulated into a Maximum A Posteriori (MAP) zone inference problem (p(Z|Gw )). However, to find the global optimal solution in this high dimensional space can be very expensive. In this paper, we propose a novel approach, which converts this challenging statistical inference problem into an optimal set selection problem by turning learned data statistics into costs and constraints. By solving it, we find the global optimal page decomposition solution.
4.1
Generating costs and constraints from learned statistics
Instead of assigning costs and defining constraints in an ad hoc way, we derive them based on learned probabilistic
models as follows: 1) We convert a probability 0 < P (·) < 1 to a cost as c(·) = ρ(− log P (·)), (7) where ρ(x) is a robust function. 2) When P (·) = 0 or P (·) = 1, there generates a binary constraint for that event. As the result, in this project, we have the following costs and constraints generated from the learned models: 1) individual cost for each zone, 2) a binary constraint that selected zones cover all “words” in a page, and 3) a binary constraint of no overlap between any pair of zones.
4.2
Integer linear programming
After candidate zones are proposed, page decomposition becomes an optimal set selection problem, which can be formulated as binary integer programming(ILP) problem. Suppose that there are n candidate zones, we introduce a binary variable vector x = (x1 , . . . , xn ), where xi = 1 means zone-i is selected; 0, otherwise. Any specific choice of 0’s or 1’s for the components of x corresponds to selecting a particular subset of the candidate zones. Then, we define our cost functions and constraints as: • total zone cost: Cz (x) = cTz x,
(8)
where cz = (cz1 , . . . , czn )T is the vector of individual zone costs, which is computed only once by Eqn.4 & Eqn.7 immediately after candidate zones are proposed. • word covering constraint: Given a Nw -word page, nTwz x = Nw , nwz = (nw1 , . . . , nwn )T ,
(9)
where nwi is the number of words subsumed in candidate zone-i. • non-overlap constraint: To encode zones’ nonoverlapping constraint, we create a convenient data structure, a matrix Ao , which is easily generated as follows: for each pair of overlapping zones, say zonei and zone-j, we enforce a constraint: xi + xj ≤ 1, which means there at most one of them can be chosen. We add a 1×n row vector to Ao , each entry of which is 0, except for 1’s at the ith and jth locations. With this data structure, the constraints are written compactly as Ao x ≤ 1.
(10)
where 1 is a vector of all 1’s of appropriate size. Now our goal of page decomposition can be written as minimize such that
cTz x Ao x ≤ 1 nTwz x = Nw xi ∈ {0, 1}
(11)
This is an integer linear programming formulation can be passed to any standard ILP solver, such as CPLEX.
on generic features. The inference module casts an expensive statistical inference to an ILP optimization problem, which is efficiently solved. The joint statistics of data is converted to constraints in the ILP formulation, which makes the inference context sensitive. The proposed computational data structure is convenient to represent data and constraints, thus makes the computation very efficient. As a result, the proposed framework is very general, and it can be extended to a lot of machine learning applications.
Acknowledgements We’d like to thank Dr. Eric Saund for his numerous discussions and insightful suggestions to this project.
References [1] H.S. Baird, Background Structure In Document Images, Document Image Analysis, World Scientific, 1994. [2] C-C Chang and C-J Lin, LIBSVM: a library for support vector machines, 2001. Software available at http://www.csie.ntu.edu.tw/vcjlin/libsvm [3] J. N. Darroch and D. Ratcli, Generalized Iterative Scaling for Log-Linear Models, The Annals of Mathematical Statistics, Vol.43, 1972.
Figure 3. Page decomposition results. The result of 2nd document at top row shows that the method is robust to noise.
5 Data Set and Experimental Results We train and test our model on the first page of articles from NLM’s MEDLINE database. We randomly select a set of first pages for training and a different set of first pages for testing. Some inference results are shown in Fig.3. We can see that our results are very accurate and robust to document layout variations and noise. Moreover, we claim that the proposed method is capable to efficiently handle problems with about 200 binary variables. The solution space has potentially 2200 possibilities, so could potentially take a prohibitively long time to solve. However, with our method, we have found most of page decomposition speeds are within a second. This suggests that there is some hidden structure to this problem, that is enabling the efficient solution of potentially combinatorially complex problems. This is a future research topic.
6 Conclusions We have proposed a novel, generic and efficient learning and inference framework to solve a fundamental challenging problem of document analysis. It organically integrates generative probabilistic models and integer linear programming (ILP) to search for global optimal solutions. The learning part learns robust probabilistic models based
[4] D. Drivas and A. Amin, Page Segmentation and Classification Utilizing Bottom-Up Approach, ICDAR, 1995. [5] F. Esposito, D. Malerba, and F.A. Lisi, Machine Learning for Intelligent Processing of Printed Documents. J. Intell. Inf. Syst. 14(2-3): 175-198, 2000. [6] H. Fujisawa and Y. Nakano, A Top-Down Approach for the Analysis of Documents, ICPR, 1990. [7] R. Ingold and D. Armangil, A Top-Down Document Analysis Method for Logical Structure Recognition, ICDAR, 1991. [8] K. Kise, A. Sato, and M. Iwata, Segmentation of page images using the area Voronoi diagram, CVIU, 1998. [9] K. Laven, S. Leishman and S. Roweis, A Statistical Learning Approach to Document Image Analysis, ICDAR, 2005 [10] J. Liu, Y. Tang, Q. He, and C. Suen, Adaptive Document Segmentation and Geometric Relation Labeling: Algorithms and Experimental Results, ICPR, 1996. [11] G. Nagy, S. Seth, and M. Viswanathan, A Prototype Document Image Analysis System for Technical Journals, Computer, 25(7), 1992. [12] L. O’Gorman, The Document Spectrum for Page Layout Analysis, PAMI, 15, 1993. [13] Y. Wang, I.T. Phillips, and R. Haralick, Statistical-based Approach to Word Segmentation, ICIP, 2000. [14] C. Guo, S.C. Zhu and Y. Wu, Modeling Visual Patterns by Integrating Descriptive and Generative Methods, IJCV, 2003.