Deconstructing Disengagement: Analyzing Learner Subpopulations in Massive Open Online Courses René F. Kizilcec∗
Chris Piech∗
Emily Schneider∗
Dept. of Communication Stanford University Stanford, CA-94305
Dept. of Computer Science Stanford University Stanford, CA-94305
School of Education Stanford University Stanford, CA-94305
[email protected]
[email protected]
[email protected]
ABSTRACT
General Terms
As MOOCs grow in popularity, the relatively low completion rates of learners has been a central criticism. This focus on completion rates, however, reflects a monolithic view of disengagement that does not allow MOOC designers to target interventions or develop adaptive course features for particular subpopulations of learners. To address this, we present a simple, scalable, and informative classification method that identifies a small number of longitudinal engagement trajectories in MOOCs. Learners are classified based on their patterns of interaction with video lectures and assessments, the primary features of most MOOCs to date. In an analysis of three computer science MOOCs, the classifier consistently identifies four prototypical trajectories of engagement. The most notable of these is the learners who stay engaged through the course without taking assessments. These trajectories are also a useful framework for the comparison of learner engagement between different course structures or instructional approaches. We compare learners in each trajectory and course across demographics, forum participation, video access, and reports of overall experience. These results inform a discussion of future interventions, research, and design directions for MOOCs. Potential improvements to the classification mechanism are also discussed, including the introduction of more fine-grained analytics.
Algorithms, Measurement
Categories and Subject Descriptors K.3.1 [Computers and Education]: Computer Uses in Education; K.3.1 [Computers and Education]: Distance learning—Massive Open Online Course, Learner Engagement Pattern ∗
equal contribution
Permission to make digital or hard copies of all or part of this work for personal or classroom use is granted without fee provided that copies are not made or distributed for profit or commercial advantage and that copies bear this notice and the full citation on the first page. To copy otherwise, to republish, to post on servers or to redistribute to lists, requires prior specific permission and/or a fee. LAK ’13 Leuven, Belgium Copyright 2013 ACM 978-1-4503-1785-6/13/04 ...$15.00.
Keywords Learning Analytics, Learner Engagement Patterns, MOOCs
1.
INTRODUCTION
Massive open online courses (MOOCs) are the most recent and highly publicized entrant to a rapidly expanding universe of open educational resources. As of late 2012, the majority of MOOCs are virtual, distributed classrooms that exist for six to ten weeks at a time. These MOOCs are structured learning environments that emphasize instructional videos and regular assessments, centralizing activities on a single platform. This is a distinct model from the set of learner-directed, open-ended courses that are now known as “cMOOCs” because of their grounding in connectivist theories of learning [25, 20, 8]. The relatively low completion rates of MOOC participants has been a central criticism in the popular discourse. This narrative implies a binary categorization of learners: those who pass the class by adhering to the instructor’s expectations throughout the course–and everyone else. This monolithic view of so-called “noncompleters” obscures the many reasons that a learner might disengage from a MOOC. It also makes no allowances for learners who choose to participate in some aspects of the MOOC but not others, staying engaged with the course but not earning a statement of accomplishment. In contrast, one could emphasize the importance of individual differences and consider all learners to be unique in their interactions with the platform. But whereas the monolithic view overgeneralizes, this individualist perspective overcomplicates. In this paper, we seek to strike a balance by identifying a small yet meaningful set of patterns of engagement and disengagement. MOOC designers can apply this simple and scalable categorization to target interventions and develop adaptive course features [5]. With no cost to entry or exit, MOOCs attract learners with a wide range of backgrounds and intentions, as well as personal or technical constraints to participation. Given the heterogeneity of the population, we would be remiss to make a priori assumptions about the appropriate characteristics or behaviors around which to categorize learners, or which pathways and outcomes are more or less valuable for their learning. Analogous challenges can be found in research on
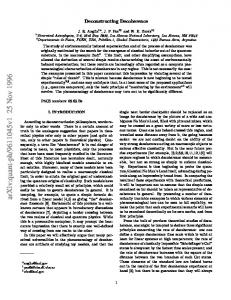
Figure 1: Labels for learners (GS-level)–arcs show movement of students from one assignment period to next. community colleges–the closest brick-and-mortar analogue to MOOCs in terms of the diversity of educational objectives among their students [14]–and on unstructured virtual inquiry environments, where there is not a clear notion of “correct” pathways through the available resources. Using unsupervised clustering techniques, community college researchers have developed meaningful typologies of students based on longitudinal enrollment patterns [2] and survey measures of engagement [23]. Likewise, cluster-based analyses for inquiry environments have distinguished meaningful patterns in learner engagement with content [1]. In this paper we employ a methodology for characterizing learner engagement with MOOCs that builds on methods used in this previous literature. We define learner trajectories as longitudinal patterns of engagement with the two primary features of the course–video lectures and assessments. We uncover four prototypical categories of engagement consistently across three MOOCs by clustering on engagement patterns. We focus on interactions with course content, because learning is a process of individual knowledge construction that emerges in a dynamic process of interactions among learners, resources, and instructors [4, 25]. In MOOCs, these interactions are shaped by the design of instruction, content, assessment, and platform features. To inform effective design changes and interventions along these dimensions that would target the needs of learners on a particular trajectory, we compare clusters based on learner characteristics and behaviors.
2.
COURSE DEMOGRAPHICS
Our analysis of learner trajectories is based on three computer science courses that vary in their level of sophistication: “Computer Science 101” covers high school level content (HS-level), “Algorithms: Design and Analysis” covers undergraduate level content (UG-level), and “Probabilistic Graphical Models” is a graduate level course (GS-level). Table 1 provides basic demographic information and summarizes how many learners were active on the course website at any point in time (as opposed to simply enrolling and never participating). In all three courses, the vast majority of active learners are employed full-time, followed by graduate and undergraduate students. Moreover, most learners in the UG-level and GS-level courses come from technologyrelated industries. The majority of learners in the UG-level course report to hold a Master’s or a Bachelor’s degree. Ge-
ographically, most learners are located in the United States, followed by India and Russia. Table 1 also reports the distribution of active learners over the quantiles of the 2011 Human Development Index (HDI)– a composite measure of life expectancy, education, and income indices [29]. The distribution in the GS- and HS-level courses is very similar, with over two-thirds of active learners from very high-HDI countries. The distribution in the UG-level course is less skewed between very high-, high-, and medium-HDI countries, though low-HDI countries account for a similarly low 3% of learners. Table 1: Course Demographics HS Active Learners 46096 Gender (M/F) 64%/36% Age 33 (14)‡ HDI Very High 69% High 13% Medium 15% Low 3% ‡ Mean (Std. Dev.)
3.
UG
GS
26887 88%/12% 31 (11)‡
21108 88%/12% 36 (12)‡
54% 17% 26% 3%
70% 14% 15% 1%
CLUSTERING
Our learning analytics methodology is designed to identify a small number of canonical ways in which students interact with MOOCs. In our analysis we first compute a description for each student of the way in which the student was “engaged” throughout the duration of a course and then apply clustering techniques to find subpopulations in these engagement descriptions. Running this methodology over the courses in our study uncovers four prototypical engagement patterns for learners’ interactions with the contemporary instantiation of MOOCs. The first step in our methodology is to generate a rough description of each student’s individual engagement in a course. For each assessment period, all participants are labeled either “on track” (did the assessment on time), “behind” (turned in the assessment late), “auditing” (didn’t do the assessment but engaged by watching a video or doing a quiz), or “out” (didn’t participate in the course at all). These labels were chosen because they could be easily col-
lected, and would make sense in any MOOC that is based on videos and assessments, regardless of content area or the pedagogical strategies of the course. Figure 1 visualizes the longitudinal distribution of learners assigned to each label for the GS-level course. For each assessment period, nodes represent the number of learners in each category; between assessment periods, an arc represents the number of learners who retain the same label or move between labels. Due to space constraints the “Out” nodes are not to scale. The complete list of labels that a participant is assigned for each assessment periods is called her “engagement description” As a concrete example of an engagement description: imagine a learner in the GS-level course had completed the first five assignments on time, finished the sixth assignment late and then continued to watch videos without bothering with the last three assignments. Using the notation in Figure 1, that particular student’s engagement description would have been, [T, T, T, T, T, B, A, A, A]. Once we had engagement descriptions for each learner in a course, we applied the k-means clustering algorithm– the standard centroid-based clustering algorithm–to identify prototypical engagement patterns. To calculate the similarity between engagement descriptions for two students, a computation which is needed for clustering, we assigned a numerical value to each label (on track = 3, behind = 2, auditing = 1, out = 0) and computed the L1 norm of the list of numbers. Since we wanted to account for the random properties of k-means we repeated our clustering one hundred times and selected the solution with the highest likelihood. Though clustering was performed separately on all three courses, the process extracted the same four highlevel, prototypical engagement trajectories (Table 2 shows their distribution in the three classes): 1. ‘Completing’: learners who completed the majority of the assessments offered in the class. Though these participants varied in how well they performed on the assessment, they all at least attempted the assignments. This engagement pattern is most similar to a student in a traditional class. 2. ‘Auditing’: learners who did assessments infrequently if at all and engaged instead by watching video lectures. Students in this cluster followed the course for the majority of its duration. No students in this cluster obtained course credit. 3. ‘Disengaging’: learners who did assessments at the beginning of the course but then have a marked decrease in engagement (their engagement patterns look like Completing at the beginning of the course but then the student either disappears from the course entirely or sparsely watches video lectures). The moments at which the learners disengage differ, but it is generally in the first third of the class. 4. ‘Sampling’: learners who watched video lectures for only one or two assessment periods (generally learners in this category watch just a single video). Though many learners “sample” at the beginning of the course, there are many others that briefly explore the material when the class is already fully under way. To evaluate the clusters produced by this methodology we tested that (1) the trends derived were robust to perturbations in the methodology, (2) the clusters that we arrived at had a healthy “goodness of fit” for the data, and (3) that the trends made sense from an educational perspective. The
Table 2: Cluster Breakdown Course HS UG GS
Auditing
Completing
Disengaging
Sampling
6% 6% 9%
27% 8% 5%
28% 12% 6%
39% 74% 80%
results below lend support that the clusters extracted are meaningful and useful. (1) Though we had extracted trends, it was necessary to test whether they reflected meaningful patterns in learning, or if they were a manifestation of the parameters that we used to explore engagement. We hoped to show that the patterns we identified were so strong that even if we had made a few minor changes in our methodology, the same trends of engagement would hold. First we tested whether the patterns in the class were robust enough that the clusters did not change substantially when we experimented with different feature sets. Including “assignment pass” and removing “behind” from the set of labels we assigned to learners in the Algorithms course produced highly analogous centroids and similar labeling, 95% overlap in cluster labels and 94% overlap respectively. In addition, we tried running our clustering with a different choice for k (number of clusters) and found that increasing k divided the four high level patterns into sub-clusters. For example using k = 5 and clustering on the UG level course split the Sampling cluster into learners who sampled a video at the beginning of the course and learners who sampled a video in one of the later assessment periods. (2) It was also necessary to show that the four high-level clusters of students provided an accurate generalization of the data. To verify the “goodness of fit” of our clustering we ran the Silhouette cluster validation test [22]. A positive silhouette score reflects that, on average, a given engagement description is more similar to other descriptions in its cluster than to descriptions in the other clusters (which in turn suggests that the clusters reflect true subgroups of the original population). The maximum silhouette score of 1.0 means that all learners in a cluster are exactly the same. Though our clustering classified some students that were halfway between two of the categories, the overwhelming majority of learners fit cleanly into one of the trajectories (98% positive silhouette, average silhouette score = 0.8). (3) The final evaluation of our clustering methodology was that the algorithm returned trends that make sense from an educational point of view. The trends of engagement pass a common sense test: it is plausible to imagine a posteriori that students would interact in an educational platform in these high level ways. This is important because it provides a framework which enables research that can hypothesize other properties of students in these clusters. Since our labels were drawn from a small discrete set of engagement labels, we extracted meaningful patterns of engagement (Completing, Auditing, etc). In contrast, using assignment grades or lecture counts as features produced clusters that were mostly defined by student scores in the first week (e.g. ‘learners who got a high grade in assignment one and then dropped out’, ‘learners who received a medium grade in assignment one and then dropped out’, etc.). These clusters are less informative of learning processes and potential pedagogical improvements.
4.
CLUSTER ANALYSIS
The plurality of engagement trajectories calls for an equally diverse set of tools and interventions to support these subpopulations of learners. We compare the clusters along behavioral features routinely recorded in the MOOC database, as well as self-report features collected through optional surveys. The goal is to provide educators, instructional designers, and platform developers with insights for designing effective, and potentially adaptive, learning environments that best meet the needs of MOOC participants. In this section we first describe and motivate the set of features to compare trajectories on, and then present the results of our cross-cluster analyses. In the following section we offer interpretations of these findings, suggest design changes for future MOOCs, and highlight research opportunities.
4.1
Features
Understanding who learners are, why they enroll in the course, and other activities in the course is a first step towards illuminating potential influences on the self-selection of learners into these engagement patterns. Differences in the distribution of particular features across clusters may indicate that these demographic variables or learning processes affect learners’ engagement decisions. In all courses, learners received a survey at the end of the course. In the UG-level course, an additional pre-course survey was administered. Table 3 contains survey response rates by engagement group for each course. Note the high response rates in the UG-level course. Table 3: Survey Response Rates Auditing Completing Disengaging Sampling
HS
UG (pre)
UG (post)
GS
13% 43% 4% 3%
23% 31% 25% 20%
14% 45% 3% 1%
23% 65% 29% 5%
Survey Demographics: The demographic section of the optional surveys included age, gender, employment status, highest level of education achieved, and years of work experience. Geographical Location: Learners’ IP addresses were recorded and looked up on a country level using MaxMind’s GeoLite database. The country labels were then merged with the 2011 Human Development Index data [29]. Are MOOCs meeting their promise of global access? How do learners in different parts of the world interact with these courses? Intentions: At the start of the course, learners reported their reasons for enrolling by choosing applicable options from a set of predefined reasons. (E.g. “Enhance my resume for career or college advancement” or “It’s free”) We computed the probability of indicating each reason given the learner’s engagement trajectory. MOOCs attract a variety of learners with particular sets of objectives and motivations. Understanding learners’ goals is a precondition to effective designs that provide affordances for the varied needs of learners. Overall Experience: In post-course surveys, learners rated their “overall experience with the course” on a 7-point Likert scale from ‘Poor’ to ‘Excellent’. This measure provides insight into learners’ satisfaction with the course experience.
Forum Activity: A rich history of research in computersupported collaborative learning, as well as classroom and informal settings, shows that learning is enhanced through collaboration and discourse with a community [27]. The discussion forum provides the opportunity for this type of social learning in MOOCs. We measure learners’ active participation on the forum by counting the number of posts and comments each learner created during the course. Streaming Index (SI): This measure serves as a proxy for learners’ access to in-video assessments, which are only available when streaming videos off the course website. Access to in-video assessments is pedagogically important because formative assessment that gives leaners instant feedback has been associated with positive learning outcomes: Opportunities for frequent, formative testing enable learners to reflect on their knowledge state [3] and actively retrieve information in a way that facilitates learning [21]. Although the clustering of engagement patterns is partly based on video consumption, video access (streaming versus downloading) is independent of clustering. SI is defined as the proportion of overall lecture consumption that occurs online on the platform, as opposed to offline (downloaded). Streaming Index (SI) =
4.2
online lecture consumption total lecture consumption
Results
Learner clusters are compared along the feature dimensions introduced above using formal statistical tests. A oneway analysis of variance (ANOVA) is performed on each dimension (Table 4) and Tukey Honest Significant Differences (HSD) adjustments (pHSD ) are used for post hoc pair-wise cluster comparisons (Table 6) [11]. The tables report the statistical and practical significances of the comparisons. The latter is reported in terms of effect size: partial eta-squared (partial η 2 ) for multiple clusters and Cohen’s d for two clusters [6]. By convention, partial η 2 >.14 is considered a large effect, and partial η 2 >.06 medium; d>.8 is considered a large effect, and d>.5 medium. Absolute effect sizes can be extracted from group averages in Table 4. In the case of contrasting intentions to enroll, the statistical tests are based on 10,000 bootstrapped permutations of engagement group labels. To test for significance we evaluated the likelihood of observing the reasons that learners reported given their actual engagement group.
4.2.1
Survey Demographics
Note that the following demographic comparisons between engagement groups are only valid under the assumption that responding to the survey is independent of the demographic indicators (e.g. males and females are equally likely to respond to the survey). Gender: All three courses enrolled more male than female learners, though this trend was much more prominent for courses with more sophisticated content. There were around seven times more men than women in the UG- and GS-level courses (odds ratio of 7.4 and 7.5, respectively). The gender gap was much less prominent in the HS-level course, with only about twice as many men than women (odds ratio of 1.8). A log linear model of gender on cluster membership yields log odds for each engagement trajectory with confidence intervals for each course (Figure 2). Within each course, the gender ratios across the four engagement trajectories are not significantly different from each other
Table 4: Comparisons between Engagement Trajectories (One-Way ANOVAs) Average Indicator
Auditing
Completing
Disengaging
Sampling
HS Overall Experience† .894 .912 .830 .796 109 Streaming Index .869 .880 .900 .855 61.8 Forum Activity .242 .788 .189 .017 1536 UG Overall Experience† .731 .874 .716 n.a. 84.1 Streaming Index .643 .664 .723 .743 48.0 Forum Activity .251 1.71 .238 .024 1315 GS Overall Experience† .771 .794 .657 .687 44.9 Streaming Index .519 .667 .655 .661 64.8 Forum Activity .536 7.18 1.98 .090 2692 n.a. = not available due to low survey response rate ∗ Significant at p < .05 or d > .8 † Self-report measure (scaled to unit interval)
Auditing
HS
Completing Disengaging Sampling Auditing
UG
Completing Disengaging Sampling Auditing
GS
Completing Disengaging Sampling
2
4
6
8
10
12
14
16
p
Partial η 2