Defect Detection in a Distributed Software Maintenance Project. Alessandro Bianchi, Danilo Caivano, Filippo Lanubile, Giuseppe Visaggio. Dipartimento di ...
Defect Detection in a Distributed Software Maintenance Project Alessandro Bianchi, Danilo Caivano, Filippo Lanubile, Giuseppe Visaggio Dipartimento di Informatica – Università di Bari - Via Orabona, 4, 70126 Bari – Italy {bianchi, caivano, lanubile, visaggio}@di.uniba.it
Abstract A large software project may be distributed over multiple sites when the organization needs resources which are available on a single site. However, previous empirical research in the context of telecommunication organizations has shown a number of disadvantages. In this paper we continue our comparative postmortem analysis on data from a large software massive maintenance project in the information systems domain, which in part has been carried out on a single site, and in part across multiple sites of the same organization. Results show that no significant differences exist among the distributed and collocated work with respect to the ability to detect defects. Keywords: Global Software Development, Empirical Study, Massive Maintenance
1. Introduction The new forms of competition and cooperation that have arisen in software engineering as a result of the globalization process have had an impact on the whole software process. Software development and maintenance are often distributed across sites, thus involving an increasing number of people with different cultural backgrounds. Carmel and Agarwal [1] report that at present, 50 different nations are collaborating in different ways in software development. However, global software development has a number of drawbacks, which have been recognized by many studies, such as the need to apply ad hoc management methods [2], the need to use knowledge sharing tools [3, 4], and the overhead derived from staff communication interchanges [5]. Herbsleb and Moitra [6] classified the main drawbacks in global software development in a set of issues: !"strategic issues, concerning the decisions on how to divide the tasks among sites, so as to be able to work as independently as possible while maintaining efficient communication among sites; !"cultural issues, that arise when the staff come from different cultural backgrounds;
!"inadequate communication, caused by the fact that geographical distribution of the staff over several sites increases the costs of formal communications among team members and limits the possibility of carrying on the informal interchanges that traditionally helped to share experiences and foster cooperation to attain the targets; !"knowledge management, that is more difficult in a distributed environment as information sharing may be slow and occur in a non uniform manner, thus limiting the opportunities for reuse; !"project and process management issues, having to do with all the problems of synchronization of the work at the various different sites; !"technical issues, that have an impact on the communication network linking the various sites. Previous investigation on how geographical distribution affects software development and validation activities, have been carried out, respectively, at Lucent Technologies [7] and Alcatel [8]. Main findings were that distance negatively affects cost, time and quality. However, those studies were both conducted in the context of a telecommunication application domain and involved complex tasks. Our research takes its rise from the acknowledgement that the application domain and the software engineering task are both fundamental drivers of global software development costs and benefits. For projects involving massive, well-defined and stable activities, we hypnotize that the distribution over different geographical sites would present just a project management overhead. In this context, previous papers by the same authors concerned an explorative analysis [9] and an investigation on communication and project management issues [10]. In this paper, we investigate significant differences, if any, in detecting defects when maintenance activities are executed on a single site rather than on multiple sites. The paper is organized as follows: section 2 presents the maintenance project and the metrics used in the analysis; section 3 illustrates the data analysis; the results are discussed in section 4, and section 5 draws some conclusions.
2. Case Study Setting 2.1. Project Characterization Our research can be characterized as a post mortem analysis on data concerning a maintenance project carried out by EDS-Italia. In the following, we only summarize the main features of the maintenance project; interested readers can refer [10] for a more detailed presentation. The project consisted in a massive, non-routine maintenance of a large information system to solve the Y2K problem. To this end, the software system had been decomposed into 100 work-packages (WP), each being assigned to a working team. The maintenance effort had to deal with 52 of them. The job was partitioned between 2 different geographically distant sites, both settled in Italy. The size of each WP is expressed by the number of items, where an item can be a program, a library element or a Job Control Language (JCL) procedure, i.e., a procedure written in a scripting language to control the program execution in batch systems. Project Management Configuration Management Change
Test
Verification & Validation Review SQA
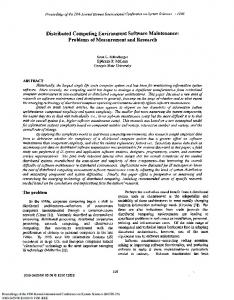
Figure 1. The process adopted for each WP in the maintenance project. The maintenance project was executed according to the following process (Fig. 1) that was enacted for each WP: !"a Project Management phase, aimed at managing and scheduling the activities for the WP; !"a Configuration Management phase, aimed at collecting and identifying all the artifacts produced within the WP; !"a Change phase, aimed at executing the maintenance of the items belonging to the WP; !"a Verification & Validation phase, aimed at looking for defects into the maintained artifacts. When defects are identified, the maintained items are reworked looping from the Corrective phase. The Verification & Validation phase, in turn, includes three sequential activities:
!"a Test activity, aimed at looking for failures and related faults into the maintained items !"a Review activity, aimed at looking for defects into the maintained artifacts through inspection meetings; !"a Software Quality Assurance (SQA) activity, aimed at verifying that the maintained artifacts comply with the company’s Quality System. For all the WPs, the Project Management established to start process execution on a single site (hereinafter referred to as Site1) but, depending on both rework needs and currently available resources, the execution of Change and Defect Detection phases could also be switched to another site (hereinafter referred to as Site2). According to [5], we consider the WPs entirely executed at Site1 as part of a collocated project; conversely the WPs executed both at Site1 and Site2 as belonging to a distributed project.
2.2. Data Collection The post-mortem analysis included all the work packages and covered the entire WP life cycle. In the following we only focus on the Defect Detection phase; the measures taken into account are: !"number of executed test cases and the number of faults that caused failures: in the following these will be referred to as faults from testing; !"number of reviews and the number of defects they found out (in the following, number of faults from review); !"number of audits and the number of issues they found out (in the following, number of non conformities); !"size of the WPs, expressed as number of items. Unfortunately, the number of failures has not been recorded by the organization, but only the number of faults generated by those failures. It is worth noting that the number of executed test cases, reviews and audits as well as the size of WPs are used only for verifying the comparability of the two projects. The dependent variables taken into account in our investigation are the number of faults from testing and from review and of the number of non conformities. Since the variation of WPs size is quite high, ranging from 6 items to 8337 items and with quartile values ranging from 68.5 items to 533 items, our analysis was based on the metric values normalized with respect to WP size. Having normalized, the tasks executed in the collocated and distributed project did not present technical differences. In fact, the number of items maintained was approximately the same in the two projects. The total number of maintained items was 26,739: among these, 14,163 items (53%) were maintained in the collocated project, and 12,576 items (47%) in the distributed one.
Box Plot (defects2.sta 27v*52c) 4,0
Test Cases per Item
3,5
3,0
2,5
2,0
1,5
1,0
0,5 Distributed
Collocated
Median 25%-75% Non-Outlier Range Outliers
Project
2.a)
For what concerns the activities of the Defect Detection phase: !"the density of test cases executed in the collocated project (median 1.327) is comparable to the normalized number of test cases executed in the collocated project (median 1.506); these results are summarized in Figure 2.a; !"the density of reviews executed in the collocated project (median 0.029) is comparable to the normalized number of reviews executed in the collocated project (median 0. 022); these results are summarized in Figure 2.b; !"the density of audits executed in the collocated project (median 0.030) is comparable to the normalized number of audits executed in the collocated project (median 0.020); these results are summarized in Figure 2.c.
Box Plot (defects2.sta 27v*52c) 1,2
3. Data Analysis
N. Review per Item
1,0
0,8
0,6
0,4
0,2
0,0
-0,2 Distributed
Collocated
Median 25%-75% Non-Outlier Range Outliers Extremes
Project
2.b) Box Plot (defects2.sta 27v*52c) 0,9 0,8
N. Audit per Item
0,7 0,6 0,5
Available data led to two samples from possibly different populations, and the samples taken into account were not normally distributed. Moreover: !"both samples are random samples from their respective populations; !"in addition to independence within each sample, there is mutual independence between the two samples; !"the measurement scale is at least ordinal. Since these assumptions allow to apply the Mann– Whitney U test [11], we used this nonparametric test to analyze defect metrics. In order to investigate whether the distribution between sites does affect defect metrics, for each metric Mi the null and alternative hypotheses are formulated as follows: Hi0: There is no difference between the values of metric Mi for collocated WPs and for distributed WPs. Hia: There is a difference between the values of metric Mi for collocated WPs and for distributed WPs.
0,4
3.1. Number of Faults from Testing
0,3 0,2 0,1 0,0 -0,1 Distributed
Collocated
Median 25%-75% Non-Outlier Range Outliers Extremes
Project
2.c) Figure 2 Boxplots of the normalized number of test cases (a), reviews (b), and audits (c), executed in collocated and distributed projects.
The first analysis made on defects data assessed the number of faults discovered through the execution of the test activity. Figure 3 shows the boxplots of the distribution of number of faults for both collocated and distributed projects. For both the collocated and distributed WPs, the median is 0; the WPs in collocated case does not present any outlier, and they have three extreme values (0.004, 0.021 and 0.071); conversely, the WPs in distributed case present two outliers (0.013 and 0.020) and two extremes (0.028 and 0.029).
The non parametric Mann-Whitney U test failed to reveal a significant difference between the two groups (plevel = 0.489).
3.3. Number of Non Conformities
Box Plot (defects2.sta 27v*52c)
Faults from Testing per Item
0,08 0,07 0,06 0,05 0,04 0,03 0,02 0,01 0,00 -0,01 Distributed
Collocated
The non parametric Mann-Whitney U test failed to reveal a significant difference between the two groups (plevel = 0.212).
Median 25%-75% Non-Outlier Range Outliers Extremes
Figure 5 shows the boxplots of the distribution of number of non conformities for both collocated and distributed projects., The median is 0.0 for the collocated WPs and it is 0.005 for the distributed WPs; the WPs in collocated case present two outliers (0.063 and 0.071) and two extremes (0.089 and 0.111); the WPs in distributed case present one outlier (0.032) and one extreme value (0.077). The non parametric Mann-Whitney U test failed to reveal a significant difference between the two groups (plevel = 0.633).
Project Box Plot (defects2.sta 27v*52c)
Figure 3 Boxplots of the faults from testing in collocated and distributed projects.
0,12
3.2. Number of Faults from Review Figure 4 shows the boxplots of the distribution of number of faults discovered during the execution of the review activity for both collocated and distributed projects. For the collocated WPs, the median is 0.020 and for the distributed WPs the median is 0.040; the WPs in collocated case present an extreme value (0.429) and they have not any outlier; conversely, the WPs in distributed case have an extreme value (0.20), and two outliers (0.139 and 0.154).
N. NCN per Item
0,10
0,08
0,06
0,04
0,02
0,00
-0,02 Distributed
Collocated
Median 25%-75% Non-Outlier Range Outliers Extremes
Project
Figure 5 Boxplots of the number of non conformities discovered in collocated and distributed projects.
Box Plot (defects2.sta 27v*52c) 0,45
Faults from Review per Item
0,40
4. Discussion and Conclusions
0,35 0,30 0,25 0,20 0,15 0,10 0,05 0,00 -0,05 Distributed
Collocated
Median 25%-75% Non-Outlier Range Outliers Extremes
Project
Figure 4 Boxplots of the number of faults from review in collocated and distributed projects.
In general, collocating the maintenance activities or splitting them over two sites did not differ with respect to defect metrics. In both cases, the observed differences were all not statistically significant at the conventional 0.05 p level. We postulate that these results can be explained by considering the context, which characterizes this case study. The specific maintenance task carried out was conceptually simple and it is characterized by a massive and repetitive nature. The main skills required to execute the maintenance were generic programming skills for the Y2K problem, and knowledge of the application domain and the software system to maintain. Therefore, the choice of the most adequate maintenance team to assign a WP
was straightforward, even when teams were geographically separated. The majority of maintainers had a deep knowledge of both the application domain and the system, because of previous experience maintenance related to the same system. Moreover, all of them had been trained on the Y2K problem, and many maintainers had been already involved in other Y2K activities. Moreover, there was a strong organizational and cultural cohesion between the two sites because they were part of the same company and located in the same country, at a distance no more than 300 Km. Finally, since it was a massive maintenance project, the project components were loosely coupled and therefore the need to manage a common knowledge was kept to a minimum. As a consequence of these features, even the followed defect detection strategy was quite straightforward: the loose coupling of the project components to be maintained allowed project managers an easy partition and distribution of the items to test and WPs to inspect across sites. So, each site could operate on each WP as an independent (sub)system. In this way, the distribution of the Verification & Validation phase between sites did not determine any statistically significant difference with respect to the execution of the same phase in a collocated environment. Nevertheless the cultural homogeneity of the teams involved in the collocated and in the distributed project, extremes and outliers are encountered in all sets of data. This can be explained by the human-centric nature of software processes: maintainers adopted different tactics to execute the assigned tasks, even if simple. These results confirm the hypothesis we made in our previous analysis [10] about the need of an adequate management of the strategic, cultural, and technical issues in order to make effective the distribution of software process. If so, the distribution of the process over geographically distant teams makes it possible to include skilled people, wherever they are available, without significant loose in technical aspects of the process as well as the Defect detection.
This study is one step towards a model of impact of geographical distance on critical factors of software development and evolution, which still needs further empirical investigation.
References [1]
[2] [3]
[4] [5]
[6]
[7]
[8]
[9]
[10]
[11]
E. Carmel, R. Agarwal, “Tactical Approaches for alleviating Distance in Global Software Development”, IEEE Software, Mar-Apr 2001, pp. 22-29. A. Cockburn, “Selecting a Project’s Methodology”, IEEE Software, July-August 2000, pp.64-71. K. Nakamura, Y. Fujii, Y. Kiyokane, M. Nakamura, K. Hinenoya, Y.H. Peck, S. Choon-Lian, “Distributed and Concurrent Development Environment via Sharing Design Information”, Proc. of the 21st Intl. Computer Software and Applications Conference, 1997. J. Suzuki, Y. Yamamoto, “Leveraging Distributed Software Development”, Computer, Sep 1999, pp.59-65. C. Ebert, P. De Neve, “Surviving Global Software Development”, IEEE Software, Mar-Apr 2001, pp.6269. J.D. Herbsleb, D. Moitra, “Global Software Development”, IEEE Software, Mar-Apr 2001, pp. 1620. J.D. Herbsleb, A. Mockus, T.A. Finholt, R.E. Grinter, “An Empirical Study of Global Software Development: Distance and Speed”, Proc. Intl. Conf. on Software Engineering, 2001, pp. 81-90. C. Ebert, C.H. Parro, R. Suttels, H. Kolarczyk, “Improving Validation Activities in a Global Software Development”, Proc. Intl. Conf. on Software Engineering, 2001, pp.545-554. A. Bianchi, D. Caivano, F. Lanubile, F. Rago, G. Visaggio, “Distributed and Colocated Projects: a Comparison”, Proc. of the IEEE Workshop on Empirical Studies of Software Maintenance, 2001, pp. 65 – 69. A. Bianchi, D. Caivano, F. Lanubile, F. Rago, G. Visaggio, “An Empirical Study of Distributed Software Maintenance”, Proc. of the IEEE Intl. Conf. on Software Maintenance, Montreal–Canada, October 2002, pp. 103–109. W.J. Conover, Practical Nonparametric Statistics, John Wiley and Sons, 1980