Copyright 2000 by the Genetics Society of America
Deficiency Mapping of Quantitative Trait Loci Affecting Longevity in Drosophila melanogaster Elena G. Pasyukova,*,† Cristina Vieira*,1 and Trudy F. C. Mackay* *Department of Genetics, College of Agriculture and Life Sciences, North Carolina State University, Raleigh, North Carolina 27695 and †Institute of Molecular Genetics of the Russian Academy of Sciences, Moscow 123182, Russia Manuscript received December 15, 1999 Accepted for publication July 7, 2000 ABSTRACT In a previous study, sex-specific quantitative trait loci (QTL) affecting adult longevity were mapped by linkage to polymorphic roo transposable element markers, in a population of recombinant inbred lines derived from the Oregon and 2b strains of Drosophila melanogaster. Two life span QTL were each located on chromosomes 2 and 3, within sections 33E–46C and 65D–85F on the cytological map, respectively. We used quantitative deficiency complementation mapping to further resolve the locations of life span QTL within these regions. The Oregon and 2b strains were each crossed to 47 deficiencies spanning cytological regions 32F–44E and 64C–76B, and quantitative failure of the QTL alleles to complement the deficiencies was assessed. We initially detected a minimum of five and four QTL in the chromosome 2 and 3 regions, respectively, illustrating that multiple linked factors contribute to each QTL detected by recombination mapping. The QTL locations inferred from deficiency mapping did not generally correspond to those of candidate genes affecting oxidative and thermal stress or glucose metabolism. The chromosome 2 QTL in the 35B–E region was further resolved to a minimum of three tightly linked QTL, containing six genetically defined loci, 24 genes, and predicted genes that are positional candidates corresponding to life span QTL. This region was also associated with quantitative variation in life span in a sample of 10 genotypes collected from nature. Quantitative deficiency complementation is an efficient method for finescale QTL mapping in Drosophila and can be further improved by controlling the background genotype of the strains to be tested.
T
HE genetic architecture of many traits important to human health, agriculture, and adaptive evolution is complex, such that the observed quantitative variation in phenotypes is attributable to the segregation of multiple interacting loci whose effects are sensitive to the environment (Falconer and Mackay 1996; Lynch and Walsh 1998). Recently, the discovery of abundant polymorphic molecular markers in the genomes of most species and the development of sophisticated statistical techniques have facilitated the mapping of quantitative trait loci (QTL) for many complex traits (reviewed by Lynch and Walsh 1998). Such genome-wide screens for QTL are the necessary first step toward the ultimate goal of understanding variation for quantitative traits in terms of molecular variation and effects at actual genetic loci responsible for variation in the trait phenotype (Mackay 1996). QTL map positions can correspond to those of candidate genes affecting the trait (e.g., Long et al. 1995; Gurganus et al. 1998, 1999; Nuzhdin et al. 1999), in which case direct tests of associa-
Corresponding author: Trudy F. C. Mackay, Department of Genetics, Box 7614, North Carolina State University, Raleigh, NC 27695. E-mail:
[email protected] 1 Present address: UMR 5558, Laboratoire de Biome´trie, Ge´ne´tique et Biologie des Populations, Universite´ Claude Bernard Lyon 1, 43 bd. 11 novembre, 69622 Villeurbanne Cedex, France. Genetics 156: 1129–1146 (November 2000)
tion of molecular variation at the candidate gene with phenotypic variation for the quantitative trait are possible (Mackay and Langley 1990; Lai et al. 1994; Long et al. 1998, 2000; Lyman et al. 1999). Often there are no candidate genes in the position to which the QTL map (Gurganus et al. 1998; Keightley et al. 1998; Nuzhdin et al. 1999). Thus, QTL analysis has great potential as a gene discovery tool. The path from QTL to gene is, however, long and difficult. Well-known problems are that QTL analyses are restricted to identifying factors affecting the trait(s) of interest that are segregating in the mapping population, and the sample size necessary to detect QTL increases greater than linearly as the QTL effect diminishes (Falconer and Mackay 1996; Lynch and Walsh 1998). Typically, genome-wide scans for QTL succeed in mapping a few QTL with moderate to large effects. However, the size of the genomic regions in which the QTL are located depends on the density of markers and the scale of the experiment, and is usually large. Even apparently small recombination distances can correspond to large physical distances, in regions of restricted recombination. Further, QTL mapping is an exercise in statistical model selection (Kao et al. 1999), and map positions and effects of significant QTL can vary according to the method of analysis used. The best-fitting model, identifying the most QTL, is not necessarily the
1130
E. G. Pasyukova, C. Vieira and T. F. C. Mackay
closest approximation to reality. The development of rapid and efficient genetic methods for high resolution QTL mapping is therefore a high priority if the promise of the method for identifying novel genes is to be fulfilled (Darvasi 1998). Life span is a typical quantitative trait, for which phenotypic variation in natural populations is attributable to both genetic and environmental components (Tower 1996; McClearn et al. 1997). While many candidate loci have been identified that affect life span in model systems (Lithgow 1996; Tower 1996), it is not known which (if any) of these loci are responsible for the observed genetic variation in life span. In a previous study, we mapped at least five sex-specific autosomal QTL affecting Drosophila melanogaster life span that segregated between two inbred strains, 2b and Oregon, using a panel of 98 recombinant inbred (RI) lines derived from the parental strains and a dense marker map of cytological insertion sites of the roo retrotransposon (Nuzhdin et al. 1997). The exact QTL locations differed somewhat according to whether a multiple marker regression-sequential search procedure (Churchill and Doerge 1994; Doerge and Churchill 1996) or composite interval mapping (Zeng 1994) was used to analyze the data. The most likely QTL positions on the cytological map according to the former method were 34E, 38E–43E, 67D–69D, 72A–73D, and 99B–100A. The corresponding QTL locations determined by composite interval mapping were 33E–34E, 38E–46C, 65D–67D, 72A–85F, and 99B (Nuzhdin et al. 1997). Thus, the same general chromosome regions were defined by both methods, but the exact borders differed. The sex-specific effects were the same for both models: the QTL at 34E/33E– 34E affected females only; the remaining four QTL were male-specific. Some of the regions to which the QTL mapped were large and possibly contain multiple QTL affecting life span. For example, the 38E–43E/46C second chromosome pericentromeric region covers oneeighth or one-fifth of the chromosome, depending on which analysis is used. Both statistical analyses give hints that this region is genetically complex with respect to life span, with either two (single marker-sequential search analysis) or three (composite interval mapping analysis) QTL exceeding the permutation-derived significance threshold (Figure 1A). In addition, alternative composite interval mapping models, differing in the number of marker cofactors included in the regression model and the size of the region to either side of the QTL test position from which marker cofactors are excluded, give different results. The QTL at 33E–34E and 99B were not always significant (Nuzhdin et al. 1997). Such instability can arise if QTL of opposite effects are tightly linked. Fine mapping of life span QTL in these strains is necessary to resolve these ambiguities. For the D. melanogaster model system, deficiency mapping is an effective method for localizing single gene
mutations to small genetic regions. In this report, we investigate the utility of a quantitative version of deficiency mapping to fine-map QTL affecting adult Drosophila life span, using deficiencies spanning the 32F– 44E and 64C–76B cytological regions on the second and third chromosomes, respectively. According to the QTL mapping analyses, the former contains one female-specific and from one to three male-specific QTL, while the latter harbors two male-specific QTL. Deficiency mapping reveals a rather more complicated genetic architecture. The Oregon and 2b strains represent a highly restricted sample of genetic variation affecting life span. Are sex-specific effects on life span observed generally, or are they peculiar features of these particular strains? Are the same QTL associated with variation in life span in flies recently collected from nature? To address these questions, we also assessed variation in life span among inbred lines recently derived from a natural population and evaluated the genetic interactions between naturally occurring QTL affecting life span and deficiencies that interacted with QTL affecting variation in life span between Oregon and 2b. MATERIALS AND METHODS Drosophila stocks: The unrelated isogenic laboratory lines 2b and Oregon RC are described in Pasyukova and Nuzhdin (1993) and Nuzhdin et al. (1997). The North Carolina (NC) inbred lines were derived by 14 generations of full-sib inbreeding from isofemale lines collected in 1994 at the Raleigh, NC Farmer’s Market (Fry et al. 1998). Stocks with deficiencies spanning the 32F–44E and 64C–76B cytological regions were obtained from the Bloomington Drosophila Stock Center (Bloomington, IN), from the European Drosophila Stock Center (Umea, Sweden), and from John Roote; they are listed in Table 1. The minimal set of deficiencies covering the designated regions was used, and when a choice was possible, deficiencies maintained over the same balancer were preferred. The deficiency breakpoints were provided by the donors and were not confirmed independently. All stocks were reared in shell vials with 10 ml cornmeal-molasses-agar medium, at 25⬚, unless otherwise specified. Crosses and longevity assays: Virgin females of 2b and Oregon (Ore) were crossed separately to males of the deficiency stocks listed in Table 1. Crosses with deficiencies from each chromosomal region containing putative QTL were made at the same time, with one exception involving six deficiencies noted below. The progeny of these crosses are of four genotypes, Df/2b, Bal/2b, Df/Ore, and Bal/Ore, where Df and Bal indicate the particular deficiency and the balancer chromosome against which it is maintained. Five virgin flies of the same genotype and sex that were collected on the same day were placed in a vial containing ⵑ5 ml of standard cornmealagar-molasses medium without live yeast on the surface. There were four replicate vials for each genotype and sex, for a total of 20 females and 20 males per genotype, or 160 individuals per cross. Flies were transferred to fresh medium approximately every 7–10 days. The number of dead and live flies was recorded in each vial every day. Rare escapers were noted and subtracted from further analysis, which reduced the sample sizes for some genotypes to 19 flies. The design was nearly completely balanced, with a total of 6549 flies scored. Longev-
Longevity QTL in Drosophila ity was estimated as the number of days a fly lived, from the day of eclosion to the day prior to registration of death. Life span of the 10 inbred NC lines was measured in a similar way, except that there were five replicate vials per line, each containing five virgin males or females. One escaped fly reduced the total number of flies scored to 499. In addition, females of each of the 10 NC lines were crossed to males of three overlapping deficiency stocks that uncovered a putative QTL segregating between 2b and Oregon (see results for further explanation). Progeny of these crosses were collected and scored for life span, again with five replicate vials containing five flies for each NC line/deficiency line/deficiency genotype/sex combination. The experiment was nearly completely balanced, with a total of 2991 flies scored. Life span determinations for all homozygous NC lines and for the NC lines crossed to deficiency stocks were conducted at the same time. Quantitative complementation test with deficiencies: The experimental design and interpretation is analogous to the quantitative complementation test (Long et al. 1996; Mackay and Fry 1996; Lyman and Mackay 1998; Gurganus et al. 1999). In a classical setting, deficiencies are used to map recessive mutations of large effect. Thus, a strain containing a single mutation, m, is crossed to overlapping deficiencies in the region to which the mutant maps, and the qualitative phenotype (mutant or wild type) of the Df/m genotypes is recorded. For quantitative traits, this design must be modified, because we are interested in detecting small differences in allelic effects between strains and because multiple loci with effects that are not strictly recessive contribute to the trait phenotype. Thus, at a minimum one must compare two strains as hemizygotes against a given deficiency. However, a significant difference in mean between Df/Ore and Df/2b genotypes could be attributable to different life span QTL alleles in the parental strains that are uncovered by the deficiency and/or to additive effects on life span of QTL that segregate between the parental strains but are not uncovered by the deficiency. To control for the latter confounding effect, the difference in mean between the Df/Ore and Df/2b genotypes is compared to that of the Bal/Ore and Bal/2b genotypes. The life span data from the four genotypes resulting from the cross of Oregon and 2b to each deficiency were analyzed by two-way factorial analysis of variance (ANOVA), with line L (Oregon and 2b) and genotype G (Df and Bal) as crossclassified main effects. A significant L ⫻ G interaction term is interpreted as quantitative failure to complement; i.e., the contrast (Df/Ore ⫺ Df/2b) ⫺ (Bal/Ore ⫺ Bal/2b) is significantly different from zero. As for all genetic complementation tests, there are two possible interpretations of quantitative failure to complement: (i) the deficiency uncovers Oregon and 2b alleles with different quantitative effects on life span (allelism); and (ii) interactions occur between Oregon and 2b life span QTL with other life span QTL on the Df or Bal chromosome (epistasis). As only allelic interactions are interpretable in the context of deficiency mapping, we have imposed further constraints on the nature of the observed L ⫻ G interactions to minimize the possibility of confounding epistatic interactions. A significant statistical interaction can occur either from a change of variance (the difference between the Ore and 2b genotypes is larger in either the Df or Bal genetic background) or a change of rank order (the difference between Oregon and 2b alleles is in the opposite direction in the Df and Bal genetic backgrounds). In the first instance, excepting the case of complete dominance of QTL alleles uncovered by a deficiency, one expects that failure to complement from allelism will result in a greater difference in mean life span between the Df/Ore and Df/2b genotypes than between the Bal/Ore and Bal/2b
1131
genotypes. Thus, we have considered only those statistical interactions resulting from a change of variance in which the contrast (Df/Ore ⫺ Df/2b) is significantly different from zero, and the contrast (Bal/Ore ⫺ Bal/2b) is not significant. For interactions resulting from opposite effects of Oregon and 2b in the Df and Bal genotypes, we also excluded those in which the contrast (Bal/Ore ⫺ Bal/2b) was significantly different from zero as potentially arising from epistasis. Typically, quantitative complementation tests utilize parental lines that differ significantly in mean performance for the trait of interest. In this case, the L term in the analysis of variance is often expected to be significant, since heterozygous genotypes formed by crossing the parental lines to a third line are also expected to differ in mean performance, under most genetic models. Thus, the L term is generally not considered in quantitative complementation analysis (Long et al. 1996; Mackay and Fry 1996; Lyman and Mackay 1998). However, if the parental lines do not differ in mean performance of the trait under consideration and yet genetic variance between the lines for the trait segregates in recombinant progeny, one infers that alleles affecting the trait are in dispersion in the parental lines. This is the case for Oregon and 2b, for which no significant difference in mean life span is observed when the flies are reared at 25⬚, but there is significant variation for life span among their recombinant derivatives (Nuzhdin et al. 1997; Leips and Mackay 2000; Vieira et al. 2000). Thus, at some loci affecting variation in life span, the Oregon allele increases longevity relative to the 2b allele, whereas, at others, the reverse is true; averaged over all loci, the “plus” and “minus” effects cancel. Under a model of additive gene action, one would not expect heterozygotes originating from Oregon and 2b to have different mean life spans in crosses to a third line. However, if a deficiency uncovers a plus allele in one line relative to a minus allele in the other and all other loci affecting the trait do not contribute a net difference in life span between the strains, one expects the difference in life span between deficiency hemizygotes to be greater than that between balancer heterozygotes. This will contribute to a main effect of line in the ANOVA, but possibly not to an L ⫻ G interaction, if the effect is not large. Therefore, for the special case of quantitative complementation tests involving this pair of lines, a significant effect of line in the above analyses of variance was also interpreted as evidence for quantitative failure to complement if the contrast (Df/Ore ⫺ Df/2b) was significantly different from zero and the contrast (Bal/Ore ⫺ Bal/2b) was not significantly different from zero. Similar logic applies to the analysis of the NC lines, but with multiple tester lines the test for interaction is whether there is variation among the lines in the difference in life span between deficiency hemizygotes and balancer heterozygotes. The main effect of G in the above analyses tests whether there is a difference in life span between the Df and Bal genotypes averaged over the Oregon and 2b backgrounds (or over the NC line backgrounds) and is not of interest. Statistical analyses: Distribution statistics, analyses of variance, and tests of significance of F-ratios using type III mean squares were estimated using SAS procedures MEANS and GLM (SAS Institute 1988). The full quantitative complementation test analysis was a three-way factorial analysis of variance according to the model y⫽⫹L⫹G⫹S⫹L⫻G⫹L⫻S⫹G⫻S ⫹ L ⫻ G ⫻ S ⫹ R(L ⫻ G ⫻ S), where L, G, and S are the fixed cross-classified main effects of line, genotype, and sex, and R is the random effect of replicate vial. In the full models, significant L ⫻ G ⫻ S interac-
1132
E. G. Pasyukova, C. Vieira and T. F. C. Mackay
tion terms are indicative of a sex-specific failure to complement. The data were also analyzed using reduced models for each sex separately, y ⫽ ⫹ L ⫹ G ⫹ L ⫻ G ⫹ R(L ⫻ G), since all of the longevity QTL described by Nuzhdin et al. (1997) were sex specific.
RESULTS
According to the QTL mapping results presented by Nuzhdin et al. (1997), the 33E–46C region contains at least one female-specific and one male-specific QTL, located, respectively, in the 33E–34E and 38E–46C cytogenetic intervals. In the initial quantitative deficiency screen of this region, we used 20 deficiencies that covered the second chromosome from 32F to 35E and from 36E to 44E, with the exception of section 40 and part of section 41, for which deficiencies were not available. At least two male-specific QTL map to the 65D–85F region of chromosome 3 (Nuzhdin et al. 1997). We used a total of 21 deficiencies that covered this region from 64C to 76B, with the exception of parts of sections 69 and 70, where deficiencies were not available. The deficiencies are denoted by Latin letters in Table 1 and Figures 1 and 2. These letter codes, rather than the full deficiency genotype designations, are used below for the sake of convenience in presenting the results. Mean longevities of the eight genotypic classes of progeny (males and females of genotypes Df/2b, Bal/2b, Df/Ore, and Bal/Ore) resulting from crosses of the 2b and Oregon lines to each of the 41 deficiencies are given in the appendix, Table A1. Considerable variation in longevity was observed between genotypes for both sexes. Mean longevity varied from 20 to 84 days in males and from 32 to 90 days in females. Analyses of variance for each of the 41 deficiencies including the effects of sex (S), line (L), and genotype (G) in the model demonstrated significant effects of sex on longevity for 27 deficiencies and significant L ⫻ S and L ⫻ G ⫻ S interactions for 9 deficiencies (data not shown), consistent with the sex specificity of QTL effects on longevity observed previously (Nuzhdin et al. 1997). Given these sex-specific effects, we have analyzed the effects of each deficiency by analyses of variance separately for males and females. The results of these analyses are presented in the appendix, Table A2. The deficiencies fell into two categories: those for which the L and/or L ⫻ G effects were significant (potential quantitative failure to complement) and those for which neither were significant (quantitative complementation). Inferring QTL locations based on patterns of quantitative complementation and failure to complement deficiencies relies on failure to complement as a consequence of allelism, not epistasis. To minimize the confounding effect of epistatic interactions on our inferences from deficiency mapping, we evaluated the
significance of the (Df/Ore ⫺ Df/2b) and the (Bal/ Ore ⫺ Bal/2b) contrasts for deficiencies exhibiting significant L and/or L ⫻ G effects and did not consider those for which the latter contrast was significant as failing to complement Oregon and 2b alleles uncovered by the deficiency. On the basis of the deficiency breakpoints and the observed patterns of complementation, we were able to infer which chromosomal regions contained putative longevity QTL and to compare their locations with those predicted by Nuzhdin et al. (1997). 32F–44E region: Significant L and L ⫻ G effects on longevity were not found for deficiencies a, b, c, d, e, f, s, and t of the second chromosome (Table A2, Figure 1B). These deficiencies mark chromosomal fragments from 32F1–3 to 35B9–C1 and from 42A1–2 to 43F–44A. In females, the L term was significant for deficiencies g and h, and the L ⫻ G term was significant for deficiency i. For deficiencies g and i, the (Df/Ore ⫺ Df/2b) contrast was significantly different from zero and the (Bal/Ore ⫺ Bal/2b) contrast was not significant, whereas for deficiency h, the former contrast was not significant while the latter was. We thus consider deficiencies g and i as exhibiting quantitative failure to complement resulting from allelism and the other deficiencies in the region as complementing the Oregon and 2b life span QTL. These deficiencies have a common region starting from 35B1–3; however, no longevity QTL are located up to 35B9–C1, according to information obtained from other deficiencies. Thus, the distal end of a putative region containing one or more QTL can be fixed at the end of subsection B of section 35 or at the beginning of subsection C of section 35, depending on the precise proximal endpoint of Df(2L)64j (c), and the proximal end of the region extends to 35E6. These data are not entirely consistent with a single female-specific QTL in the 35B–E region. First, the directions of effects of deficiencies g and i are different (Table 2): the mean longevity of Df g/2b is greater than that of Df g/Ore, whereas the mean longevity of Df i/2b is less than that of Df i/Ore. This difference in the direction of effects is significant. We performed a twoway analysis of variance with deficiency genotype (G: g, i) and line (L: 2b, Ore) as fixed cross-classified effects. The L ⫻ G interaction term was significant, indicating a significant difference in the directions of effects of deficiencies (Table 2). There are two possible interpretations of these results. First, this region may contain two female-specific QTL. In this case, the most probable hypothesis is that one QTL is located at 35B–C and the other QTL is located outside deficiency g but inside deficiency i, i.e., at 35C–E. Second, it is possible that a difference in genetic background can account for the different directions of effects on longevity of deficiencies i and g. In this case, a single QTL affecting longevity is located at 35B–C. Neither interpretation is consistent with the consideration of deficiency h as complementing the Oregon and 2b life span phenotypes, since this
Longevity QTL in Drosophila
1133
TABLE 1 Deficiency stocks
Deficiency Df(2L)Prl Df(2L)fn30, pr1 cn1 a Df(2L)64j, L2 a Df(2L)fn7, pr1 cn1 a Df(2L)A376, b1 cn1 bw1 b Df(2L)A263, b1 cn1 bw1 a,b Df(2L)A217, b1 cn1 bw1a Df(2L)fn5, pr1 cn1 a Df(2L)fn1a Df(2L)A245, b1 cn1 bw1 a Df(2L)TE35BC-8, pr1 cn1 sp1 a,b Df(2L)osp29, AdhUF pr1 cn1 Df(2L)TE35BC-34, b1 pr1 pk1 cn1 sp1 a,b Df(2L)TE35BC-24, b1 pr1 pk1 cn1 sp1 a,b Df(2L)TE35BC-3, b1 pr1 pk1 cn1 sp1 a,b Df(2L)TW50, cn1 Df(2L)pr-A16, cn1 bw1 Df(2L)VA12, cn1 bw1 Df(2L)TW161, cn1 bw1 Df(2L)DS6, b1 pr1 cn1 Df(2R)rl10a, lt1 cn1 Df(2R)nap9 Df(2R)cn87e Df(2R)cn9 Df(2R)CA53 Df(2R)44CE, al1 dpov1 b1 pr1 Df(3L)ZN47, ry506 Df(3L)pbl-X1 Df(3L)66C-G28 Df(3L)h-i22, Ki1 roe1 p p Df(3L)29A6, ri1 p p Df(3L)AC1, roe1 p p Df(3L)lxd6 Df(3L)vin2 Df(3L)vin5, ru1 h1 gl2 e4 ca1 Df(3L)vin7, e1 Df(3L)Ly, mvh1 Df(3L)fz-GF36 Df(3L)fz-GS1a, P{w[⫹tAR] ry[⫹t7.2AR] ⫽ wA[R]}66E Df(3L)fz-M21 Df(3L)BK10, ru1 red1 cv-c1 Sbsbd-1 sr1 e1 Df(3L)brm11 Df(3L)st-f13, Ki1 roe1 p p Df(3L)st7, e1 Df(3L)81k19 Df(3L)Cat, ri e Df(3L)VW3
Balancer CyO CyO CyO, Cy1 dp1v1 pr1 cn2 CyO, Cy1 dp1v1 pr1 cn2 CyO, Cy1 dp1v1 pr1 cn2 CyO, Cy1 dp1v1 pr1 cn2 In(2lr)Gla, Gla1 l(2)34De2 l(2)35Bb6 CyO, Cy1 dp1v1 pr1 cn2 CyO, Cy1 dp1v1 pr1 cn2 CyO, Cy1 dp1v1 pr1 cn2 CyO, Cy1 dp1v1 pr1 cn2 CyO CyO, Cy1 dp1v1 pr1 cn2 CyO, Cy1 dp1v1 pr1 cn2 CyO, Cy1 dp1v1 pr1 cn2 CyO CyO CyO CyO CyO In(2LR)bwV1 In(2LR)Gla In(2LR)bwV1, b1 SM6b, Cy1 Roi1 CyO CyO TM3 TM6B TM3 TM3 TM3 TM3 TM3, y⫹ Sb1 e1 Ser1 TM3 TM3, sb1 Ser1 TM3 TM1, jv TM6B TM3 TM6 TM3 TM6C, cu1 Sb1 e1 ca1 TM6B TM3, Sb1 Ser1 TM6B TM6, Hn p ssaP88 Ubxbx-341 e1 TM3
Cytogenetic breakpoints
Symbols in Figures 1–3
32F1–3; 33F1–2 34C6–7; 35B9–11 34D1; 35B9–C1 34E1–2; 35B3–5 34E3; 35C4–5 34E5–F1; 35C3 34F5; 35B3
a b c d φ e
34F5; 35C3 34F4–35A1; 35D5–7 35A4; 35B2 35B1; 35E1 35B1–3; 35E6 35B4; 35D4 34B4–6; 35E1–2 35C1; 35D3–7 36E4–F1; 38A6–8 37B2–12; 38D2–5 37C2–5; 38B2–C 38A6–B1; 40A4–B1 38F5; 39E7–F1 41A 42A1–2; 42E6–F1 42B4–C1; 43F–44A 42E; 44C 43E6; 44B6 44C4–5; 44E2–4 64C; 65C 65F3; 66B10 66B8–9; 66C9–10 66D10–11; 66E1–2 66F5; 67B1 67A2; 67D7–13 (or 67A5; 67D9–13) 67E1–2; 68C1–2 67F2–3; 68D6 68A2–3; 69A1–3 68C8–11; 69B4–5 70A2–3; 70A5–6 70C1–2; 70D4–5 70D1; 70E7 (or 70C16; 70E5) 70D2–3; 71E4–5 71C; 71F 71F1–4; 72D1–10 72C1–D1; 73A3–4 73A3–4; 74A3 73A3; 74F 75B8; 75F1 76A3; 76B2
g h f i k m n p q r s t u v w a b c d e f g h i k m n p q r s t u v w x
All stocks were obtained from the Bloomington Drosophila Stock Center (Bloomington, IN) except as marked. Genotypes and breakpoints are those provided by the Stock Centers. Df(2L)A376, b1 cn1 bw1 was obtained from John Roote. a Obtained from the European Drosophila Stock Center (Umea˚, Sweden). b Stocks used in the additional analysis of the 35BC region.
1134
E. G. Pasyukova, C. Vieira and T. F. C. Mackay
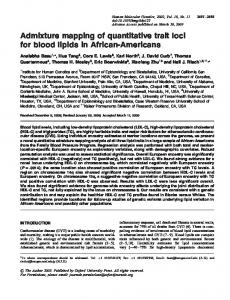
Figure 1.—Deficiency mapping of second chromosome QTL affecting longevity. (A) Plot of F-statistics from singlemarker regression/sequential search (dotted line) and likelihood-ratio (LR) statistics from composite interval mapping (solid line) against recombination rate and molecular markers (solid diamonds) for males (above the abscissa) and for females (below the abscissa). Replotted from the data of Nuzhdin et al. (1997). (B) Quantitative complementation test with deficiencies. Long tics mark sections (numbered from 33 to 48) and short tics mark subsections of polytene chromosomes. The position of the centromere is indicated by a “big flower.” Solid diamonds show insertion sites of the roo retrotransposon molecular markers. For females, a solid bar represents a chromosomal region where the LR statistic from composite interval mapping exceeds the threshold significance level, and a “small flower” represents a chromosomal region where the F-statistic from single-marker regression exceeds the threshold significance level; these are the regions in which female-specific QTL are located, according to the analysis of Nuzhdin et al. (1997). For males, open bars represent chromosomal regions where LR statistics from composite interval mapping exceed the threshold significance level and solid lines with open crosses represent chromosomal regions where F-statistics from single-marker regression exceed the threshold significance level; these are the regions in which male-specific QTL are located, according to the analysis of Nuzhdin et al. (1997). Solid lines marked by letters represent the deficiencies listed in Table 1. L designates the line effect and L * G designates the line-by-genotype interaction effect in analysis of variance of longevity. Pluses correspond to significant effects. Open ovals over deficiencies show regions in which life span QTL are located, according to the deficiency mapping analysis.
deficiency uncovers at least one of the putative QTL. Thus, we define the region containing the putative QTL as the largest interval defined by these analyses, 35B–E. While we cannot exclude the possibility that two or more
Figure 2.—Deficiency mapping of the third chromosome QTL affecting longevity. (A) Plot of F-statistics from singlemarker regression/sequential search (dotted line) and LR statistics from composite interval mapping (solid line) against recombination rate and molecular markers (solid diamonds) for males (above the abscissa) and for females (below the abscissa). Replotted from the data of Nuzhdin et al. (1997). (B) Quantitative complementation test with deficiencies. Long tics mark sections (numbered from 64 to 76) and short tics mark subsections of polytene chromosomes. Solid diamonds show sites of roo retrotransposon molecular markers. Open bars represent chromosomal regions where LR statistics from composite interval mapping exceed the threshold significance level and solid lines with open crosses represent chromosomal regions where F-statistics from single-marker analysis exceed the threshold significance level; these are the regions in which male-specific life span QTL are located, according to the analysis of Nuzhdin et al. (1997). Solid lines marked by letters represent the deficiencies listed in Table 1. L designates the line effect and L * G designates the line-bygenotype interaction effect in analysis of variance of longevity. Pluses correspond to significant effects. Open ovals over deficiencies show regions in which life span QTL are located, according to the deficiency mapping analysis.
longevity QTL are located in this region, these data indicate that at least one female-specific QTL is at 35B–E. The number of QTL in this region was further tested using additional deficiencies with informative breakpoints (see below). The region 36E–40B is covered by the overlapping deficiencies k, m, n, and p, and by deficiency q, which lies within p but does not overlap the others (Figure 1B). There were significant L effects on female longevity for deficiency k and significant L ⫻ G effects on female
Longevity QTL in Drosophila
1135
TABLE 2 Chromosome 2 deficiency analysis of QTL affecting longevity Mean longevity (SE) Deficiency stock [symbol]a Df(2L)fn5 [g] Df(2L)osp29 [i] Df(2L)TW50 [k] Df(2L)VA12 [n] Df(2L)TW161 [p] Df(2L)DS6 [q] Df(2L)TW161 [p] Df(2L)DS6 [q] Df(2R)r110a [r] Df(2R)cn9 [u] Df(2R)44CE [w]
Sex Females Females Males Females Males Males
Deficiency/ 2b 67 68 46 65 54 57 43 60 45 53 75
(2.6) (4.2) (3.4) (2.1) (2.7) (4.0) (3.1) (4.6) (3.5) (3.5) (1.4)
Deficiency/ Oregon 50 77 59 42 24 33 48 32 59 70 84
(3.2) (3.3) (4.3) (5.3) (3.1) (2.2) (3.5) (2.5) (2.5) (4.5) (2.0)
P valueb
Minimum number QTL
0.0002
1 or 2
0.003
1
37C–38A
0.535
1
38F–39E
0.879
1
38F–39E
NAc 0.211
1 1 or 2
Cytological position 35B–E
41A 44B–E
a
Symbols in Figures 1–3. P values from F-ratio tests of significance of deficient genotype-by-line interaction from two-way analysis of variance (see text for explanation). c Not applicable. b
life span for deficiencies m and n (Table A2). The difference between the effects of the deficiencies in the Oregon and 2b backgrounds was significant while the difference between the effects of the balancer chromosome was not significant for deficiencies k and n; for deficiency m, the reverse was true. We thus consider deficiencies k and n to fail to complement the Oregon and 2b life span QTL in a manner consistent with an allelic interpretation, but not deficiency m. A QTL affecting female life span is implicated at 37C–38A, the common region of overlap of deficiencies k and n. However, the mean longevity of Df k/Ore is greater than that of Df k/2b and the reverse relation is true for Df n, and this difference in the direction of effect is significant (Table 2). An alternative interpretation of these results is that there are two tightly linked QTL affecting female longevity in the region spanned by these deficiencies, one at 36E– 37C, at which the Oregon allele increases life span relative to the 2b allele, and one at 38A–38B, at which the 2b allele increases life span relative to the Oregon allele. Further, the interpretation of a single QTL affecting female life span is not consistent with apparent quantitative complementation of deficiency m, but the hypothesis that there are two QTL with opposite allelic effects in Oregon and 2b is consistent with this result: deficiency m is not significant because it uncovers both putative QTL. The deficiency m breakpoints more precisely localize the first of these putative QTL to the 37B–C region; the second remains at 38A–B. There were significant L and L ⫻ G effects on male life span for deficiency p and female life span for deficiency q and significant L effects on male life span for deficiency q (appendix, Table A2). In all cases there was a significant difference between the mean life span
of Df/Ore and Df/2b, but not of Bal/Ore and Bal/2b genotypes. We therefore infer that there was a significant effect of deficiency p on male life span and of deficiency q on the life span of both sexes (Figure 1B). The differential sex-specific effects of these deficiencies seems inconsistent, since deficiency q lies within deficiency p. The apparent contradiction can be overlooked since analysis of variance showed that the difference in effects of deficiencies p and q on longevity of males and females was not significant (Table 2). The simplest interpretation of these results is that one QTL affecting longevity of both males and females is located at 38F– 39E, the region defined by the borders of deficiency q. The hypothesis of three QTL between 37B–39E can be tested with further deficiencies in this region with informative breakpoints, as we have done for the 35B–E region (see below). Deficiency r does not overlap with any of the other deficiencies. A significant L effect on longevity was observed in crosses with this deficiency, both in males and females (Table A2, Figure 1B). Although the direction of the effect was the same in the two sexes, with Df r/Ore hemizygotes living longer than Df r/2b individuals (Table 2), the difference between Bal/Ore and Bal/ 2b genotypes was not significant in males but significant in females. Thus, according to our criteria for inferring failure to complement from allelic interaction, we interpret these results to indicate one male-specific QTL affecting longevity at 41A. Deficiencies u and w exhibit significant L ⫻ G effects and deficiency v exhibits a significant L effect on male longevity (Table A2, Figure 1B). The difference between Df/Ore and Df/2b is significant and that between Bal/ Ore and Bal/2b is not significant for deficiencies u and
1136
E. G. Pasyukova, C. Vieira and T. F. C. Mackay TABLE 3 Chromosome 3 deficiency analysis of QTL affecting longevity Mean longevity (SE) Deficiency stock [symbol]a Df(3L)ZN47 [a] Df(3L)pbl-X1 [b] Df(3L)66C-G28 [c] Df(3L)fz-M21 [q] Df(3L)fz-M21 [q] Df(3L)81k19 [v]
Sex Females Males Males Females Females
Deficiency/ 2b 61 35 71 54 71 75
(3.0) (4.0) (2.6) (3.4) (3.9) (3.7)
Deficiency/ Oregon 37 60 43 73 92 51
(2.9) (2.5) (5.3) (3.3) (4.5) (4.7)
P valueb
Minimum number QTL
Cytological position
NAc 0.001
1 1 or 2
64C–65C 65F–66C
NA NA NA
1 1 1
70E–71C 70E–71C 74A–F
a
Symbols in Figures 1–3. P values from F-ratio tests of significance of deficient genotype-by-line interaction from two-way analysis of variance (see text for explanation). c Not applicable. b
w, while the reverse is true for deficiency v. We therefore consider deficiencies u and w but not deficiency v in mapping QTL in this region. The difference between the effects of these deficiencies is not significant (Table 2). It is not clear whether deficiencies u and w overlap, due to the low precision of localization of the breakpoints of deficiency u (Table 1). If these deficiencies overlap, there is one QTL in the region of overlap at 44C (44C1–5). If these deficiencies do not overlap, there are two QTL affecting longevity in the 44B–E region: one QTL is at 44B–C and the other is at 44C–E. The quantitative deficiency mapping results are consistent with at least five to seven QTL on the second chromosome between 32F and 44E that affect variation in longevity between 2b and Oregon. Of these QTL, two or three are female specific, two or three are male specific, and one affects both sexes. 64C–76B region: Significant L and L ⫻ G effects on longevity were not found for deficiencies f, g, h, i, k, n, s, t, and u of the third chromosome (Table A2, Figure 2B). These deficiencies mark chromosomal fragments from 67A2–5 to 69B4–5, from 70C1–2 to 70D4–5, and from 71F1–4 to 74A3. Deficiencies a, m, v, and x have significant L effects on female longevity (Table A2, Figure 2B) and do not overlap with any other deficiencies with significant effects nor with each other. The difference between Df/ Ore and Df/2b genotypes was significant and the difference between Bal/Ore and Bal/2b genotypes was not significant for deficiencies a and v, whereas the reverse was true for deficiency x. Neither contrast was significant for deficiency m. We thus infer that there are two femalespecific QTL affecting longevity, one at 64C–65C and the other at 74A–F (Table 3, Figure 2B). Deficiency w has a significant L effect on male longevity (Table A2, Figure 2B), but neither the difference between Df/Ore and Df/2b genotypes nor Bal/Ore and Bal/2b genotypes was significant. No longevity QTL is inferred in the region uncovered by this deficiency.
Deficiencies e and d have significant L effects on male longevity and significant L ⫻ G effects on female longevity (Table A2, Figure 2B) and do not overlap with any other deficiencies with significant effects nor with each other. However, in all cases the differences between Df/ Ore and Df/2b genotypes were not significant and those between Bal/Ore and Bal/2b genotypes were significant. No longevity QTL are inferred in the regions uncovered by these deficiencies. Two overlapping deficiencies, b and c, have significant L effects on male longevity (Table A2, Figure 2B); in both cases the difference between Df/Ore and Df/2b genotypes is significant and the difference between Bal/ Ore and Bal/2b genotypes is not significant. The direction of their effects is opposite, though, and this difference is highly significant (Table 3). In this case, there are two possible interpretations of the result. First, there may be two male-specific QTL located in the nonoverlapping regions of the two deficiencies: one at 65F– 66B8, the other at 66B10–66C9. Alternatively, there may be one male-specific QTL in the region 66B8–10 that is common to both deficiencies b and c, and the opposite effects on longevity may be caused by epistatic effects that are not accounted for due to the uncontrolled genetic background of the deficiency chromosomes. Three overlapping deficiencies, p, q, and r, have significant L and L ⫻ G effects on longevity, but the sex specificities of the effects are different (Table A2). Deficiency p has a significant L effect on male longevity and deficiency r has a significant L ⫻ G effect on female longevity. However, in both cases, the Bal/Ore ⫺ Bal/2b effect is significant while the Df/Ore ⫺ Df/2b contrast is not significant. Deficiency q has a significant L effect on male longevity and significant L and L ⫻ G effects on female longevity. The Df/Ore ⫺ Df/2b contrast is significant, and the Bal/Ore ⫺ Bal/2b contrast is not significant in both sexes. The most parsimonious interpretation of these results is that one QTL affecting both male and female longevity is located at 70E–71C, the
Longevity QTL in Drosophila
1137 Figure 3.—Fine-scale mapping of the 35B–E region. (A) Quantitative complementation test with deficiencies for the 35B–E region. See B for a description of the symbols used. Numbered solid ovals represent bands of subsections 35B–35C. Dashed lines show the ends of deficiencies located within the corresponding region. (B) Genetic map of the 35B–E region. Genes in the region are numbered as follows: 1, osp; 2, Adh; 3, ms(2)35Bi; 4, l(2)35Bb; 5, l(2)35Bf; 6, l(2)35Bc; 7, l(2)35Be; 8, l(2)35Bd; 9, l(2)35Bg; 10, Su(H); 11, ck; 12, TFIIS; 13, vas; 14, stc; 15, rd; 16, l(2)35Cc; 17, gft; 18, ms(2)35Ci; 19, esg; 10, l(2)35Cg; 21, wor; 22, l(2)25Ch; 23, sna; 24, lace; 25, CycE; 26, l(2)35Df; 27, l(2)35Di; 28, Gli; 29, l(2)35Ea; 30, l(2)35De; 31, l(2)Dh; 32, l(2)35Ec; 33, ms(2)35Eb; 34, fs(2)35Ec; 35, BicC; 36, beat. The order of genes and deficiency breakpoints is according to Ashburner et al. (1999) and John Roote ( J. Roote, personal communication). See Figure 1B for the description of deficiency designations.
region for which deficiency q overlaps neither deficiency p nor deficiency r (Table 3). The minimum number of QTL affecting variation in longevity between 2b and Oregon in the 64C–76B cytological region varies from four to five, depending on the interpretation of the deficiency mapping results (Table 3). Of these QTL, two are female specific, one or two are male specific, and one affects both sexes. Fine-scale mapping of the 35B–E region: We performed a more detailed analysis of the 35B–E region to check the results of the quantitative deficiency mapping described above, to further evaluate the power of this method to resolve ambiguities observed in the initial mapping, and to map QTL with higher resolution. This region contains at least one putative female-specific QTL affecting longevity. Six additional deficiencies having one border within the region of interest were selected (Table 1, symbolized by Greek letters; Figure 3A) and crossed to Oregon and 2b. The longevity of the eight progeny genotypes was measured as described above, except that there were five replicate vials, not four, per genotype class. The experiment was nearly completely balanced (1197 flies in total). Mean longevities of the progeny resulting from these crosses are given in Table A1, and results of two-way analysis of variance of longevity are given in Table A2. Including these data with those obtained in the initial screen, we have results of quantitative complementation
tests from 13 deficiencies with one border within the 35B–E region and one deficiency covering the whole chromosome fragment 35B–E (deficiencies b, c, d, e, f, g, h, i, φ, , , , ; Table 1, Figure 3A). Failure to complement in a manner consistent with allelism was inferred for deficiencies g and i of the original 8 deficiencies tested in this region. Two of the 6 additional deficiencies tested, deficiencies and φ, do not have significant L and/or L ⫻ G effects on longevity (Table A2, Figure 3A). Deficiencies and have nominally significant L effects on female longevity, but in neither case is the difference between Df/Ore and Df/Bal genotypes significant. Deficiency has a significant L effect on male longevity, and deficiency has significant L ⫻ G effects on longevity in both sexes. The Df/Ore ⫺ Df/ 2b contrast is significant, and the Bal/Ore ⫺ Bal/2b contrast is not significant, for these deficiencies. Therefore, only 4 deficiencies in this region, g, i, , and , are considered to fail to complement Oregon and 2b alleles at loci affecting longevity, in a pattern that is consistent with an allelic interpretation. We evaluated whether there was significant variation in the difference in mean life span between Oregon and 2b as hemizygotes with deficiencies g, i, , and by two-way analysis of variance of longevity for genotypes Df g/2b, Df g/Ore, Df i/2b, Df i/Ore, . . . and Df /2b, Df /Ore. A significant L ⫻ G interaction term (where L is the main effect of line and G the main effect of
1138
E. G. Pasyukova, C. Vieira and T. F. C. Mackay
deficiency genotype) indicates whether there are differences between the effects of deficiencies. This term was highly significant (P ⬍ 0.0001). Not only did the sex effect vary, but there were also differences in the direction of the effect among the deficiencies with effects on female life span: for deficiencies i and , Df/Ore genotypes lived longer that Df/2b; for g the reverse was true (Table A1). These analyses suggest more than one QTL affecting life span in the 35B–E region. This inference is supported by the pattern of complementation and failure to complement. A QTL affecting either males or females at 35D5–E1, at which the Oregon allele increases life span relative to the 2b allele, is consistent with all but one (deficiency g) of the quantitative deficiency complementation results for this region, with complementation by deficiency h defining the left border and failure to complement of deficiencies and defining the right border. In addition, a femalespecific QTL at 35B9–C3, at which the 2b allele increases life span relative to the Oregon allele, is implicated by considering the complementation effects of deficiencies b, c, d, e, g, and f. However, a two-QTL model fails to explain the complementation results for deficiencies φ, , h, and . Postulating the existence of a third femalespecific QTL at 35C3, with equivalent but opposite effects to those of the 35B9–C3 QTL (i.e., the Oregon allele increases life span relative to the 2b allele), would account for the observation of complementation for deficiencies φ, , h, , and , which uncover both putative female-specific QTL (Figure 3A). Note that the location of the putative third QTL lies within the breakpoints of deficiencies g and , pushing the limits of deficiency mapping using cytologically determined breakpoints to the maximum. In summary, the quantitative deficiency complementation tests for the 35B–E region are consistent with two closely linked female-specific longevity QTL at 35B9–C3, with opposing allelic effects in Oregon and 2b, and a third QTL at 35D5–E1. The effects of the 35D5–E1 QTL in males and females appear to vary according to the genetic background. Longevity QTL with variable sexspecific effects depending on genetic background and external environment have been reported in previous studies of these lines (Leips and Mackay 2000). The 35B–E region is part of the Adh gene region, arguably the best annotated genetic region of any higher eukaryote to date. The entire 2.9-Mb region includes 229 genes, of which 73 have been identified genetically, and 49 located on the sequence (Ashburner et al. 1999). Further, the breakpoints of chromosomal aberrations, including the deficiencies used here, have been mapped to the sequence by complementation to known genes in the region. (J. Roote, personal communication) and to each other (Ashburner et al. 1999). The higher resolution analysis of deficiency breakpoints enables us to map the longevity QTL more precisely (Figure 3B). The complementation results are also consis-
tent with the three-QTL model proposed for this region given the genetically defined deficiency breakpoints. The right breakpoint of deficiency uncovers l(2)35Dh and that of deficiency uncovers beat-B, placing the 35D5–E1 QTL after the former gene, but including the latter (J. Roote, personal communication). Thus the left limit of this QTL is between BG:DS09217.4 or BG:DS09217.6 (it is not clear which of these predicted genes encodes l(2)35De and which corresponds to l(2)35Dh) and the right limit is BG:DS00365.4 (beat-B). This 185-kb region includes the genetically defined gene fs(2)35Ec, which has not been placed on the sequence, and 11 genes and predicted genes (Ashburner et al. 1999), 1 of which must correspond to fs(2)35Ec. The female-specific QTL in the 35B9–C3 region is located between the left breakpoint of deficiency b, which uncovers vasa (vas), and that of deficiency g, which uncovers shuttlecraft (stc; J. Roote, personal communication). This small (⬍50 kb) region contains stc and three predicted genes (Ashburner et al. 1999). The female-specific QTL inferred at 35C3 now maps more precisely to the ⵑ200-kb interval between the left breakpoints of deficiencies g (stc) and (which uncovers ms(2)35Ci; J. Roote, personal communication). This region also contains reduced (rd), l(2)35Cc, and gft, but only gft and ms(2)35Ci have been placed on the map. It also contains 13 additional genes and predicted genes, 2 of which must correspond to rd and l(2)35Cc (Ashburner et al. 1999). Segregation of 35B–C longevity QTL in chromosomes extracted from natural populations: We evaluated the life span of 10 inbred lines that were derived from a natural population (Table A3). There was considerable variation in longevity between the lines for both sexes. Mean longevity varied from 40 to 74 days in males and from 50 to 76 days in females. The effect of line (L) was highly significant in analyses of variance of longevity for the sexes separately and for sexes pooled (P ⬍ 0.0001 in all three ANOVAs; data not shown). In the two-way factorial analysis in which L and sex (S) are cross-classified main effects, the effect of S was significant (P ⬍ 0.02), but the L ⫻ S interaction term was not (P ⫽ 0.11; data not shown). Given that there is naturally occurring variation in life span among this set of lines, we can proceed to address the question of whether some fraction of this variation is attributable to segregation of alleles in the 35B–C region, to which two putative QTL were mapped that affected the difference in longevity between the laboratory lines, 2b and Oregon. Each of the 10 NC lines was crossed to deficiencies e, g, and h. Deficiency e does not uncover either QTL and was included as a control. Deficiency h uncovers the QTL at 35B9–C3 and at 35C3, while deficiency g uncovers only the 35B9–C3 QTL. The life span data were analyzed by three-way ANOVA for each deficiency, with L, S, and genotype (G, Df, or Bal) as cross-classified main effects. The L and S main effects are expected to
Longevity QTL in Drosophila
be significant, on the basis of the results of analysis of the homozygous NC lines presented above. Significance of the G term would not be surprising, given the different background genotypes of the Df and Bal chromosomes, although an insignificant G term could be taken as evidence that the deficiency did not uncover naturally segregating longevity QTL. Significance of the L ⫻ G and L ⫻ G ⫻ S interaction terms, however, is interpreted as evidence for different QTL alleles in the region uncovered by the deficiencies that cause variation (or sexspecific variation, for the case of a significant L ⫻ G ⫻ S effect) in life span among the NC lines. The results of these analyses are straightforward. The L and S effects are highly significant (P ⬍ 0.001) for each of the three deficiencies. The effect of G is significant for deficiencies g (P ⬍ 0.003) and h (P ⬍ 0.0001) but not for deficiency e (P ⫽ 0.84). There is a significant L ⫻ G interaction for deficiency h (P ⫽ 0.04) and a significant L ⫻ G ⫻ S interaction for deficiency g (P ⫽ 0.01). Thus, these analyses are formally consistent with the segregation in nature of QTL that interact with deficiencies g and h, which might correspond to the two QTL segregating between Oregon and 2b. We wished to determine which of the NC lines exhibited evidence of failure to complement these deficiencies and whether the data were consistent with one or two QTL in the 35B9–C3 region. To evaluate the comparative effects of deficiencies, two-way analyses of variance of longevity were conducted for each NC line and sex within line, with cross (C: deficiencies e, g, or h) and genotype (G: Df or Bal) as fixed cross-classified main effects. In this analysis, a significant C ⫻ G interaction term is used as an indication of a difference between the effects of the deficiencies tested in the same line. However, as 10 unplanned comparisons are being made within each sex, the nominal significance level should be adjusted downward to 0.05/10 ⫽ 0.005. The P values of the C ⫻ G interaction terms are given in Table 4, for the analyses including all three deficiencies in the model, and for the reduced model comparing the effects of deficiencies g and h. From the comparisons of the effects of all three deficiencies, it appears that there are significant differences between the three deficiencies for male life span in lines NC9, NC11, NC27, and NC33 and for female life span in lines NC9 and NC16. If the failure of Raleigh alleles to complement deficiencies g and h is attributable to the putative QTL uncovered by both (35B9–C3), the expectation is that the C ⫻ G term will not be significant for the comparison of deficiencies g and h, in the lines where this term was significant in the analysis considering all three deficiencies. This was the case for female life span in lines NC9 and NC16 and for male life span in line NC33 (Table 4). However, if Raleigh alleles fail to complement deficiency h but not deficiency g, as would be expected if naturally occurring variation segregates at the 35C3 but not the 35B9–C3 QTL, one would
1139 TABLE 4
P values from F-ratio tests of significance of cross ⫻ genotype interaction term from two-way analysis of variance of longevity for deficiencies crossed to NC lines
NC line NC1 NC6 NC7 NC9 NC11 NC16 NC24 NC27 NC30 NC33
Df(2L)fn5 [g]a vs. Df(2L)fn1 [h]a
Three deficiencies Males
Females
Males
Females
0.7159 0.4543 0.7674 0.0025* 0.0028* 0.0077 0.4685 0.0028* 0.9766 0.0010*
0.0513 0.0369 0.2239 0.0006* 0.0581 0.0015* 0.3572 0.3338 0.4275 0.1802
0.5826 0.1972 0.5915 0.0030* 0.0033* 0.0164 0.2986 0.0031* 0.8329 0.0747
0.1146 0.0464 0.1895 0.9229 0.2391 0.4887 0.9322 0.6666 0.2135 0.1237
See text for explanation. *P ⱕ 0.005. a Symbols in Figures 1–3.
expect the C ⫻ G term to be significant for the comparison of deficiency g and deficiency h, in the lines where this term was significant in the analysis considering all three deficiencies. This was observed for male life span in lines NC9, NC11, and NC27 (Table 4). While more complicated interpretations are possible, it seems clear that the observed pattern of failure of naturally occurring alleles to complement the three deficiencies is not consistent with a single QTL in the 35B–C region and not inconsistent with segregation in nature at two QTL affecting longevity in this region. The effects of the putative naturally occurring alleles are sex specific, but not female specific. Possibly the sex specificity of these effects is dependent on genetic background (Leips and Mackay 2000). DISCUSSION
Identification of the genetic loci at which naturally occurring variation for quantitative traits segregates is a fundamental problem for human health, evolution, and applied breeding. Chromosomal regions to which QTL map can be identified by linkage to polymorphic molecular markers in particular mapping populations (Falconer and Mackay 1996; Lynch and Walsh 1998). However, the size of the genomic region in which QTL are located is determined by the number of meioses sampled and the density of markers and is usually quite large; further, positions and effects of putative QTL depend on the exact statistical model used. Here, we have used quantitative deficiency mapping to finemap chromosomal regions in which QTL affecting variation in life span between the Oregon and 2b strains of D. melanogaster had been mapped by linkage to molecular
1140
E. G. Pasyukova, C. Vieira and T. F. C. Mackay
markers (Nuzhdin et al. 1997), and we can compare the results of the methods in terms of numbers, locations, and effects of life span QTL. According to the QTL mapping analyses of Nuhzdin et al. (1997), there was one female-specific QTL and at least one male-specific QTL in the 33E–46C cytological region and two male-specific QTL in the 65D–85F cytological region. Initial deficiency mapping within these cytological intervals revealed a minimum of five and four QTL in these second and third chromosome regions, respectively. The twofold increase in the minimum number of QTL in these two genomic intervals, representing ⵑ24% of the Drosophila genome, illustrates two important points. (1) The intervals to which QTL are mapped by recombination represent the aggregate effects of all QTL in the interval and may be subdivided into multiple contributing QTL. (2) The genetic architecture of differences in life span between Oregon and 2b is consequently more complex than indicated by the initial genome scan for QTL segregating between the two strains. The locations of the life span QTL inferred from deficiency mapping do not coincide exactly with the most likely map positions indicated by sequential multiple-marker analysis or with composite interval mapping. However, QTL locations inferred from composite interval mapping agree more closely overall with the deficiency mapping results than those inferred from sequential multiple-marker analysis. Both statistical analyses detected a QTL affecting female life span in the 33E–34E region, but the deficiencies uncovering this region complemented the Oregon and 2b alleles. Rather, failure to complement was detected for deficiencies uncovering the 35B–E region. A roo element insertion at 35B was segregating on the Oregon/2b recombinant inbred lines used to map the life span QTL, so it is puzzling why the more distal markers at 33E and 34E, and not the 35B marker, were associated with the life span QTL in both models detecting QTL by linkage to the markers. Both recombination mapping analyses detected a QTL affecting male life span in the pericentromeric region of the second chromosome, although the borders of the region inferred by composite interval mapping were wider than those inferred by sequential multiple-marker analysis. The former method encompassed three of the four remaining chromosome 2 QTL detected by deficiency mapping, while the latter method included two of these QTL. The two chromosome 3 QTL detected by sequential multiple marker analysis did not overlap any of the four QTLcontaining regions delineated by deficiency mapping, whereas the regions containing life span QTL determined by composite interval mapping included two of the QTL detected by deficiency mapping. The deficiency mapping analysis indicates that there are multiple closely linked QTL affecting variation in life span between Oregon and 2b in the chromosome
2 and chromosome 3 intervals studied. This is exactly the situation in which recombination-based QTL mapping methods can lead to biased estimates of QTL positions and effects (Haley and Knott 1992; Martı´nez and Curnow 1992), and it is the most likely source of the varying results from different statistical models applied to the same data. In this case, the deficiency mapping analysis agreed more closely with the results from modelbased composite interval mapping than with those from the nonparametric multiple-marker sequential search procedure, but this result cannot be generalized to an overall preference for model-based over nonparametric methods. The former methods may perform better if the model assumptions are satisfied by the data, but there is no way of knowing whether this is true, given real data (Doerge and Churchill 1996). In practice, disagreement between alternative statistical analyses of genome scans for QTL should be taken to indicate underlying genetic complexity. Further fine-mapping efforts should focus on the entire chromosome region indicated as significant by all analyses and also include adjacent, possibly nonsignificant regions. In the one instance in which the composite interval mapping and multiple-marker sequential search methods agreed for the longevity data of Nuzhdin et al. (1997), the femalespecific QTL at 33E–34E on chromosome 2, multiple linked QTL were detected in the adjacent interval by deficiency mapping. There is a good case for using the quantitative deficiency mapping approach as a screen for QTL affecting any quantitative trait of interest in Drosophila. Many artificial selection lines have been produced that differ in morphology, behavior, and physiology, as do isofemale lines derived from natural populations. Mapping QTL by linkage to molecular markers involves the further derivation of highly inbred lines with extreme values of the trait, finding informative molecular markers, generating a large number of individuals from a mapping population derived from the parental lines, and screening them for the phenotype of interest and their molecular marker genotypes. Linkage mapping is a long-term and laborious procedure, over which deficiency screens for QTL have several advantages: 1. Selected or extreme lines can be utilized without further manipulation (although homozygosity of alternative QTL alleles in the strains tested obviously increases the power of the method). This could prove advantageous if the trait studied is subject to inbreeding depression. 2. Development of molecular markers is not necessary, and thus deficiency mapping is technically easier than mapping QTL by linkage to polymorphic transposable element insertion sites, microsatellite markers, or other markers. 3. The genotypes to be compared can be replicated to any desired level, giving similar advantages to the
Longevity QTL in Drosophila
construction of RI lines with respect to increased power to detect QTL with small effects and testing for genotype-environment interactions. 4. In favorable regions of the genome, well covered by deficiencies, deficiency mapping is capable of much finer resolution of QTL positions and discrimination of linked QTL than can be achieved using meiotic mapping with a similar size of experiment. 5. Recombination is not uniform over the genome and is particularly restricted near the tips and bases of each chromosome. Small recombination distances in these regions thus correspond to large physical distances. Deficiency breakpoints are more uniformly distributed across each chromosome, giving better resolution in regions of restricted recombination. 6. Deficiency mapping is easily extensible to multiple strains or lines, whereas recombination QTL mapping is usually restricted to one pair of lines at a time. Deficiency mapping thus potentially allows mapping of a larger sample of alleles of a particular QTL affecting a trait than linkage mapping and further enables inferences to be made about gene frequencies of segregating alleles in nature. Accompanying these many advantages are disadvantages and caveats for the use of quantitative deficiency mapping to locate QTL: 1. The major disadvantage of deficiency mapping is that a failure to complement, whether qualitative or quantitative, cannot be unambiguously attributed to an interaction between the Df and QTL alleles in the region uncovered by the Df (allelism), or to an interaction between the Df and QTL alleles elsewhere in the genome (epistasis). Widespread and large epistatic interactions between QTL can result in false positive results of quantitative deficiency tests, although one could argue that in this case the deficiency uncovers a gene in the same pathway as the QTL affecting the trait of interest. Imposition of constraints on the significance of differences between Df chromosomes and Bal chromosomes in the same genetic backgrounds, as has been done here, can serve to limit (but not eliminate) any confounding effects of epistasis on interpretation of statistical interactions in terms of allelic failure to complement. Further, 20 of the 47 deficiencies tested were not significantly associated with L or L ⫻ G effects on life span, suggesting that pervasive epistasis does not invalidate the approach. 2. Estimates of the fraction of the Drosophila genome covered by deficiencies range from a minimum of 0.70 to a maximum of 0.80. QTL falling in the regions not covered by deficiencies cannot be detected using this method. 3. Since deficiency mapping compares the mean phenotypes of hemizygotes and heterozygotes, the power
1141
of the method is greatest for recessive QTL alleles and is reduced for partially recessive/dominant and additive QTL. Dominant QTL cannot be detected using this method. 4. Estimates of homozygous, heterozygous, and epistatic QTL effects can be obtained from experiments in which QTL are mapped by linkage to molecular markers, but not using quantitative deficiency mapping. 5. The deficiency stocks vary greatly in genetic background, with regard to quantitative differences between different wild-type strains and qualitative differences in dominant and recessive mutant markers, both for the Df chromosomes and the balancer chromosomes over which they are maintained. The heterogeneous genetic backgrounds pose a problem for comparing effects across overlapping deficiencies. While variable effects could be due to multiple linked QTL, they could also be caused by differences in genetic background. This problem arose in the interpretation of numbers of life span QTL in regions in which overlapping deficiencies had different effects. We have shown that the effects of life span QTL are exquisitely sensitive to changes in genetic background as well as physical environment (Leips and Mackay 2000; Vieira et al. 2000). In the future, it might be possible to discriminate between these alternative interpretations by substituting a common inbred background genotype into the parental lines to be tested and the deficiency stocks, thus ensuring all Df chromosomes are maintained against the same balancer chromosome. Many candidate genes have been postulated to affect life span: genes involved in resistance to heat shock, physiological and oxidative stress, DNA repair and replication, cellular aging, metabolic energy storage, and loci with sex-specific effects on fertility and reproduction. Several key candidate loci, including the structural genes for Alcohol dehydrogenase, the small heat shock proteins, Superoxide dismutase, and Catalase, map to the regions also containing life span QTL and uncovered by deficiencies in this experiment. None of these loci remains a viable candidate locus that could harbor alleles affecting differences in life span between Oregon and 2b, on the basis of deficiency mapping results. This result does not mean that the other key candidate loci do not affect variation in life span in other strains, but does highlight the importance of testing for quantitative failure to complement between QTL and candidate locus alleles (Lyman and Mackay 1998; Lyman et al. 1999), to narrow down the potential field of candidate genes for further study. We have detected a minimum of 11 life span QTL segregating between Oregon and 2b. Most of the genetic regions containing these QTL, as delineated by cytological deficiency breakpoints, include far too many loci to
1142
E. G. Pasyukova, C. Vieira and T. F. C. Mackay
warrant formulating hypotheses as to which are likely candidates. However, it should be possible to combine higher resolution deficiency mapping with quantitative complementation tests to P-element insertions and mutations in these regions to refine the list of genetic loci that could correspond to life span QTL. Our fine-scale deficiency analysis of the 35B–E region shows how powerful this approach can be. The three putative longevity QTL in the 35B–E region correspond to six genetically defined loci and 24 additional predicted genes. stc is a positional candidate for the 35B9–C1 QTL. Stc protein shows sequence similarity to the mammalian transcription factor NF-X1 and also has a RNA-binding domain (Stroumbakis et al. 1996). The 35C3 QTL includes reduced, identified by a mechanosensory bristle mutant phenotype, two homozygous lethal genes [l(2)35Cc and gft], and one male-sterile gene [ms(2)35Ci] as positional candidates, as well as a predicted gene encoding a protein with leucine-rich repeats, an inferred metal ion transporter, a gene encoding a product with an inferred c-MYC homology domain, and an inferred gene encoding a product with weak homology to myosin heavy chain proteins, among others (Ashburner et al. 1999). The 35D5–E1 includes as positional candidates a female-sterile gene [fs(2)35Ec] and several predicted genes with homologies to tektins, aminopeptidase N, ␣-2 macroglobulins, and serine carboxypeptidases (Ashburner et al. 1999). None of these positional candidate genes were considered a priori to be candidate loci affecting longevity, illustrating the utility of QTL mapping to identify alleles at loci with novel pleiotropic effects. Further, loci in the 35B–C region were also associated with variation in life span in a small sample of genotypes collected from a natural population. This is an encouraging result, as it suggests that QTL contributing to variation in a quantitative trait between two particular strains may also contribute to variation of the trait in nature, a necessary prerequisite for linkage disequilibrium mapping of the quantitative trait nucleotides (QTN) at the candidate genes causing naturally occurring quantitative genetic variation (Lai et al. 1994; Long et al. 1998, 2000; Lyman and Mackay 1999). We thank John Roote for his assistance in delineating deficiency breakpoints in the 35B–E region and an anonymous reviewer for constructive comments on the original version of this manuscript. This work was supported by National Institutes of Health (NIH) grant GM45146 to T.F.C.M., Russian Fund of Basic Research grant 00-0448770 to E.G.P., and NIH TW00997 to T.F.C.M. and E.G.P. This is a publication of the W. M. Keck Program for Behavioral Biology.
LITERATURE CITED Ashburner, M., S. Misra, J. Roote, S. E. Lewis, R. Blazej et al., 1999 An exploration of the sequence of a 2.9-Mb region of the genome of Drosophila melanogaster : the Adh region. Genetics 153: 179–219.
Churchill, G. A., and R. W. Doerge, 1994 Empirical threshold values for quantitative trait mapping. Genetics 138: 963–971. Darvasi, A., 1998 Experimental strategies for the genetic dissection of complex traits. Nat. Genet. 18: 19–24. Doerge, R. W., and G. A. Churchill, 1996 Permutation tests for multiple loci affecting a quantitative character. Genetics 142: 285–294. Falconer, D. S., and T. F. C. Mackay, 1996 Introduction to Quantitative Genetics, Ed. 4. Longman, Harlow, Essex, UK. Fry, J. D., S. L. Heinsohn and T. F. C. Mackay, 1998 Heterosis for viability, fecundity, and male fertility in Drosophila melanogaster : comparison of mutational and standing variation. Genetics 148: 1171–1188. Gurganus, M. C., J. D. Fry, S. V. Nuzhdin, E. G. Pasyukova, R. F. Lyman et al., 1998 Genotype-environment interaction for quantitative trait loci affecting sensory bristle number in Drosophila melanogaster. Genetics 149: 1883–1898. Gurganus, M. C., S. V. Nuzhdin, J. W. Leips and T. F. C. Mackay, 1999 High resolution mapping of quantitative trait loci for sternopleural bristle number in Drosophila melanogaster. Genetics 152: 1585–1604. Haley, C. S., and S. A. Knott, 1992 A simple regression method for mapping quantitative trait loci in line crosses using flanking markers. Heredity 69: 315–324. Kao, C.-H., Z-B. Zeng and R. D. Teasdale, 1999 Multiple interval mapping for quantitative trait loci. Genetics 152: 1203–1216. Keightley, P. D., K. H. Morris, A. Ishikawa, V. M. Falconer and F. Oliver, 1998 Test of candidate gene-quantitative trait locus association applied to fatness in mice. Heredity 81: 630–637. Lai, C., R. F. Lyman, A. D. Long, C. H. Langley and T. F. C. Mackay, 1994 Naturally occurring variation in bristle number and DNA polymorphisms at the scabrous locus of Drosophila melanogaster. Science 266: 1697–1702. Leips, J., and T. F. C. Mackay, 2000 Quantitative trait loci for life span in Drosophila melanogaster : interactions with genetic background and larval density. Genetics 155: 1773–1788. Lithgow, G. J., 1996 Invertebrate gerontology: the age of mutations of Caenorhabditis elegans. BioEssays 18: 809–815. Long, A. D., S. L. Mullaney, L. A. Reid, J. D. Fry, C. H. Langley et al., 1995 High resolution mapping of genetics factors affecting abdominal bristle number in Drosophila melanogaster. Genetics 139: 1273–1291. Long, A. D., S. L. Mullaney, T. F. C. Mackay and C. H. Langley, 1996 Genetic interactions between naturally occurring alleles at quantitative trait loci and mutant alleles at candidate loci affecting bristle number in Drosophila melanogaster. Genetics 144: 1497– 1518. Long, A. D., R. F. Lyman, C. H. Langley and T. F. C. Mackay, 1998 Two sites in the Delta gene contribute to naturally occurring variation in bristle number in Drosophila melanogaster. Genetics 149: 999–1017. Long, A. D., R. F. Lyman, A. H. Morgan, C. H. Langley and T. F. C. Mackay, 2000 Both naturally occurring insertions of transposable elements and intermediate frequency polymorphisms at the achaete-scute complex are associated with variation in bristle number in Drosophila melanogaster. Genetics 154: 1255–1269. Lyman, R. F., and T. F. C. Mackay, 1998 Candidate quantitative trait loci and naturally occurring variation for bristle number in Drosophila melanogaster : the Delta-Hairless gene region. Genetics 149: 983–998. Lyman, R. F., C. Lai and T. F. C. Mackay, 1999 Linkage disequilibrium mapping of molecular polymorphisms at the scabrous locus associated with naturally occurring variation in bristle number in Drosophila melanogaster. Genet. Res. 74: 303–311. Lynch, M., and J. B. Walsh, 1998 Genetics and Analysis of Quantitative Traits. Sinauer Associates, Sunderland, MA. Mackay, T. F. C., 1996 The nature of quantitative genetic variation revisited: lessons from Drosophila bristles. BioEssays 18: 113–121. Mackay, T. F. C., and J. D. Fry, 1996 Polygenic mutation in Drosophila melanogaster : genetic interactions between selection lines and candidate quantitative trait loci. Genetics 144: 671–688. Mackay, T. F. C., and C. H. Langley, 1990 Molecular and phenotypic variation in the achaete-scute region of Drosophila melanogaster. Nature 348: 64–66. Martı´nez, O., and R. N. Curnow, 1992 Estimating the locations
Longevity QTL in Drosophila and sizes of the effects of quantitative trait loci using flanking markers. Theor. Appl. Genet. 85: 480–488. McClearn, G. E., B. Johansson, S. Berg, N. L. Pederson, F. Ahern et al., 1997 Substantial genetic influence on cognitive abilities in twins 80 or more years old. Science 276: 1560–1563. Nuzhdin, S. V., E. G. Pasyukova, C. L. Dilda, Z-B. Zeng and T. F. C. Mackay, 1997 Sex-specific quantitative trait loci affecting longevity. Proc. Natl. Acad. Sci. USA 94: 9734–9739. Nuzhdin, S. V., C. L. Dilda and T. F. C. Mackay, 1999 The genetic architecture of selection response: inferences from fine-scale mapping of bristle number quantitative trait loci in Drosophila melanogaster. Genetics 153: 1317–1331. Pasyukova, E. G., and S. V. Nuzhdin, 1993 Doc and copia instability in an isogenic Drosophila melanogaster stock. Mol. Gen. Genet. 240: 302–306.
1143
SAS Institute, 1988 SAS/STAT User’s Guide, Release 6.03 Edition. SAS Institute, Cary, NC. Stroumbakis, N. D., Z. Li and P. P. Tolias, 1996 A homolog of human transcription factor NF-X1 encoded by the Drosophila shuttle craft gene is required in the embryonic central nervous system. Mol. Cell. Biol. 16: 192–201. Tower, J., 1996 Aging mechanisms in fruit flies. BioEssays 18: 799– 807. Vieira, C., E. G. Pasyukova, Z-B. Zeng, J. B. Hackett, R. F. Lyman et al., 2000 Genotype-environment interaction for quantitative trait loci affecting life span in Drosophila melanogaster. Genetics 154: 213–227. Zeng, Z-B., 1994 Precision mapping of quantitative trait loci. Genetics 136: 1457–1468. Communicating editor: J. B. Walsh
1144
E. G. Pasyukova, C. Vieira and T. F. C. Mackay
APPENDIX TABLE A1 Mean longevity (⫾ standard/error) Males
Females
Deficiency Deficiency stock Df(2L)Prl Df(2L)fn30 Df(2L)64j Df(2L)fn7 Df(2L)A376 Df(2L)A263 Df(2L)A217 Df(2L)fn5 Df(2L)fn1 Df(2L)A245 Df(2L)TE35BC-8 Df(2L)osp29 Df(2L)TE35BC-34 Df(2L)TE35BC-24 Df(2L)TE35BC-3 Df(2L)TW50 Df(2L)pr-A16 Df(2L)VA12 Df(2L)TW161 Df(2L)DS6 Df(2R)r110a Df(2R)nap9 Df(2R)cn87e Df(2R)cn9 Df(2R)CA53 Df(2R)44CE Df(3L)ZN47 Df(3L)pbl-X1 Df(3L)66C-G28 Df(3L)h-i22 Df(3L)29A6 Df(3L)AC1 Df(3L)lxd6 Df(3L)vin2 Df(3L)vin5 Df(3L)vin7 Df(3L)Ly Df(3L)fz-GF3b Df(3L)fz-GS1a Df(3L)fz-M21 Df(3L)BK10 Df(3L)brm11 Df(3L)st-f13 Df(3L)st7 Df(3L)81k19 Df(3L)Cat Df(3L)VW3
54 66 42 70 51 56 49 58 39 73 47 51 52 30 57 28 51 50 54 57 45 52 46 53 53 75 50 35 71 61 35 50 53 52 47 59 54 46 51 54 47 57 55 54 64 51 55
2b
Oregon
(1.8) (1.7) (3.2) (1.8) (2.6) (2.4) (3.2) (3.1) (3.6) (3.4) (3.2) (3.3) (2.6) (3.6) (5.3) (5.2) (4.7) (4.2) (2.7) (4.0) (3.5) (3.4) (2.7) (3.5) (4.6) (1.4) (6.3) (4.0) (2.6) (4.6) (4.4) (4.7) (4.1) (3.8) (3.3) (1.4) (4.9) (3.4) (2.8) (3.4) (2.8) (6.4) (2.8) (1.8) (3.5) (4.0) (3.1)
47 (4.6) 54 (5.0) 37 (3.7) 65 (3.4) 59 (3.6) 60 (3.3) 55 (2.5) 58 (5.0) 54 (2.7) 75 (2.6) 72 (2.9) 58 (3.7) 56 (3.8) 69 (3.2) 70 (2.7) 49 (4.4) 53 (5.2) 53 (4.0) 24 (3.1) 33 (2.2) 59 (2.5) 51 (4.2) 54 (4.1) 70 (4.5) 45 (3.2) 84 (2.0) 26 (1.0) 60 (2.5) 43 (5.3) 72 (3.8) 51 (3.1) 57 (5.5) 58 (3.2) 47 (2.9) 46 (3.0) 52 (4.0) 45 (7.1) 45 (4.0) 62 (4.7) 73 (3.3) 51 (3.2) 61 (4.8) 56 (5.8) 56 (3.7) 50 (3.7) 65 (3.2) 57 (5.0)
Balancer
56 58 61 62 60 52 50 47 57 70 54 54 67 52 57 54 63 41 64 68 51 54 67 63 54 70 53 53 58 54 37 63 48 48 50 50 49 41 40 45 18 57 63 50 64 56 44
2b
Oregon
(4.0) (5.2) (3.4) (2.7) (3.5) (4.6) (3.0) (4.8) (3.4) (3.7) (4.1) (4.7) (2.5) (6.0) (4.6) (3.1) (3.8) (2.6) (3.5) (2.6) (4.2) (3.0) (3.2) (2.4) (4.0) (2.5) (4.8) (5.2) (5.1) (2.9) (2.9) (3.5) (2.1) (3.4) (2.9) (2.7) (2.9) (4.1) (3.9) (3.8) (2.9) (2.9) (1.7) (2.0) (3.3) (3.5) (2.2)
58 (1.9) 54 (5.1) 55 (4.8) 59 (4.7) 57 (3.8) 54 (3.2) 45 (4.3) 54 (4.1) 55 (3.9) 57 (5.5) 49 (4.3) 52 (5.2) 60 (4.4) 64 (3.8) 52 (2.8) 45 (4.6) 53 (5.3) 45 (3.8) 68 (2.9) 56 (2.4) 61 (3.6) 55 (5.4) 62 (4.6) 65 (1.1) 44 (4.4) 63 (4.1) 66 (3.5) 62 (4.1) 41 (1.9) 75 (1.1) 60 (4.7) 61 (3.4) 43 (4.2) 54 (2.6) 67 (3.0) 45 (3.3) 48 (2.6) 52 (2.9) 56 (4.2) 61 (4.4) 20 (2.8) 61 (6.3) 63 (6.0) 53 (2.7) 62 (4.7) 64 (2.4) 55 (3.6)
Deficiency
46 63 38 62 62 67 65 67 60 76 54 68 65 56 61 46 45 65 43 60 45 58 51 67 62 71 61 55 80 58 66 61 60 60 61 71 55 55 57 71 54 70 50 70 75 64 75
2b
Oregon
(3.0) (2.6) (2.3) (4.7) (4.4) (2.1) (4.5) (2.6) (4.1) (3.4) (3.8) (4.2) (2.5) (2.8) (3.2) (3.4) (2.9) (2.1) (3.1) (4.6) (2.5) (5.0) (2.3) (4.0) (2.8) (2.2) (3.0) (5.4) (2.6) (4.1) (5.4) (4.1) (5.1) (2.6) (2.8) (1.9) (4.4) (2.3) (3.9) (3.9) (3.1) (2.2) (3.3) (3.7) (3.7) (2.4) (2.4)
53 (3.3) 60 (4.4) 40 (1.8) 61 (5.1) 65 (3.2) 65 (2.1) 73 (2.7) 50 (3.2) 50 (3.9) 74 (3.7) 62 (1.7) 77 (3.3) 54 (3.6) 53 (2.8) 64 (3.5) 59 (4.3) 56 (4.3) 42 (5.3) 48 (3.5) 32 (2.5) 54 (2.6) 61 (3.3) 58 (3.0) 71 (5.2) 67 (4.5) 62 (4.9) 37 (2.9) 68 (6.1) 75 (3.3) 55 (4.1) 78 (2.6) 56 (4.8) 53 (3.2) 60 (3.3) 54 (4.1) 69 (4.8) 36 (5.4) 50 (4.5) 56 (4.9) 92 (4.5) 47 (3.2) 67 (2.9) 44 (4.3) 66 (3.1) 51 (4.7) 52 (4.7) 54 (4.6)
Balancer
62 78 59 76 64 72 60 72 74 63 75 78 71 74 86 56 72 50 63 60 70 60 60 66 57 72 73 75 72 67 70 69 61 54 66 72 56 51 49 74 24 73 77 50 84 67 63
2b
Oregon
(3.2) (3.5) (4.9) (3.7) (4.6) (2.4) (4.3) (3.7) (3.3) (4.6) (4.9) (1.9) (3.8) (3.9) (2.1) (3.5) (3.1) (3.1) (3.0) (3.2) (2.1) (4.2) (3.2) (3.9) (5.7) (2.7) (1.5) (3.7) (1.6) (3.3) (1.2) (4.0) (3.2) (2.9) (3.7) (1.8) (3.8) (3.0) (3.2) (3.3) (2.4) (1.9) (1.9) (4.5) (4.5) (4.1) (1.9)
63 (1.9) 66 (7.4) 60 (6.1) 59 (5.1) 62 (2.5) 59 (3.4) 64 (4.7) 64 (2.7) 55 (3.6) 63 (4.6) 65 (4.3) 69 (4.7) 61 (6.7) 65 (5.5) 75 (4.4) 69 (3.2) 47 (5.1) 56 (2.9) 73 (2.0) 51 (3.3) 90 (2.5) 61 (5.5) 62 (4.0) 70 (3.6) 81 (4.9) 60 (5.5) 66 (4.2) 74 (1.7) 60 (4.6) 90 (2.9) 62 (4.4) 66 (4.4) 58 (4.8) 59 (2.6) 65 (3.3) 72 (3.9) 44 (4.6) 66 (3.5) 48 (3.6) 71 (3.9) 35 (3.2) 61 (4.9) 72 (5.4) 48 (3.1) 71 (6.2) 61 (5.9) 41 (4.2)
Longevity QTL in Drosophila
1145
TABLE A2 P values from F-ratio tests of significance from two-way analysis of variance Males
Females
Deficiency stock
Line
Genotype
Line ⫻ genotype
Line
Genotype
Line ⫻ genotype
Df(2L)Prl Df(2L)fn30 Df(2L)64j Df(2L)fn7 Df(2L)A376 Df(2L)A263 Df(2L)A217 Df(2L)fn5 Df(2L)fn1 Df(2L)A245 Df(2L)TE35BC-8 Df(2L)osp29 Df(2L)TE35BC-34 Df(2L)TE35BC-24 Df(2L)TE35BC-3 Df(2L)TW50 Df(2L)pr-A16 Df(2L)VA12 Df(2L)TW161 Df(2L)DS6 Df(2R)rl10a Df(2R)nap9 Df(2R)cn87e Df(2R)cn9 Df(2R)CA53 Df(2R)44CE Df(3L)ZN47 Df(3L)pbl-X1 Df(3L)66C-G28 Df(3L)h-i22 Df(3L)29A6 Df(3L)AC1 Df(3L)lxd6 Df(3L)vin2 Df(3L)vin5 Df(3L)vin7 Df(3L)Ly Df(3L)fz-GF3b Df(3L)fz-GS1a Df(3L)fz-M21 Df(3L)BK10 Df(3L)brm11 Df(3L)st-f13 Df(3L)st7 Df(3L)81k19 Df(3L)Cat Df(3L)VW3
0.5412 0.1893 0.1533 0.2532 0.6225 0.5957 1.0000 0.4932 0.1588 0.2346 0.0525 0.5450 0.7399 0.0027* 0.4062 0.3935 0.4522 0.2872 0.0068* 0.0011* 0.0077* 0.9686 0.7391 0.0178* 0.0186* 0.8176 0.5446 0.0325* 0.0032* 0.0037* 0.0285* 0.5213 0.9421 0.9660 0.1561 0.2642 0.7276 0.3216 0.0012* 0.0230* 0.2542 0.6661 0.6207 0.5805 0.0628 0.0305* 0.0999
0.0687 0.5079 0.0016 0.0995 0.4972 0.4056 0.4698 0.1514 0.0557 0.0421 0.0855 0.7477 0.0274 0.2720 0.0896 0.1618 0.3894 0.9661 0.0001 0.0024 0.4285 0.3845 0.0213 0.5239 0.8939 0.0041 0.0423 0.1724 0.2184 0.6935 0.4900 0.2489 0.0121 0.7837 0.0416 0.1220 0.4649 0.8404 0.0253 0.1523 0.0001 1.0000 0.1775 0.3729 0.1620 0.6338 0.1087
0.2157 0.4761 0.9763 0.9296 0.2892 0.8161 0.3767 0.5574 0.0647 0.1397 0.0049* 0.3574 0.1938 0.0839 0.1133 0.0685 0.2376 0.2273 0.0009* 0.1551 0.7995 0.8442 0.3224 0.0388* 0.6865 0.0461* 0.0645 0.3049 0.3361 0.2761 0.6406 0.3304 0.1166 0.3911 0.1328 0.9134 0.8985 0.1954 0.4129 0.8615 0.7442 0.9955 0.8223 0.8660 0.1346 0.4527 0.2155
0.2688 0.1926 0.7834 0.1201 0.8747 0.0503* 0.1704 0.0021* 0.0236* 0.8605 0.8987 0.9041 0.0507* 0.2437 0.2737 0.0114* 0.2748 0.8652 0.0870 0.0011* 0.0004* 0.7177 0.2805 0.5343 0.1210 0.1124 0.0086* 0.3267 0.0584 0.1228 0.5759 0.5286 0.3531 0.5926 0.4602 0.8345 0.0110* 0.3536 0.7802 0.0348* 0.6890 0.0962 0.3287 0.6578 0.0090* 0.2201 0.0008*
0.0012 0.0677 0.0085 0.2679 0.9601 0.9384 0.2263 0.0086 0.1202 0.0233 0.0079 0.7291 0.1635 0.0113 0.0003 0.0379 0.1238 0.0554 0.0002 0.0423 0.0001 0.8987 0.1056 0.7236 0.4375 0.9296 0.0013 0.1096 0.0134 0.0026 0.1235 0.0805 0.5695 0.4999 0.1925 0.7151 0.2410 0.2616 0.1476 0.0399 0.0001 0.6172 0.0002 0.0050 0.0313 0.3622 0.0396
0.3914 0.4332 0.9309 0.2028 0.5840 0.1182 0.5140 0.1534 0.4848 0.7646 0.0405* 0.0240* 0.8078 0.5646 0.0993 0.9776 0.0011* 0.0062* 0.5812 0.0349* 0.0771 0.9064 0.4571 0.9997 0.1602 0.7745 0.0888 0.2578 0.4167 0.0325* 0.0184* 0.7675 0.7435 0.5704 0.5667 0.7940 0.4322 0.0582 0.9429 0.0134* 0.0128* 0.2947 0.9890 0.8241 0.3329 0.6342 0.9894
*P ⱕ 0.05.
a
51 59 57 51 74 71 57 61 54 40
NC1 NC6 NC7 NC9 NC11 NC16 NC24 NC27 NC30 NC33
63 64 45 61 75 76 72 73 62 70
(2.8) (2.7) (3.9) (2.1) (2.8) (2.4) (4.0) (2.2) (3.6) (3.6)
Df
Symbols in Figures 1–3.
(1.4) (3.4) (3.7) (3.4) (2.3) (2.8) (4.6) (2.1) (3.0) (2.9)
Pure line
NC line 64 75 61 57 73 74 77 68 62 62
(3.1) (3.9) (6.6) (2.4) (4.2) (3.5) (2.4) (2.2) (2.5) (3.6)
Bal
Line ⫻ Df(2L)A217 [e]a
57 61 56 74 69 79 66 80 67 62
(3.5) (2.4) (5.6) (2.2) (3.1) (1.6) (2.9) (2.2) (2.3) (2.0)
Df 62 66 59 54 71 78 60 64 66 72
(3.2) (1.8) (3.7) (3.4) (4.7) (3.9) (5.3) (3.3) (2.4) (2.2)
Bal
Line ⫻ Df(2L)fn5 [g]a
Males
48 59 56 47 40 50 66 66 61 58
(3.9) (3.5) (2.3) (1.8) (3.3) (3.4) (4.2) (3.8) (2.4) (1.5)
Df 49 71 68 52 70 74 73 77 61 77
(3.7) (3.1) (3.5) (2.4) (3.0) (3.3) (3.6) (1.9) (2.4) (2.6)
Bal
Line ⫻ Df(2L)fn1 [h]a
52 53 61 60 67 76 65 64 60 50
(2.4) (3.8) (2.7) (2.3) (4.0) (1.9) (3.4) (3.4) (3.6) (0.3)
Pure line 82 79 79 80 78 79 74 74 68 69
(1.8) (4.4) (1.7) (0.9) (2.3) (2.1) (2.0) (2.1) (3.4) (1.9)
Df 80 86 85 68 78 81 71 69 71 69
(2.0) (3.0) (3.6) (2.6) (3.5) (2.8) (4.0) (3.0) (3.1) (3.1)
Bal
Line ⫻ Df(2L)A217 [e]a
Mean longevity (⫾ standard error) in crosses with NC lines
TABLE A3
80 48 67 66 79 77 68 72 78 69
(2.3) (2.0) (3.8) (3.1) (1.5) (2.3) (2.5) (2.8) (2.3) (3.0)
Df
83 82 70 92 90 101 82 83 79 69
(2.5) (3.6) (4.4) (2.7) (3.2) (3.0) (6.5) (3.9) (4.4) (3.4)
Bal
Line ⫻ Df(2L)fn5 [g]a
Females
58 67 67 59 62 62 69 70 64 60
(3.1) (2.8) (3.9) (2.1) (3.5) (2.4) (3.1) (2.9) (4.8) (2.1)
Df 83 77 92 85 85 91 84 77 80 80
(3.0) (2.9) (1.8) (1.7) (1.7) (2.3) (3.0) (4.2) (4.3) (3.5)
Bal
Line ⫻ Df(2L)fn1 [h]a
1146 E. G. Pasyukova, C. Vieira and T. F. C. Mackay