International Energy Agency, EBC Annex 66
Definition and Simulation of Occupant Behavior in Buildings Annex 66 Final Report May 2018
Da Yan and Tianzhen Hong Operating Agents of Annex 66 ISBN 978-0-9996964-7-7
EBC is a programme of the International Energy Agency (IEA)
International Energy Agency, EBC Annex 66
Definition and Simulation of Occupant Behavior in Buildings Annex 66 Final Report May 2018
Edited by Da Yan, PhD School of Architecture Tsinghua University, China
[email protected] Tianzhen Hong, PhD Building Technology and Urban Systems Division Lawrence Berkeley National Laboratory, USA
[email protected]
EBC is a programme of the International Energy Agency (IEA)
© Copyright The Regents of the University of California (through Lawrence Berkeley National Laboratory), subject to receipt of any required approvals from United States Department of Energy, and Tsinghua University, China, 2018. All property rights, including copyright, are vested in The Regents of the University of California (through Lawrence Berkeley National Laboratory), subject to receipt of any required approvals from United States Department of Energy, and Tsinghua University, China, Operating Agents for EBC Annex 66, on behalf of the Contracting Parties of the International Energy Agency Implementing Agreement for a Programme of Research and Development on Energy in Buildings and Communities. Published by The Regents of the University of California (through Lawrence Berkeley National Laboratory) and Tsinghua University, China. Disclaimer Notice: This publication has been compiled with reasonable skill and care. However, neither The Regents of the University of California (through Lawrence Berkeley National Laboratory) and Tsinghua University, China, nor the Contracting Parties of the International Energy Agency Implementing Agreement for a Programme of Research and Development on Energy in Buildings and Communities make any representation as to the adequacy or accuracy of the information contained herein, or as to its suitability for any particular application, and accept no responsibility or liability arising out of the use of this publication. The information contained herein does not supersede the requirements given in any national codes, regulations or standards, and should not be regarded as a substitute for the need to obtain specific professional advice for any particular application. ISBN 978-0-9996964-7-7 Participating countries in EBC: Australia, Austria, Belgium, Canada, P.R. China, Czech Republic, Denmark, France, Germany, Ireland, Italy, Japan, Republic of Korea, the Netherlands, New Zealand, Norway, Portugal, Singapore, Spain, Sweden, Switzerland, United Kingdom and the United States of America. Additional copies of this report may be obtained from: EBC Bookshop C/o AECOM Ltd The Colmore Building Colmore Circus Queensway Birmingham B4 6AT United Kingdom Web: www.iea-ebc.org Email:
[email protected]
Preface The International Energy Agency The International Energy Agency, the global energy authority, was founded in 1974 to help its member countries co-ordinate a collective response to major oil supply disruptions. Its mission has evolved and rests today on three main pillars: working to ensure global energy security; expanding energy cooperation and dialogue around the world; and promoting an environmentally sustainable energy future.
The IEA Energy in Buildings and Communities Programme The IEA co-ordinates international energy research and development (R&D) activities through a comprehensive portfolio of Technology Collaboration Programmes. The mission of the Energy in Buildings and Communities (EBC) Programme is to develop and facilitate the integration of technologies and processes for energy efficiency and conservation into healthy, low emission, and sustainable buildings and communities, through innovation and research. (Until March 2013, the IEA-EBC Programme was known as the Energy in Buildings and Community Systems Programme, ECBCS.) The R&D strategies of the IEA-EBC Programme are derived from research drivers, national programmes within IEA countries, and the IEA Future Buildings Forum Think Tank Workshops. These strategies aim to exploit technological opportunities to save energy in the buildings sector, and to remove technical obstacles to the market penetration of new energy-efficient technologies. The R&D strategies apply to residential, commercial, and office buildings as well as community systems, and will impact the building industry in five focus areas for R&D activities: – Integrated planning and building design – Building energy systems – Building envelope – Community scale methods – Real building energy use
The Executive Committee Overall control of the IEA-EBC Programme is maintained by an Executive Committee, which not only monitors existing projects, but also identifies new strategic areas in which collaborative efforts may be beneficial. The ExCo has 24 member countries. All member countries have the right to propose new projects, and each country then decides whether or not to participate on a case by case basis. Most projects are carried out on a 'task shared' basis, in which participating organisations arrange for their own experts to take part. Certain projects are 'cost shared' in which participants contribute funding to achieve common objectives. As the Programme is based on an Implementing Agreement contract with the IEA, the projects are legally established as Annexes to the IEA-EBC Implementing Agreement. At the present time, the following projects have been initiated by the Programme (completed projects are identified by an asterisk, *): Annex 1: Annex 2: Annex 3: Annex 4: Annex 5: Annex 6: Annex 7: Annex 8: Annex 9: Annex 10: Annex 11: Annex 12: Annex 13: Annex 14: Annex 15: Annex 16: Annex 17:
Load Energy Determination of Buildings (*) Ekistics and Advanced Community Energy Systems (*) Energy Conservation in Residential Buildings (*) Glasgow Commercial Building Monitoring (*) Air Infiltration and Ventilation Centre Energy Systems and Design of Communities (*) Local Government Energy Planning (*) Inhabitants Behavior with Regard to Ventilation (*) Minimum Ventilation Rates (*) Building HVAC System Simulation (*) Energy Auditing (*) Windows and Fenestration (*) Energy Management in Hospitals (*) Condensation and Energy (*) Energy Efficiency in Schools (*) BEMS 1- User Interfaces and System Integration (*) BEMS 2- Evaluation and Emulation Techniques (*)
i
Annex 18: Annex 19: Annex 20: Annex 21: Annex 22: Annex 23: Annex 24: Annex 25: Annex 26: Annex 27: Annex 28: Annex 29: Annex 30: Annex 31: Annex 32: Annex 33: Annex 34: Annex 35: Annex 36: Annex 37: Annex 38: Annex 39: Annex 40: Annex 41: Annex 42: Annex 43: Annex 44: Annex 45: Annex 46: Annex 47: Annex 48: Annex 49: Annex 50: Annex 51: Annex 52: Annex 53: Annex 54: Annex 55: Annex 56: Annex 57: Annex 58: Annex 59: Annex 60: Annex 61: Annex 62: Annex 63: Annex 64: Annex 65: Annex 66: Annex 67: Annex 68: Annex 69: Annex 70: Annex 71:
Demand Controlled Ventilation Systems (*) Low Slope Roof Systems (*) Air Flow Patterns within Buildings (*) Thermal Modeling (*) Energy-Efficient Communities (*) Multi Zone Air Flow Modeling (COMIS) (*) Heat, Air and Moisture Transfer in Envelopes (*) Real-time HVAC Simulation (*) Energy-Efficient Ventilation of Large Enclosures (*) Evaluation and Demonstration of Domestic Ventilation Systems (*) Low-Energy Cooling Systems (*) Daylight in Buildings (*) Bringing Simulation to Application (*) Energy-Related Environmental Impact of Buildings (*) Integral Building Envelope Performance Assessment (*) Advanced Local Energy Planning (*) Computer-Aided Evaluation of HVAC System Performance (*) Design of Energy-Efficient Hybrid Ventilation (HYBVENT) (*) Retrofitting of Educational Buildings (*) Low Exergy Systems for Heating and Cooling of Buildings (LowEx) (*) Solar Sustainable Housing (*) High-Performance Insulation Systems (*) Building Commissioning to Improve Energy Performance (*) Whole Building Heat, Air and Moisture Response (MOIST-ENG) (*) The Simulation of Building-Integrated Fuel Cell and Other Cogeneration Systems (FC+COGEN-SIM) (*) Testing and Validation of Building Energy Simulation Tools (*) Integrating Environmentally Responsive Elements in Buildings (*) Energy-Efficient Electric Lighting for Buildings (*) Holistic Assessment Toolkit on Energy-Efficient Retrofit Measures for Government Buildings (EnERGo) (*) Cost-Effective Commissioning for Existing and Low-Energy Buildings (*) Heat Pumping and Reversible Air Conditioning (*) Low-Exergy Systems for High-Performance Buildings and Communities (*) Prefabricated Systems for Low-Energy Renovation of Residential Buildings (*) Energy-Efficient Communities (*) Towards Net Zero Energy Solar Buildings (*) Total Energy Use in Buildings: Analysis & Evaluation Methods (*) Integration of Micro-Generation & Related Energy Technologies in Buildings (*) Reliability of Energy-Efficient Building Retrofitting - Probability Assessment of Performance & Cost (RAPRETRO) (*) Cost-Effective Energy & CO2 Emissions Optimization in Building Renovation (*) Evaluation of Embodied Energy & CO2 Equivalent Emissions for Building Construction (*) Reliable Building Energy Performance Characterization Based on Full Scale Dynamic Measurements (*) High Temperature Cooling & Low Temperature Heating in Buildings (*) New Generation Computational Tools for Building & Community Energy Systems (*) Business and Technical Concepts for Deep Energy Retrofit of Public Buildings (*) Ventilative Cooling Implementation of Energy Strategies in Communities LowEx Communities - Optimized Performance of Energy Supply Systems with Exergy Principles Long-Term Performance of Super-Insulating Materials in Building Components and Systems Definition and Simulation of Occupant Behavior in Buildings Energy Flexible Buildings Indoor Air Quality Design and Control in Low-Energy Residential Buildings Strategy and Practice of Adaptive Thermal Comfort in Low-Energy Buildings Energy Epidemiology: Analysis of Real Building Energy Use at Scale Building Energy Performance Assessment Based on In-situ Measurements
Working Group - Energy Efficiency in Educational Buildings (*) Working Group - Indicators of Energy Efficiency in Cold Climate Buildings (*) Working Group - Annex 36 Extension: The Energy Concept Adviser (*) Working Group - Survey on HVAC Energy Calculation Methodologies for Non-residential Buildings
ii
Executive Summary Energy-related occupant behavior in buildings is a key issue for building design optimization, energy diagnosis, performance evaluation, and building energy simulation. Occupant actions such as adjusting a thermostat for comfort, switching lights on/off, using appliances, opening/closing windows, pulling window blinds up/down, and moving between spaces can have a significant impact on the real energy use and occupant comfort in buildings. Having a deeper understanding of occupant behavior and improving capability to quantify its impact on the use of building technologies and building performance with modeling and simulation tools are crucial to the design and operation of low-energy buildings, where human–building interactions are key aspects of concern. However, the influence of occupant behavior is under-recognized or over-simplified in the design, construction, operation, and retrofit of buildings. Occupant behavior is complex and requires an interdisciplinary approach to be fully understood. On the one hand, occupant behavior is influenced by external factors such as culture, economy, and climate, as well as internal factors such as individual comfort preference, physiology, and psychology. On the other hand, occupants’ interactions with building systems, strongly influence building operations and thus energy use/cost and indoor comfort; this in turn influences occupant behavior, thus forming a closed loop. Over 20 groups around the world are separately studying occupant behavior in this context. However, existing studies on occupant behavior, mainly from the perspective of sociology, lack in-depth quantitative analysis. Furthermore, models describing the occupant behavior developed by different researchers are often inconsistent, lacking consensus with regard to a common way of expressing experimental design, and modeling methodologies. Therefore, there is a strong need for researchers to work together on a consistent and standard framework of occupant behavior definition and simulation methodology. The IEA EBC Annex 66: Definition and simulation of occupant behavior in buildings is an international collaborative project involving more than 100 researchers from 20 countries working together from November 2013 to May 2018. The main objective of Annex 66 is to address the following fundamental research question: How can we develop and apply a robust and standardized quantitative description and computational models of energy-related occupant behavior in buildings to analyze and evaluate the impact of occupant behavior on building energy use and occupant comfort via building performance simulation? Annex 66 covers four key components that contribute towards answering the above question: 1. Identify quantitative descriptions and classifications of occupant behavior; 2. Develop methods for occupant behavior measurement, modeling, evaluation and application; 3. Implement occupant behavior models in building performance simulation tools; and 4. Demonstrate application of occupant behavior models in design, evaluation and operational optimization using case studies.
iii
The major product of Annex 66 is a scientific methodological framework to guide occupant behavior simulation research on data collection, modeling and evaluation, modeling tools development and integration, application, and interdisciplinary issues. The main outcomes of Annex 66 include five technical reports, three occupant behavior modeling tools, and 103 journal articles. The key research findings are as follows: 1. Occupant behavior has significant impacts on energy use and occupant comfort. Data, methods, and models were developed and applied to understand and reduce the gap between simulated and measured building energy performance by representing occupant behavior in a standardized ontology and XML schema (obXML) and developing an occupant behavior software module (obFMU). 2. Data collection is fundamental for occupant behavior modeling. Methods of collecting data are evolving with the rapid development of sensors and Information and Communication Technologies (ICT). Most data collection campaigns are conducted in a typical working or living environment rather than a laboratory. Technology evolution requires researchers to have a good understanding of the available data collection methods and apply them to the most appropriate situation. 3. Choice of occupant behavior simulation models depends on the building context. Studies suggest that stochastic models, to capture spatial, temporal, and individual diversity, do not necessarily always perform better than simplified deterministic models. The development of thermal comfort research and its combination with sociological studies can potentially shed some light on the modeling of occupant behavior. The evaluation of occupant behavior models should have explicit metrics that come from the application scenarios to quantify their performance. New approaches that adopt statistics for the evaluation of model accuracy are under development. 4. Occupant behavior models are integrating with building performance simulation programs. obXML and obFMU modules have been integrated with building performance simulation programs EnergyPlus, ESP-r and DeST. However, user-friendly interfaces need to be further developed to enable occupant behavior simulation for practical applications. 5. The representation of occupant behavior diversity in simulation programs is critical. Behavior patterns differ among individuals, and this diversity is perplexing for researchers and engineers tasked with identifying the behavior patterns and corresponding parameters in simulations involving occupants. Efforts have been made in Annex 66 to address occupant behavior diversity with different approaches, such as case measurements and questionnaire surveys.
iv
6.
Occupant behavior models veil the technical details and provide engineers with a friendly interface. A collection of case studies (a separate technical report) were compiled to showcase the applications of occupant behavior sensing, data collection, modeling, simulation, and analysis in the building life cycle. A guidebook needs to be developed that details the appropriate situations in which each occupant behavior model could be applied would help simulation users and prevent the use of models in scenarios completely different from those for which they were developed.
7.
Policy makers could benefit from occupant behavior modeling. This can facilitate the development of effective policies to reduce energy consumption in buildings. The sociological and psychological aspects of occupants should be studied concerning the evolution of occupant behavior when policy levers (regulation, information or incentive) are used by policy makers.
8. Interdisciplinary research across the building, social, behavioral, data and computer sciences can help to understand, represent, model and quantity the impact of human behavior on building energy use, occupant comfort and health. Annex 66 established an interdisciplinary research framework and developed an interdisciplinary cross-country survey on occupant energy-related behavior in buildings, which provides valuable insights into occupant behavior and the basis of occupant behavior modeling and simulation. The beneficiaries of the results and deliverables provided in Annex 66 are building energy modelers, energy software developers, energy consulting companies, building designers and engineers, policy makers, and designers of energy saving technology. The outcomes of the Annex contribute to a deeper understanding and integration of the human dimension in the building lifecycle to reduce energy use and carbon emissions and improve occupant comfort and productivity.
v
Acknowledgments This research was supported by the Assistant Secretary for Energy Efficiency and Renewable Energy, Office of Building Technologies of the United States Department of Energy, under Contract No. DEAC02-05CH11231. This research was supported by National Natural Science Foundation of China (Grant #51778321): Research on the quantitative description and simulation methodology of occupant behavior in buildings. It was also supported in part by the Innovative Research Groups of the National Natural Science Foundation of China (Grant #51521005). The Operating Agents of Annex 66 appreciate the strong leadership and significant technical contributions of the subtask leaders, and thank all the participants for their contributions to Annex 66. Special thanks go to the Executive Committee of IEA EBC for the strong support during the four-year period of Annex 66. Last but not least, many reviewers have provided detailed and constructive comments, which have helped the authors to arrive at the finalized version. Special thanks to four reviewers of the final report: Brian Dean of IEA, Michael Donn of New Zealand, Conny Rolen of Sweden, and Jack Mayernik of USA.
vi
Table of Contents Preface
i
Executive Summary
iii
Acknowledgments
vi
Table of Contents
vii
Abbreviations
xi
Glossary 1.
Introduction
xiii 1
1.1.
Background
1
1.2.
Objectives
4
1.3.
General technical approach and scope of work
4
1.4.
Time schedule
5
2.
Framework
6
2.1.
Overall technical framework
6
2.2.
Technical subtasks
7
2.3.
Organization of the final report
8
3.
Participation in Annex 66
9
3.1.
Operating agents
9
3.2.
Subtask leaders
9
3.3.
National participation
9
3.4.
Communication and meetings
4. 4.1.
Approaches for Collecting Occupant Data Experimental approach
10 11 11
vii
4.2.
Sensing and data acquisition technologies
16
4.3.
Data collection protocol
21
4.4.
Data management
27
4.5.
Occupant data collection summary
30
5.
Modeling Occupant Behavior
32
5.1.
Modeling approaches
32
5.2.
Model selection
37
5.3.
Occupancy models
39
5.4.
Window opening models
40
5.5.
Window shading adjustment models
42
5.6.
Light switching models
43
5.7.
Thermostat adjustment models
44
5.8.
Appliance use models
46
5.9.
Modeling the diversity of occupants
47
5.10.
Occupant behavior modeling summary
49
6.
Evaluation of Models
52
6.1.
Model evaluation background
52
6.2.
General principles concerning model evaluation
53
6.3.
Deployment dependence of model evaluation
56
6.4.
Evaluation statistics
57
6.5.
Addressing model feedback in evaluation process
59
6.6.
Case study: evaluation of window operation models
61
6.7.
Model evaluation conclusions
68
viii
7.
Occupant Behavior Modeling Tools and Integration with Building Performance Simulation
Programs
70
7.1.
Background on occupant behavior modeling in BPS programs
70
7.2.
Occupant behavior modeling tools
73
7.3.
Integration of occupant behavior modeling tools with BPS programs
75
7.4.
Case studies testing obFMU in BPS programs
80
7.5.
Occupant behavior model integration case study conclusions
85
8.
Applications of Occupant Behavior Modeling
8.1.
86
Framework for determining the impact of occupant behavior on building energy
performance
87
8.2.
How to support decision making in different building project phases
91
8.3.
Supporting decision-making through modeling and simulation
97
8.4.
Occupant behavior modeling conclusions and future needs
9.
Interdisciplinary Approaches to Studying Occupant Behavior
103 106
9.1.
Needs and Approaches for Interdisciplinary Theories of Human Behavior
106
9.2.
Case studies of occupant behavior using interdisciplinary approaches
110
9.3.
Interdisciplinary cross-country research methodology
116
9.4.
Outcomes from the interdisciplinary research
117
9.5.
Challenges faced by interdisciplinary studies of occupant behavior
122
9.6.
Interdisciplinary studies conclusions and future work
123
10.
Summary and Conclusions
126
10.1.
Key findings
126
10.2.
Main outcomes
128
10.3.
Future research
129
ix
11.
List of Authors
130
12.
Publicity
131
13.
References
132
Appendices
143
Appendix A: Publicity
143
Appendix B: Participants
151
x
Abbreviations List of abbreviations A-B-C ACF AIC AMQP API AR ARIMA ARMA BAS BIC BN BPS DAG DNAS EPBD EQ FMI FMU GLM GLMMs GLMs HGLMs HMM HVAC IEQ I/O ISD JMS LBNL LIH LMMs MA MLE MOM MOST MTG NAM NZEB OB OBB oBIX OPCUA PBC PIR PIS PMV POE Ref
Attitude Behavior Context Model Autocorrelation Function Akaike’s Information Criterion Advanced Message Queuing Protocol Application Programming Interface Autoregressive Autoregressive Integrated Moving Average Model Autoregressive Moving Average Building Automation System Bayesian Information Criterion Bayesian Network Model Building Performance Simulation Directed Acyclic Graph Drivers Needs Actions Systems Energy Performance of Buildings Directive Equipment Functional Mock-up Interface Functional Mockup Unit General Linear Model generalized linear mixed effects models Generalized linear models Hierarchical Generalized Linear Models Hidden Markov Model Heating, Ventilation, and Air Conditioning Indoor Environmental Quality Input/Output Integral Sustainable Design Java Message Service Lawrence Berkeley National Laboratory Low-Income Household Linear Mixed effects Models Moving Average Maximum Likelihood Estimation Message Oriented Middleware Monitoring System Toolkit ASHRAE Multidisciplinary Task Group Norm Activation Model Nearly zero energy building or nearly zero emissions building Occupant Behavior Occupant Behavior in Buildings Open Building Information Exchange OPC Unified Architecture Perceived Behavioral Control Passive Infra-Red Participant Information Sheet Predicted mean vote Post-Occupancy Evaluation Reference
xi
SCT SETA STA STB STC STD STE TAM TP TPB TVOC VBN VRV
Social Cognitive Theory Sustainable Energy Technology Acceptance Model Annex 66 Subtask A Annex 66 Subtask B Annex 66 Subtask C Annex 66 Subtask D Annex 66 Subtask E Technology Acceptance Model Theory of Practice Theory of Planned Behavior Total Volatile Organic Compound Value-Belief Norm Theory Variable Refrigerant Volume
xii
Glossary Accuracy
Degree to which the result of a simulation conforms to the measurement value
Actual Meteorological Year (AMY) Advanced Message Queuing Protocol (AMQP) Application program interface (API)
Dataset consisting of twelve consecutive months of data that are not necessarily typical
Autocorrelation
Correlation of a signal with a delayed copy of itself as a function of delay.
Autoregressive– moving-average model Bias Building Automation and Controls network Building automation system Building information modeling (BIM) Cross-validation Data mining Digital Addressable Lighting Interface bus system Digital Subscriber Line Embedded database Ground truth
Application layer protocol for message-oriented middleware Set of functions, code, and clearly defined methods that facilitate direct interfacing with computer software Model to provide a parsimonious description of a stationary stochastic process in terms of two polynomials, one for the auto-regression and the second for the moving average. Form of systematic error whereby repeated measurements do not obtain the true value of the measurand Common, open-source, manufacturer-independent building automation system (BAS) communication protocol that allows hardware systems to communicate with each other Hardware and software systems responsible for controlling—and often collecting data on—space heating, cooling, ventilation, lighting, access, and fire detection equipment Process and system for digitally representing the functional and physical characteristics of a building in three or more dimensions Model validation technique for assessing how the results of a statistical analysis will generalize to an independent data set. Technique for using software to systematically explore data to seek patterns and other useful information Building automation protocol for controlling devices for lighting Family of technologies enabling the transmission of digital data over telephone lines Database management system within an application software that requires access to the stored data Data obtained by directly observing the phenomenon of interest, as opposed to data collected by sensors or otherwise inferred
InnoDB
Storage engine for MySQL. See also MySQL.
Logistic regression
Regression model where the dependent variable (DV) is categorical.
Maximum likelihood estimation
Method of estimating the parameters of a statistical model, given observations.
Mixed sensing Multiphase design
Combination of multi-infrared, image-based, and acoustic sensors to measure occupant position, action, orientation, etc. Mixed methods research approach that involves a combination of sequential and concurrent elements, and often includes three or more phases
MySQL
Open-source relational database management system
NewSQL
modern relational database management systems that seek to provide the same scalable performance of NoSQL systems for online transaction processing
Non-intrusive load monitoring
Method to distinguish individual loads from an aggregated load dataset
xiii
NoSQL Occupancy (occupant presence) p-value Passive infrared motion sensor R2 value Temporal attribute Test bed
Database to provide a mechanism for storage and retrieval of data that is modeled in means other than the tabular relations used in relational databases Boolean value of the state of an occupant being in a space; it could also refer to the number of occupants in a space Probability of obtaining a result equal to or more extreme than that which was actually observed when the null hypothesis is true Sensor that detects infrared radiation from objects in its view field, often for the purpose of detecting occupants Proportion of the variance in the dependent variable that is predictable from the independent variable(s) Time-related aspect (or extension) of a variable’s value, which can include time stamps and sampling interval entries Comprehensive array of sensors and other monitoring equipment that is deployed in a laboratory or real building environment
Trueness
Closeness between measured data and true results
Type 1 error
Error of concluding something is true when it is not
Type 2 error
Error of concluding that something is not true when it is true
Volatile organic compound
Organic chemicals that have a high vapor pressure at ordinary room temperature.
xiv
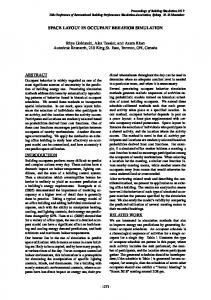
1. Introduction 1.1. Background The international public concern over the rapid and continual increase in building energy use is growing. Globally, in 2010, the buildings sector accounted for more than one-fifth of total worldwide consumption of delivered energy, with an increasing projection rate among all sectors (USEIA 2014). Presently, 73% of electricity and 55% of natural gas in the United States is consumed in buildings (USEIA 2014), with other countries encountering similar consumption challenges. Figure 1-1 (BERC 2016) shows large variations in the building energy consumption per capita and per floor area in different countries in 2012 (except for China in 2014). Many of the advanced technology users in developed countries consume more energy than developing countries, which lack widespread technology use. Having a clearer understanding of the underlying constituents that drive energy consumption will aid the development of effective efficiency strategies and enhance the ability to achieve prime economic and environmental targets (Jain et al. 2013, Pisello et al. 2014). Figure 1-2 shows the energy consumption in buildings, broken down by end-use, for six different countries in different years (Yoshino et al. 2017). In the figure, the number after countries means different buildings in the case study. The proportions of each end-use are quite different because of the different operating modes of the systems and appliances. In fact, researchers have indicated that building energy consumption is influenced by engineering technology, cultural background, occupant behavior, social equity and so on, with each component contributing towards the total consumption (Hitchcock 1993, Mahdavi et al. 2007). Evidence suggests that occupant behavior plays a defining role in influencing the total consumption (Mahdavi et al. 2007).
Figure 1-1: Building energy consumption in equivalent carbon emissions per capita per year in different countries (2012) 1
Country-Year
NOR-02 JPN-03 Lighting
JPN-02
Office appliances
JPN-01
IT room
FRA-01
Ventilation
CHN-04
Pumps Chiller or indoor unit
CHN-03
Cooling tower or outdoor unit
CHN-02
Catering
CHN-01
Miscellaneous
BEL-01 kWhe/(m2.a)
AUS-01 0
50
100
150
200
Energy consumption by end use (kWh/m2)
Figure 1-2: Building energy consumption by end use in six countries from IEA EBC Annex 53 The primary drivers behind energy-related occupant behavior include the occupants’ desire to achieve comfort or satisfaction within their environment (Peng et al., 2012, Hu et al., 2017). For example, an occupant may adjust the thermostat, open the window, or turn on the lights to enhance their comfort. As a result, occupant behavior greatly influences the operating mode of the equipment and, in turn, the energy consumption. Previous research has demonstrated that similar spaces, with identical enclosures and equipment stock, can have vastly different energy consumption profiles. For example, data from split-type air-conditioners in 25 nearly identical households located in a middle-income apartment building in Beijing, China, showed that the measured AC electricity consumption ranged from ~0–14 kWh/m2, with an average of 2.3 kWh/m2 (Li et al. 2014). The large variance in energy consumption was primarily due to the operating mode; occupants who elected to run their air-conditioners for longer durations, at lower setpoints, and/or throughout a larger space consumed more energy than occupants who behaved oppositely (Socolow 1978, Li et al. 2014). Consequently, energy reduction methods must encompass a combination of technological development, building physics, and occupant behavior to achieve the desired performance (Pisello et al. 2014). Technical solutions need to be customized to occupant behaviors, and it is notable that these solutions may affect or change occupant behavior. Ultimately, a degree of harmony between equipment function, occupant health/comfort, and energy performance needs to be realized. Results from a previous simulation study that investigated the integration of different occupant lifestyles with different levels of technological upgrades suggested a 36% reduction in energy consumption could be achieved by a technology upgrade and a reduction of roughly 80% could be brought about by lifestyle changes (BERC 2013). Similarly, the impact of occupant behavior on equipment operation and energy performance was evaluated by comparing a controllable Variable Refrigerant Volume (VRV) with a non-controllable Fan Coil Unit + Dedicated Outdoor Air (FCU+OA) system. The results suggest the FCU+OA system, which has a higher standard rated coefficient of performance than the VRV system, 2
consumes considerably more energy (Zhou et al. 2013). The flexibility of the VRV system provides users with more authority to control and adjust the room conditions, allowing for more efficient usage. Disproportionate attention has been directed towards system or technological efficiency improvements, while ignoring the human dimension. As a result, the cognition of influences on occupant behavior is insufficient both in building systems design and in energy retrofitting. This limited understanding of occupant behavior results in inappropriate, overly simplified assumptions that lead to inaccurate expectations of building energy performance and large discrepancies in building design optimization, energy diagnosis, and building energy simulations. Figure 1-3 shows how occupant behavior influences building operation, which will inherently affect energy use and cost. This process triggers a short-term effect on occupant behavior through psychological, physiological, and economic factors as well as some long-term factors such as comfort, culture, and the economic situation. Therefore, occupant behavior and building performance are highly coupled, with multiple feedback loops, making consistency challenging. Moreover, observations of occupant behavior often lack common principles from the viewpoints of sociology and psychology, and suffer from drawbacks related to privacy limitations and other non-technical issues.
Figure 1-3: Schematic describing the relationship between occupants and buildings The aim of Annex 66 was to address these challenges by focusing on accurately capturing and quantifying the impacts that occupant behavior has on building energy performance. (Yan et al., 2017) The broader aim was to identify and eliminate current inconsistencies in building energy simulation. Notably, the physiology, psychology, and general principles, ranging from ideology to behavioral aspects, was not the primary focus. The effect of these factors contributed to the divergence among occupant behavior models. Additionally, one of the priorities of Annex 66 was to foster international collaboration in establishing a robust, universal, research framework. The following four key areas have been addressed: (1) experimental design and data collection, (2) model development and evaluation, (3) modeling tools and integration with building performance simulation (BPS) programs, and (4) knowledge exchange and sharing. Inherently, the development and validation of a universally consistent and common research language can help provide consistency across research fields. Annex 3
66 tackled the above challenges by supposing that the framework could be universally adopted, that models were integrated into a coherent whole, and efforts were channeled where most needed. A robust occupant behavior research framework can foster innovation and drive broad, sustained growth towards the achievement of energy targets.
1.2. Objectives The objective of Annex 66 was to address the following fundamental research question: How can we develop and apply a robust and standardized quantitative description and computational models of energy-related occupant behavior in buildings to analyze and evaluate the impact of occupant behavior on building energy use and occupant comfort via building performance simulation? In this view, the primary focus of Annex 66 was categorized into four key components that contribute towards answering the above research question: 1. Identify quantitative descriptions and classifications of occupant behavior; 2. Develop methods for occupant behavior measurement, modeling, evaluation and application; 3. Implement occupant behavior models with building performance simulation tools; and 4. Demonstrate application of occupant behavior models in design, evaluation and operational optimization using case studies.
1.3. General technical approach and scope of work The scope of Annex 66 was to represent, model, simulate and quantify the impact of occupant behavior on building energy performance. The relationship between occupant behavior and the built environment depends considerably on changes in the physical environment. Therefore, the general technical approach uses environmental descriptors as the driving parameters. These descriptors include temperature, relative humidity, CO2 concentration, and illumination, and were monitored and studied to better understand occupants’ behavioral responses. This approach assesses how occupants respond to their physical environment and allows for the ideological, physiological, psychological, and economic aspects of occupant behavior to be treated as a secondary reference. The scope was limited to typical offices, apartments, and single-family homes, with the assessment of the economic factors excluded.
4
1.4. Time schedule The work described in Annex 66 lasted for four and a half years, from November 2013 to May 2018. An International Forum on occupant behavior research was held on August 23, 2013, in Paris to commence the preparation of Annex 66. The Preparation Phase started in November 2013 and lasted for one year, followed by the Working Phase from November 2014 to June 2017. Finally, the Reporting Phase ran from July 2017 to May 2018.
5
2. Framework 2.1. Overall technical framework Annex 66 identified and used several key topics on occupant behavior modeling and simulation (Figure 2-1) to structure the research activities (Figure 2-2).
Figure 2-1: Research topics of Annex 66 Figure 2-2 summarizes the six major research activities, 12 key issues to be addressed, and six main outcomes from Annex 66.
Figure 2-2: Main research activities, key issues to address, and main outcomes
6
2.2. Technical subtasks Figure 2-3 shows the five technical subtasks that were created to provide solutions addressing the Annex objectives. Subtasks A, B, and C focused on fundamental research to represent occupant behavior in buildings. Subtasks D and E focused on practical applications by developing and integrating occupant behavior modeling tools into current BPS programs such as EnergyPlus, DeST, and ESP-r. The efforts of subtasks A–E cultivate solutions to real-world problems related to occupant behavior in the building lifecycle, from planning to design, operation, controls, and retrofitting.
Subtask A Occupant movement and presence
Subtask B Action models in residential buildings
Subtask D
OB modeling tools and integration with simulation programs
Subtask E
Case studies
Subtask C Action models in commercial buildings
Fundamental Research
Practical Applications
Figure 2-3: Subtasks of Annex 66 Subtask A – Occupant movement and presence models. Simulating occupant movement and presence is fundamental to occupant behavior research. The main objective of this subtask was to provide a standard definition and simulation methodology to represent an occupant’s presence and movement between spaces. Subtask B – Occupant action models in residential buildings. Occupant action behavior in residential buildings significantly affects building performance. This subtask aimed to provide a standard description for occupant action and behavior simulations, a systematic measurement approach, and a modeling and validation methodology for residential buildings. Subtask C – Occupant action models in commercial buildings. Occupant behavior modeling in commercial buildings faces specific challenges in which occupant behavior exhibits high spatial and functional diversity. This subtask aimed to provide a standard description for occupant action behavior simulations, a systematic measurement approach, and a modeling and validation methodology for commercial buildings. Subtask D – Development of new occupant behavior definition and modeling tools, and integration with current building performance simulation programs. This subtask aims to enable applications by researchers, practitioners, and policy makers and promote third-party software development and 7
integration. A framework for an XML schema and a software module of occupant behavior models are the main outcomes. Subtask E – Applications in building design and operations. This subtask provides case studies to demonstrate applications of the new occupant behavior modeling tools. The occupant behavior modeling tools can be used by building designers, energy saving evaluators, building operators, and energy policy makers. Case studies verify the applicability of the developed modeling tools by comparing the measured and simulated results.
2.3. Organization of the final report The next chapters deal with the participation (chapter 3), main research activities and outcomes (chapters 4-9), conclusions (chapter 10), publicity, meetings of Annex 66 and references. Figure 2-4 illustrates the report structure.
Figure 2-4: Organization of the final report 8
3. Participation in Annex 66 3.1. Operating agents The operating agents of Annex 66 are Dr. Da Yan (Tsinghua University, China) and Dr. Tianzhen Hong (Lawrence Berkeley National Laboratory, USA).
3.2. Subtask leaders Table 3-1: Annex 66 Subtask Leaders Subtask A B C D E
Subtask Leaders Andreas Wagner, Karlsruhe Institute of Technology, Germany; Bing Dong, University of Texas San Antonio, USA Henrik Madsen, Technical University of Denmark, Denmark; David Shipworth, University College London, UK. Darren Robinson of Nottingham University, UK helped lead early phase of this subtask. Ardeshir Mahdavi, TU Wien, Austria; William O'Brien, Carleton University, Canada Tianzhen Hong, Lawrence Berkeley National Laboratory, USA; Andrew Cowie, University of Strathclyde, UK Khee Poh Lam, Carnegie Mellon University, USA; NUS, Singapore; Clinton Andrews, Rutgers University, USA; Cary Chan, Swire Properties, Hong Kong
3.3. National participation Seventeen nations officially participated in Annex 66: Austria, Australia, Canada, China, Denmark, Germany, Hungary, Italy, Korea, Netherlands, New Zealand, Norway, Poland, Singapore, Spain, UK, and USA (Figure 3-1). The tables in Appendix B list 123 contributors and 54 interested parties of Annex 66.
Figure 3-1: List of participating countries 9
3.4. Communication and meetings There were nine in-person Experts meetings during the four and a half years period of Annex 66, including two regular meetings each year. Details are in Appendix B. Figure 3-2 shows the nine group photos from these meetings.
Figure 3-2: Group photos of the nine Experts meetings
10
4. Approaches for Collecting Occupant Data An essential part of understanding and modeling occupant behavior is the collection of data. Although this sounds self-evident, existing studies and models used for simulation show that no wholly consistent approach had previously been followed to obtain comparable occupant behavior datasets. Therefore, one of the main objectives of Subtask A was to provide substantial information on the monitoring of occupant behavior and data collection. This included state-of-the-art and new emerging sensing and data acquisition technologies, different experimental approaches (in-situ measurements and surveys in real-life buildings (Feng et al., 2016), laboratory experiments)—including consistent protocols—and data management. This chapter summarizes the work, while more detailed information is available in the book ‘Exploring Occupant Behavior in Buildings,’ which was published by Springer in autumn 2017.
4.1. Experimental approach There are various methods of collecting occupant-related data for the purpose of researching building occupants. Three major approaches to monitoring or studying occupants will be briefly introduced: insitu, laboratory, and survey questionnaire (or interview) studies (see Figure 4-1). These approaches have been used in studies cited or directly conducted in the context of Annex 66 work on occupant data collection for modeling. Furthermore, several mixed methods are addressed.
Figure 4-1: Occupant measuring methods. Top-left: in-situ; top-right: laboratory; bottom: survey.
11
4.1.1. In-situ studies In-situ studies involve monitoring occupants in their natural environment and typically consider longduration data collection. Data are normally acquired passively through sensors that are built-in as part of the building automation system (BAS) or are newly installed for research purposes. The sensors detect dependent variables such as occupants’ presence, adaptive actions, energy use, and predictive variables such as indoor environmental quality (Haldi and Robinson 2010, Pigg et al. 1996, Duarte et al. 2013). Because in-situ studies use existing environments, they are generally preferable for replicating reality when obtaining data for occupant modeling (de Dear 2004). In-situ studies, if designed and conducted well, may reduce the Hawthorne effect (McCambridge and Witton 2014), the notion that knowledge of being studied affects occupants’ behavior. However, insitu monitoring does not necessarily provide detailed contextual insights about behavior, can be affected by privacy implications, and requires a considerable amount of time and effort to set up and collect data (O’Brien and Gunay 2014, Rea 1984, McLaughlin et al. 2011, Fogarty et al. 2006). Moreover, the use of existing occupied spaces limits the flexibility of experiments, while research visits to the space can be invasive for occupants. In contrast to the other occupant research methods, the sample size of in-situ methods is often limited to the number of willing participants in the subject buildings. Lack of flexibility in sensor placement to avoid interfering with occupants’ activities or prevent the measurements being disturbed by the occupants can reduce the accuracy of measurements and may introduce errors (Reinhart and Voss 2003, Andersen et al. 2013). While existing built-in sensors can provide a cost-effective (but sometimes less accurate) method for collecting data, the addition, maintenance, and removal of additional sensors and related infrastructure—and the labor for doing so—can become costly for large sample sizes. Ethics, participant recruitment, and informed consent remain fundamental challenges for this approach (Gilani and O’Brien 2016).
4.1.2. Laboratory studies Laboratory studies require participants to spend time and interact within a fabricated environment that is specifically intended for scientific studies. In recent decades, numerous laboratory environments have been built, mostly for studying comfort, and more recently for investigating occupant behavior. Many look like real indoor environments, but are heavily equipped with sensors and allow greater control over layout, technologies, and indoor environmental conditions. This degree of control offers a significant experimental advantage over in-situ studies. A wide range of indoor environmental scenarios can be simulated according to the experimental design. Moreover, the social impact of the presence of other occupants on the participants’ adaptive actions can be measured very efficiently (Schweiker and Wagner 2016). Additionally, laboratory studies offer greater flexibility in terms of recruiting participants, because subjects do not have to be occupying a specific building and can be selected based on pre-defined criteria. A disadvantage of laboratory studies is that facilities for occupant research are typically costly to build and operate. Likewise, the experiments themselves are significantly more expensive than in-situ studies, mainly due to the human resources required. Another downside is that the short-term and 12
potentially unnatural characteristics of some laboratory environments may influence occupants in complex ways. For instance, an occupant in a laboratory study may perceive their environment differently than someone under stress from work in a real office. Schweiker and Wagner (2016) addressed this issue by having study participants perform their regular work tasks during a one-day test. Similarly, sensor equipment that is visible to participants reminds them that they are being monitored, which may constrain their behavior. Another issue with laboratory studies is the presence of unknown persons in an experimental setting, which may influence participants’ perceived sense of control over the indoor environment (Hawighorst et al. 2016). Compared with the in situ studies, laboratory studies are more subject to the Hawthorne effect.
4.1.3. Surveys Surveys differ considerably from the two research methods described above. Surveys rely on the selfreporting of personal behavior (Vine 1986), either by filling out questionnaires or through interviews and focus groups. This method is useful in its ability to reveal the logic and rationale behind habits and behaviors in ways that sensor-based methods do not (Day et al. 2012). Often, post-occupancy evaluation (POE) studies rely on surveys to understand how well a building is functioning, including occupant comfort and satisfaction (Cohen et al. 1999, Wagner et al. 2012). Surveys are a cost-effective means of achieving a large sample size and can measure phenomena that would be difficult or impossible to measure with sensors (e.g., thermal comfort sensation and clothing level). Several recent studies (Becerik-Gerber et al. 2011, Konis 2013, Haldi and Robinson 2008) have relied on custom technological survey solutions for polling occupants more frequently than a telephone, paper, or online survey would allow. Surveys have also been used to develop models (e.g., Haldi and Robinson 2008). While there are many benefits to using surveys in occupant research, a number of established psychological biases, including the Hawthorne effect and social desirability bias, suggest that selfreported behavior may not always match observed behavior (McCambridge et al. 2014). In addition, a lack of understanding of different building services systems or the misinterpretation of questions will cause occupants to unknowingly report things incorrectly. A final disadvantage of survey studies is that, relative to in-situ and laboratory monitoring approaches, they typically do not facilitate frequent sampling because they rely on occupants’ active input and, therefore, may be less suitable for longitudinal studies. Despite these limitations, surveys are an effective tool for improving our understanding of occupant behavior, and can be used to narrow down predictors for in-situ and laboratory studies.
4.1.4. Mixed methods Often, it may be appropriate or necessary to exploit the benefits of several methods to achieve the research goals. Mixed methods studies can be designed in a number of ways, all with the common feature of combining multiple methods (qualitative, quantitative, or both) in a single study. If qualitative and quantitative methods are combined, a greater weight may be placed on one or the other. 13
Alternatively, both parts might have equal weight in the final results. Mixed methods are commonly classified as being convergent parallel, exploratory sequential, explanatory sequential, or embedded (Creswell and Clark 2007). In this context, the term “mixed methods” only refers to the type of data being collected for analysis. These can be either quantitative (e.g., measured physical quantities) or qualitative (e.g., answers from interviews). However, a mixed method could also be used as an approach straddling between the laboratory and in-situ approaches. The Norwegian Living Lab facility at the NTNU in Trondheim and the Metabolic Research Unit at the University of Maastricht enable “extended laboratory studies” in which occupants inhabit the laboratory for a longer period (several days to weeks), and thus will overcome the short-term effects of laboratory experiments. However, participants are still monitored as in a laboratory situation, and are thus exposed to these effects. Convergent parallel research designs, which conduct qualitative and quantitative analysis in parallel followed by a comparison for final interpretation, allow researchers to quantify occupant actions and obtain a better understanding of cause and effect while measuring behavior in-situ. Gunay et al. (2014) measured the temperature in 40 apartments for four months over the heating season to understand occupants’ thermostat-related behavior. The researchers also performed an extensive survey during this time to better understand the occupants’ attitudes and behavior towards heating control. Building upon this work, Bennet and O’Brien (2016) combined six months of apartment temperature and relative humidity measurements with a survey at both the beginning and end of the measurement period. This allowed participants to be surveyed with the same comfort-related questions in both the summer and winter, while enabling logistical efficiency because the equipment was set up during the first survey and retrieved during the second survey. Explanatory sequential mixed method designs are appropriate for situations where the quantitative data that are collected cannot be fully explained by the data alone and qualitative methods may offer more insight. Meerbeek et al. (2014) monitored office workers’ window blind usage, and then asked selected participants to keep a diary to help explain the rationale behind their blind movement actions. Similarly, Day and Gunderson (2015) applied an explanatory design to study the relationship between occupant knowledge of passive building systems and behavior, comfort, and satisfaction. In their study, a survey was first conducted across ten high-performance buildings (n=118), and then followup interviews were conducted with several of the survey participants (n=41) to better understand the results of the survey. Exploratory sequential designs are particularly well suited to the research of building occupants because qualitative methods (e.g., focus groups) can be used to identify the most important phenomena to measure in follow-up quantitative laboratory or in-situ studies. Given the cost of conducting laboratory and in-situ studies, identifying the most important measurement equipment is critical. An exploratory sequential design is not as common as the methods described above in the occupant behavior literature; however, as observed by O’Brien et al. (2013), there has been a trend over the past decades away from qualitative and exploratory research and toward quantitative research. Undoubtedly, the quantitative research has benefitted tremendously from the foundational work conducted in the last three decades of the 20th century.
14
Finally, an example of embedded research design is that of Gilani and O’Brien (2017), where the primary researcher took the opportunity to converse with occupants to better understand comfort in 25 private offices as she configured and placed the sensors. The primary goal of the study was to quantify how behavior affected building energy, but these informal and not explicitly planned discussions yielded interesting and unexpected insights (e.g., a few occupants attributed their headaches to fritted glass).
4.1.5. Ethical considerations “While researchers conduct important research and enjoy freedom of inquiry and expression, they must also hold their work to high ethical standards, including protecting the rights and benefits of participants” (Canadian Institutes of Health Research et al. 2014). Primarily, these efforts need to consider the protection of an individual’s privacy and physical and mental safety. Moreover, participants’ time and effort should not be wasted by a poorly designed study. Therefore, part of a researcher’s ethical conduct is to ensure the scientific validity of the study design. Ethical conduct should not be considered as a burden to a researcher, but rather as an important consideration to minimize potential harm to participants, especially when considering the potentially high level of personal interaction that accompanies occupant behavioral studies or experiments. Ethical considerations are similar although the management process is country specific. Typically, an institutional review board reviews and oversees all research activities involving human participants (including human biological samples, e.g., blood or tissue). Ethics committees are in place to (a) ensure the rights, safety, and welfare of human research participants and (b) enforce compliance with all applicable federal and state laws/regulations. The level of review strongly depends on the type of study and the research design; full board review is not common in occupant studies because many of them use non-intrusive behavioral observations with no personally identifying information. Still, some studies in occupant research may involve above-minimal risk and thus require full board review. Likewise, any research involving vulnerable participant groups (e.g., children, prisoners, institutionalized individuals) is subject to full board review. In the case of research studies, “risk” can be defined as “the probability of harm or injury (physical, psychological, social, or economic) occurring as a result of participation in a study. Both the probability and magnitude of possible harm may vary from minimal to significant” (Penslar 1993). Researchers should reflect on the probability and magnitude of each potential risk identified when designing a study. With regard to occupant behavior, research risks mainly refer to the identification of specific participants and the leaking of their personal information, e.g., through different means of data collection and storage. Consequently, participants’ privacy and confidentiality must be maintained and guaranteed with regard to any personal data. The selection of participants should consider equity and fairness. This includes equitable selection regarding gender, race, ethnicity, etc., without personal bias, unless the use of one particular group has significance to the purposes of the study; fair distribution of benefits among the population (e.g., findings would serve not only high-income people); and the provision of additional safeguards for vulnerable populations (Collaborative Institutional Training Institute (CITI) 2016). Further, informed 15
consent must be obtained to ensure prospective participants understand (a) the nature of the research, (b) that they can voluntarily decide whether to participate, and (c) that they can cease participation at any point.
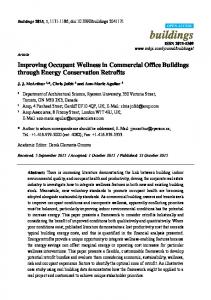
4.2. Sensing and data acquisition technologies Occupant sensing provides valuable information about actual behavior by capturing the ‘life’ of participants. Data acquisition methods, including visual information from cameras (static or wearable), are essential elements of occupant behavior research. To capture occupants’ behavior in buildings, researchers may collect two types of information: (1) reported information using surveys and/or (2) monitored information from sensing and data acquisition technologies. While reported information may reveal insights on the rationales and motivations for behavior, they rely on recalled memories, which might not match the type, duration, and frequency of the actual behavior. Various types of sensors have been used to collect rich information about occupants and their interactions with the built environment, such as their presence, actions, power consumption, etc. This quantitative data establishes a foundation for studying the physiological, psychological, and social aspects of occupant behavior. A comprehensive survey of the literature on methodologies of occupant sensing and data collection for both in-situ and laboratory studies was conducted within Annex 66. This survey introduces state-ofthe-art occupant sensing technologies with regard to sensor hardware, sensing principles, and testbed case studies (Wagner et al. 2017). Based on this survey, the seven most relevant categories of occupant sensing technologies are threshold and mechanical, image-based, motion sensing, radio-based environmental, mixed sensing, human-in-the-loop, and consumption sensing. These are summarized in the following subsections.
4.2.1. State-of-the-art of occupant sensing technologies Threshold and Mechanical Sensing Threshold and mechanical sensors detect or change the acquired state of building components with which occupants frequently interact, such as windows (Caucheteux et al. 2013) or doors (Agarwal et al. 2010). Examples in this category include: (i) reed contacts, which detect whether a door or window has been opened or closed; (ii) door badges, which an occupant must swipe to access a room; (iii) piezoelectric mats, which produce an electric signal when an occupant stands or walks on them; and (iv) infrared (IR) beams, which produce a signal when the beam is blocked at the entrance. Researchers should be aware that these sensors have a number of limitations in terms of obtaining accurate counts, such as lower count because of the precision limitation of equipment. Image-based Sensing Recent research applying image-based sensing tools shows that there is a gap between what people report doing and what they actually do (Gauthier and Shipworth 2015). Therefore, image-based sensing should be used to collect objective and quantitative occupant data. Challenges associated with 16
this data collection method include the analysis of visual information and ethical considerations. However, image recognition techniques are becoming more advanced and accessible, enabling images to be analyzed within the sensing technologies; this gives the researcher an output stream of behavior occurrence rather than pictures (Bourikas et al. 2016). Currently, the primary focus of image-based occupant detection technologies is to track people as they move through spaces, commonly known as “presence” (Kamthe et al. 2009, Erickson et al. 2014, Gade et al. 2012, Gade et al. 2013, Kumar et al. 2014). If errors can be excluded (e.g., non-covered areas in a space), image-based sensing can provide ground truth information for studies using other sensors (Hutchins et al. 2007, Erickson et al. 2009, Meyn et al. 2009, Lam et al. 2009, Dong and Lam 2011, Dong et al. 2015, Li and Dong 2017) and to track occupants, e.g., to study occupant interactions with windows (Inkarojirit 2005, Konis 2012), window blinds, and shades (Reinhart 2001, Kapsis et al. 2013), or occupant evacuation (Proulx and Reid 2006). The most advanced versions of image-based technology use detection algorithms running within the packaged visible light camera hardware to detect the direction and number of people traveling through a space (Wang and Fesenmaier 2013). Simpler approaches use visible light cameras to detect motion to indicate occupant presence (Ding et al. 2011). Figure 4-2 shows a few examples of image-based camera deployments, where (a) is a micro camera operated through a Raspberry Pi at the University of Calabria (luminance camera); (b) is a commercially available camera network (visible light camera) at the University of Texas at San Antonio (UTSA); and (c) is a stereo vision camera network (visible light camera) at South Denmark University. Beyond the use of static cameras, visual information may be captured using wearable cameras, leading to the production of a visual diary or ‘lifelog.’ A wearable camera may be triggered manually by the participant, by a timer, or by a change in the environment (e.g., lighting level, participant movement). This data collection method is most effective when a specific behavior is investigated (e.g., responses to cold discomfort) and limits the number of images that can be processed (Gauthier 2016). As with all wearable tools, participants should actively engage with the device, since it needs to be worn and regularly recharged. The main limitation of image-based sensing is that participants may behave differently because they know they are being observed. To address this issue, researchers may introduce pre- and post- imagebased sensing studies to capture potential changes in behavior. In summary, image-based sensing is a powerful tool in revealing and validating occupant behavior captured by concurrent data collection methods (e.g., smart energy meters).
17
a) Micro camera through RaspberryPi at University of Calabria (Italy) (Picture by Dafni Mora)
b) Commercially available camera network at UTSA (Picture by Bing Dong)
c) Stereo vision camera network at South Denmark University (Picture by Mikkel Baun Kjærgaard)
Figure 4-2: Examples of various camera networks deployed for occupancy behavior studies Motion Sensing Motion sensors detect the presence or absence of occupants through the occupants’ movements. The primary sensor types are passive infrared (PIR), ultrasonic Doppler, microwave Doppler, and ultrasonic ranging sensors (Agarwal et al. 2010, Agarwal et al. 2011, Hnat et al. 2012, Yavari et al. 2013). PIR is by far the most commonly used sensor technology in this category. This sensor type has been extensively used as part of a network; for lighting control; to inform, validate, and verify occupant presence models; and as part of a testbed for network topologies (Agarwal et al. 2010, Agarwal et al. 2011, Dong and Lam 2011, Yavari et al. 2013, Dong et al. 2015). PIR sensors are a medium-cost technology, but they are accurate only if mounted with good coverage of the areas of occupancy. These sensors often under-count because they require a line of sight to the target and become inactive when occupancy activity is low. For example, they may not provide accurate reports in residential environments if occupants are staying still, e.g., sleep, read, or watch television. Currently, advanced work with PIR sensors is looking at tracking individuals as they move through a space (Narayana et al. 2015); the combination of different motion sensors can also offer improved performance. Radio Signal Sensing Occupant detection systems based on the measurement of radio signals can provide occupancy information such as user location, presence, count, identity, and movement (Martani et al. 2012). Radio signals cover the range of electromagnetic wave frequencies, from 10 kHz to 300 GHz (Misra and Enge 2011), and are sent from a transmitting node to a receiving node. The transmitted radio signal consists of a short series of pulses or a modulated radio signal. Radio-signal sensing can provide three types of measurements: Proximity: Signal reception at the receiving node denotes the proximity of the transmitting node; Distance: Signal properties or modulated content enable estimation of the physical distance from the transmitting node to the receiving node; and 18
Distortion: Signal distortion properties at the receiving node denote that the presence of occupants has affected the signal properties. It is important to consider that radio signals transmitted through the air are affected by humidity, the presence of other signals, and many other environmental factors that can have a significant impact on the accuracy of the sensing results. An example is provided about occupancy sensing using buildingwide WiFi infrastructures (Prentow et al. 2015). Mixed Sensing Occupants interact with their indoor environment in various ways, emitting heat and “pollutants” (e.g., CO2 and odor) and generating sound, opening and closing windows, and turning lights on and off. These interactions and their effect on the indoor environment cannot normally be measured using a single sensing technology; often, a mixed sensing approach is adopted, whereby various types of sensors are used together (sensor fusion). There have been studies combining multi-infrared, imagebased, and acoustic sensors to allow the monitoring of picture depth (Seer et al. 2014). For example, Microsoft’s Kinect® device projects a cloud of dots that gather information about the background by analyzing the projected diameters of the dots and then approximating the distance from the measurement device using an IR vision camera. When paired with image-based sensors, this device can precisely determine occupancy in an observed area. Figure 4-3 shows an example of the deployment of Kinect sensors for a residential testbed. Another example is an information technology-enabled sustainability testbed (ITEST) developed by Dong and Lam (2011). This includes occupant sensing, data acquisition, data storage and management, and data processing. ITEST uses PIR and an array of sensors, including total volatile organic compound (TVOC) concentration, cameras, CO2, temperature, illuminance, relative humidity, and acoustic. These are used together to detect and predict occupant presence and numbers in an office building (Dong and Lam 2011).
Figure 4-3: Microsoft Kinect® with sample raw data (Microsoft 2016) (picture by Jakub Dziedzic) Human-in-the-loop The human-in-the-loop method requires humans to be involved in the measurement and collection of occupancy and/or behavior data. Methods in this category include manual observations, Internet-based occupant data, and device interactions. Manual observations cover the logging of data by a person directly sensing the information being relayed, i.e., counting the people walking through a hallway in person or watching a video recorded in a building and annotating the video with occupancy information. Manual observations are often used 19
as the ground truth when evaluating the accuracy of other occupancy sensors. This method is costly because of the labor required, but can achieve high accuracy if it is possible to precisely define the task to ensure consistency in interpretation and recording. While this method does not provide continuous quantitative data as the other methods, it is the only way to directly determine occupants’ clothing level, assess individual behavior, and capture contextual factors other than physical quantities. Internet-based occupant data cover various types of data provided by occupants and collected by applications such as social networks, calendars, or surveys. Although there are some privacy concerns associated with this approach (e.g., collecting and storing sensitive information), many organizations already gather such data, which brings down the cost. Methods combining social networking and calendar data have been proposed for the estimation of cubicle occupancy (Ghai et al. 2012). Device interactions cover data about occupant actions registered through their interactions with control interfaces. Common interfaces include thermostats, light switches, and controls for motorized blinds. Wall thermostats and other modern control interfaces often contain programmable buttons to execute occupants’ control decisions, such as increasing/decreasing temperature set-points, turning on/off lighting, and adjusting the position of motorized blinds. The statistical analyses of data concurrently gathered from occupants' control actions make it possible to develop occupant behavior and presence models. These models have been useful in building controls (Goyal et al. 2013) and design-related applications (e.g., O’Brien and Gunay 2015, Gilani et al. 2015). A more common method of using sensors for monitoring blinds is to log occupants’ control of motorized blinds. This has the major advantage that the infrastructure is already likely to be in place, and so the cost is minimal and no installation during occupancy is required. However, a major disadvantage of this method is that occupants use motorized window blinds much more than manual ones (approximately three times more according to Sutter et al. (2006)). Thus, these results cannot be extrapolated to develop manual blind control models. A practical issue in large control networks in commercial buildings is the database scan rate, which can be as slow as two scans per second. This can result in actions being missed—for example, an occupant may push the light switch button many times assuming that the controller missed the previous signals. In addition to provoking occupant frustration, this may also affect occupants’ activity, causing the sensor to register false actions. Consumption sensing Consumption sensing covers methods of measuring water and energy consumption in buildings. The accuracy of such methods depends on the level of metering granularity, which ranges from one meter per building to one meter per receptacle/fixture. Better metering granularity can be obtained via algorithmic methods (i.e., non-intrusive load monitoring methods) that split total consumption into its individual components. The cost of such methods is directly related to the cost of installing relevant metering. More recently, smart water meters have been used for detailed monitoring, but the deployment of smart water meters is still far behind that of electricity meters.
20
4.2.2. Occupant data acquisition and storage As covered in the preceding sections, a wide range of sensing technologies is available for collecting occupant data. With regard to data acquisition, sensors might be deployed in the area of interest for a particular study, or be part of the existing building automation and control network. Commonly, there are four different technical configurations for occupant data acquisition: manual collection, wireless network, gateway/building automation systems, and internet-enabled. Data acquisition cannot be discussed without consideration of data storage. Occupant data can be stored using different data storage platforms, e.g., with manual collection, data are collected locally on a temporary storage medium such as flash storage. Collection from the sensors to the temporary storage medium can be implemented with a sensor node consisting of a smartphone or a small computer board. The sensors can then be connected to the sensor node by either local input/output (I/O) or local networking. Another option is for occupant data from a BAS to be permanently stored in a commercial data archiver. The same data could also be stored in other ways, e.g., as individual files or in a database. Another example is internet-enabled sensors that allow for direct communication with a data repository. The data repository might be hosted on a server or cloud platform, and the sensors might push the data to the repository or the repository might pull data from the sensors. The internetenabling of sensors is part of a trend targeting the development of Internet of Things (IoT) products and services. Notably, even though sensors are internet-enabled, they might not be accessible through the public Internet for security reasons, but instead reside on a local subnet. This creates some limitations on the physical placement of the data repository, which might result in the need for a gateway that can access the local subnet and forward data over the public Internet. However, data safety issues have high priority for all cases involving an Internet connection, especially if occupancy can be detected in real time. When storing data, a number of parameters that affect the quality of the collected data must be considered. These parameters are as follows: Latency: the time between measurement sampling and availability on the data storage platform for further processing; Granularity: the frequency with which occupant data are collected on the storage platform; Robustness: the probability that occupant data will be delivered to the storage platform; and Security: the probability that occupant data could be manipulated or intercepted by a third party. Moreover, it is important to check that the data acquisition configuration does not have a single point of failure, which compromises the acquisition of data when failing.
4.3. Data collection protocol A research protocol or study design describes the methods used for data collection and data analysis. This section focuses on data collection and describes a systematic approach for occupant monitoring studies. The four major phases of occupant monitoring studies are: (1) investigation and design of experiment; (2) participant recruitment and equipment installation; (3) study; and (4) publishing. The 21
data collection procedures listed below are somewhat targeted at in-situ studies with longer-term data collection. Thus, some of the steps for laboratory studies may be skipped, as it is assumed that the facilities are already constructed. Note that the exact order of steps will vary greatly from study to study as some may adopt deductive reasoning while others use inductive reasoning. Studies may start with observations of occupants’ behavior in a specific setting (e.g., home in winter) from which patterns will be inferred by applying data mining techniques to initiate theories. In contrast, a deductive protocol will start with a hypothesis, which will be tested to confirm a theory. For example, researchers investigating the effect of indoor dry bulb temperature on window opening behavior may introduce a ‘pre- and post-’ protocol with seasonal monitoring. The order of steps in the protocol described below could vary for ethical reasons. For instance, researchers cannot enter occupants’ private spaces (e.g., private offices or homes) prior to obtaining their informed consent. Thus, an iterative approach involving several visits may be required to assess the space, install sensors, and interview the occupants.
4.3.1. Investigation and design of experiment phase First, the structure of the research should be planned by establishing the research questions and hypothesis, associated units of analysis (e.g., individuals, groups, geographical units, social interactions) and the types of relationships to be investigated. This preparatory planning phase involves designing the research project, selecting and investigating the space, assessing the steps required to prepare the spaces, obtaining research ethics approval, and budgeting. Additionally, in some cases, this may be necessary as part of a project proposal to acquire funding. The procedure steps are as follows: Step 1. Selection. Determine the occupant behaviors to be studied (e.g., window opening, light use, clothing level adjustment), including presence. Step 2. Method. Determine whether one or more methods (e.g., in-situ, laboratory, and surveys) will be used to obtain greater insights into the phenomena of interest. Understanding the range of research methods required to answer a research question is critical in defining the boundaries of the research and ensuring internal validity. In deductive studies, the observed change in occupants’ behavior should ideally be attributed to intervention and not to alternative causes. For example, window opening behavior may be attributed to an increase in indoor dry bulb temperature, but also to a decrease in external noise. Step 3. Sample size. Determine the adequate sample size (number of occupants and study duration) for the behavior(s) of interest. Sampling is the process of selecting the unit of analysis, and thereby drawing the confines of the study’s external validity. This is a critical step in the data collection protocol, as it outlines how the findings of the study may apply to other settings, places, times, and people. A major consideration for the extent of a monitoring campaign is budget—particularly for in-situ and laboratory studies, which tend to involve considerable sensor-related hardware or payment to subjects. Note that there can be significant variation between the cost of sensing equipment depending on accuracy, battery life, memory capacity, etc. To some extent, economies of scale can be realized because of the fixed cost and time for activities like ethics review, travel to the subject building(s), and data analysis 22
Step 4.
Step 5.
Step 6.
Step 7.
Step 8.
(if automated). Survey studies may be constrained if an honorarium is paid to participants. The research design is likely to be an iterative process, and new insights (e.g., importance of measuring an additional item) mean that the budget may evolve over time. Factors. Once the target behavior(s) have been defined, the alternative causes and influencing factors (e.g., indoor environmental parameters) that are known to affect or not affect the behaviors of interest should be established. If there is no precedent in the literature regarding whether a particular factor has a statistically significant contribution to predicting occupant actions, the researcher is advised to consider including it in the study design. Ethics. Obtain research ethics clearance, if necessary. Any study involving human participants requires consultation with the relevant ethics board. Note that permission from occupants is likely to be mandated by the local ethics board for visits to and photography of private spaces. Inspection. If possible, particularly for in-situ studies, inspect the building(s) and spaces to be monitored via a walkthrough, drawings, and/or building facility management to develop an inventory of: (i) the current space layout and equipment; (ii) potential built-in sensors (e.g., those connected to the building automation system); (iii) control interfaces; (iv) heating, cooling, and ventilation equipment; (v) failed or broken equipment; and (vi) occupant interventions to equipment and user interfaces. Record this information and sketch the spaces. For studies involving homes and other private spaces, this step is likely to occur after recruitment, as participants in these spaces would normally need to provide their consent to researchers performing this investigation. The above information is also highly valuable for survey studies, if available, to provide contextual information. Similarly, it should be documented and published for laboratories (as explained in the Publishing phase). Weather. The research design for in-situ and laboratory studies that are exposed to outdoor conditions should review the need to collect weather data (e.g., type of data, temporal resolution, spatial resolution). Many in-situ studies and modeling efforts aim to correlate occupant actions with weather events and trends; if this is the intention, weather data should be surveyed concurrently with the behavior being monitored. Sample frequency. Determine the sampling frequency of measurements and data logging in inductive and deductive studies. Ideally, the frequency of all systems should match and the sampling should be synchronized. Previous studies have used sampling periods ranging from minutes to hours (and up to days or weeks for longitudinal survey studies). Electrical load measurements may require a higher frequency if they fluctuate rapidly and the objective is to disaggregate the load. The sampling frequency should be at least as frequent as commonly used in building simulation time steps (i.e., 5–15 min). Researchers should be aware of the expected frequency of occupant actions and the rate of change of states, and determine a practical sampling frequency accordingly. For the modeling of occupant actions, it is important to measure the time of actions so that their triggers can be reliably identified. If local data storage capacity is limited, the sampling frequency may be compromised to reduce the number of data retrieval visits for in-situ studies, as these may disturb occupants or invoke the Hawthorne effect. Event-based logging is more appropriate than time interval sampling for discrete events, like window openings and occupancy. Event-based logging is also much more memory-efficient, as only events are recorded. While measurements may be 23
Step 9.
Step 10.
Step 11.
Step 12.
Step 13.
continuous, in some deductive studies, the same set of measurements is captured at specific points in time, enabling inferential and repeated-measure analysis. This type of sampling allows the pre- and post-intervention relationships to be assessed. Sensors. Determine the most suitable sensors and data-logging infrastructure for the measured parameters of interest. Note that for in-situ studies, some of these may already exist in the space as part of the BAS. Other proxies for occupancy and occupant actions may be available using existing infrastructure and data sources (e.g., security card systems, Wi-Fi devices). Meters. For in-situ studies, assess the BAS, energy, and water meters to determine the availability of data that could be used to study the occupants. To address systematic measurement errors and internal validity issues, the accuracy of the sensors/meters should be assessed via calibration. Furthermore, sample data should be reviewed to ensure results are within the expected range and are being stored. Ideally, the data from meters should be validated (e.g., using portable equipment for spot checks). To validate survey questions, analogous methods can be used (such as statistical tests like Cronbach’s Alpha). Redundancy. To address internal validity issues with in-situ and laboratory studies, additional sensors and data-logging infrastructure may be installed in parallel to collect the same variables with different methods. Such equipment can be sourced from scientific supply companies and building control equipment suppliers, but may also come from companies that manufacture or supply equipment for entirely different purposes than the one at hand. Pilot study. For in-situ studies, a pilot study should be undertaken to test all sensors for several days or weeks under a wide variety of expected conditions to ensure proper functionality. In laboratories, regular tests are mandatory for consistent results over several years. Ideally, the sensors used to measure the same conditions (e.g., temperature sensors immersed in the same air) should be compared to a sensor with a known high accuracy. Key practical questions that the researcher should determine through sensor testing include: How easily are the sensors dislodged if they are bumped or jostled by closing doors/windows? How sensitive are the sensors to orientation and location? What are the most suitable placement or mounting strategies to be used in the occupant spaces? For instance, if a door is left ajar, does the contact sensor measure the state as open or closed? What are the failure modes caused by occupant interference (e.g., permanent manual overrides such as covering sensors with tape) and what corresponding instructions must occupants be given? For distributed sensors that transmit wireless signals, what is the possible range and impact of walls and floors? How sensitive are indoor environmental sensors to sources of heat, moisture, and CO2? Quality control. During the study, the output of the sensors should be reviewed mid-study or at regular intervals to ensure that the sensors are functioning properly and readings have not drifted significantly. Sensor drift should be assessed and reported at the end of the pilot study and the full study.
24
4.3.2. Occupant recruitment and equipment installation phase The occupant recruitment and equipment installation phase normally occurs after the research design and pilot study, and prior to the study phase. Researchers should be aware that this seemingly straightforward phase can take many weeks, largely because of the uncertainties associated with recruiting and interacting with participants; a backup strategy may need to be considered. The procedure steps are as follows: Step 1. Recruitment. Recruit participants according to the procedure laid out in the research ethics proposal and data protection review. The participant information sheet (PIS) should comprise a detailed explanation of the study, including, but not limited to, the following: Duration of study Expected timing and frequency of visits (e.g., for installation and removal of sensors), surveys for longitudinal studies, or periods in laboratory for laboratory studies Type of installed instruments (sensors, surveys, wearable devices, etc.) and what they measure For studies involving sensors, clear instructions on how to relocate sensors if absolutely necessary Details on data storage, security, publication, confidentiality, and anonymity Availability of data and final results if occupants wish to obtain them Collection and publication of other information (e.g., planned questionnaires or photographs) Terms for ceasing participation of study Compensation for participating in the study, if applicable Step 2. Consent. Obtain permission and informed consent from occupants for experiments in private spaces, work places, and laboratories. Step 3. Occupant information. Obtain information on occupants by interview or survey, including but not limited to perceived control, environmental comfort, socio-demographic characteristics (e.g., profession, especially for studies involving workplaces), gender, number of occupants, household composition, employment status, and locations. Step 4. System commissioning. Repair failed building equipment and systems (e.g., broken blinds and operable window cranks, poor automatic light controls logic), if possible; otherwise, the data will be tainted by these anomalies. Step 5. On-site preparation. For in-situ studies, visit the occupants to discuss the study, check the space(s), and install sensors. For commercial buildings, it may be possible to gain access to spaces with the assistance of the building managers or operators without the presence of occupants. However, occupant/participant permission should be sought regardless, as per the terms of the ethics application. Step 6. Documentation. Photograph and take notes about the spaces and sensor locations. Sensors should be labeled so that there is no risk of mixing them up after retrieval. Many purposebuilt packaged sensors and data logging systems also allow digital naming via software. This extent of documentation is critical for retrieval at the end of the study and to help explain any unexpected measurements. Step 7. Provide instructions. For in-situ and laboratory studies, inform the occupants of sensor locations and any specific instructions to reduce the likelihood of obstruction, disconnection, 25
or damage. Researchers should remind participants to contact them if there is a change in occupancy pattern, e.g., moving office or home, so that the equipment is not lost and the data are not misinterpreted as having minimal occupant presence and actions. It is wise to provide researcher contact information on all distributed sensors.
4.3.3. Study phase This phase follows the research design, pilot study, sampling and installation of equipment. It may last weeks to years, and focus on the collection of the main dataset. The study phase procedures are as follows: Step 1. Monitor data. Plan regular data checks, if possible, to ensure that sensors and data storage are functioning. If data storage is local and requires site or laboratory visits, the researcher should avoid frequent visits to minimize effort and avoid disrupting occupants. Note that the amount of lost data could be as high as the time between checks. Therefore, frequent visits and data loss issues should be fairly balanced. For instance, for in-situ studies, monthly visits will help ensure that at most only one month of data is lost. If possible, back-up sensors, batteries, and other equipment and tools should be brought to site visits in case a sensor failure has occurred. Data should be backed-up on multiple storage devices, while abiding by the data security regulations laid out in the ethics application. Step 2. Surveys. Perform scheduled intermediate surveys, if applicable. Step 3. Data security. Ensure secure data storage and occupant confidentiality or anonymity, according to the details in the research ethics application, to protect occupants’ identity and measured data. Coding schemes can be used to disassociate occupant names from data (i.e., pseudonyms). This is particularly important for occupancy data, which could be used by thieves or employers. Normally, ethics clearance requires thorough planning for these matters.
4.3.4. Publishing phase Given the significant effort required to conduct occupant monitoring campaigns, the resulting data and analysis are of tremendous value to the research community. Thus, the importance of attention to detail, scientific rigor, and transparency in such studies cannot be underestimated. Therefore, the following actions are required: Step 1. Scientific detail. Provide a significant level of detail about the equipment specifications, spaces, participants, occupant behaviors of interest, and details of the procedures listed above. Best scientific practice is to ensure sufficient detail to allow readers to repeat the experiment. Contextual information (e.g., building orientation, difficulty to reach a building interface, loud street noise) should be included. Step 2. Data sharing. Publish anonymized data in raw or aggregated form, where possible, such that other researchers and stakeholders can verify the published results. The additional reporting of non-significant variables will help to avoid unnecessary effort and cost for future research (e.g., potential meta-analysis). 26
In summary, the data collection protocol aims to provide a framework to answer a research question. It may follow an inductive or deductive approach to uncover the cause(s) of specific behavior. While drawing the boundaries of the research in the selection of the data collection method(s) and the sample, the protocol addresses internal and external validity issues.
4.4. Data management Data management is an important discipline to reliably collect and store data using the research methods and protocols. For instance, data support energy and performance contracting (Li et al., 2014), model-predictive building systems control, smart load balancing, and preventive building maintenance. Accordingly, there are various instances of commercially implemented building monitoring systems, as well as research-oriented data collection campaigns (e.g., Roda and Musulin 2014, Guerra-Santin and Tweed 2015, Böhms and Rieswijk 2015). However, further advances in this area are desirable, with the aim of mature technical infrastructures, resilient hardware designs, interoperable software solutions, and—last but not least—higher sensitivity concerning building occupants and their presence, actions, and experiences. This section summarizes the results of a number of related Annex 66 activities concerning the management of occupancy data. Section 4.4.1 discusses a recently developed ontology for the representation and incorporation of multiple data streams in computational applications, such as building performance simulation tools and building automation systems (Mahdavi and Taheri 2016, Mahdavi et al. 2017). Section 4.4.2 addresses common data processing requirements and a number of typical queries that building monitoring data repositories need to support. Finally, section 4.4.3 briefly mentions general requirements and prototypical implementations of data repository solutions for the structured collection, storage, processing, and multi-user exchange of monitored data.
4.4.1. An ontology for building monitoring data The proposed ontology (Mahdavi and Taheri 2016) includes six data categories that provide a coherent framework for classifying the multiplicity of empirical information collected via building monitoring systems. These are: (1) occupants, (2) indoor environmental conditions, (3) external environmental conditions, (4) control systems and devices, (5) equipment (EQ), and (6) energy flows.
Table 4-1 provides a brief summary of these categories. A suitable ontology for the monitored information must clearly define the nature of the monitored variables. To this end, it is possible to demonstrate that, given each data category and the respective
27
sub-categories, all monitored data can be captured in terms of values, associated sources, and possible actors (see Table 4-2).
Table 4-1: Categories of the proposed building monitoring ontology Data category Occupants
Indoor environmental conditions External environmental conditions Control systems and devices
Equipment
Energy flows
Brief description Time series data of occupants’ presence and actions are essential for use in cases such as building operation, occupant-based MPC (Model Predictive Control) and performance assessment. Such data can be structured in terms of four sub-categories, namely i) position, ii) control actions, iii) attributes (e.g., clothing levels), and iv) attitudes (i.e., perceptions and evaluations). Building performance assessment processes require indoor environmental data. Theories on subjective evaluation processes, as well as occupants’ control-oriented behavior, involve one or more indoor environmental parameters as independent variables (e.g., air temperature, illuminance levels). The objective assessment of energy and indoor climate performance requires consideration of the buildings’ contextual circumstances. Building performance depends on the quality of the installed control systems (for heating, cooling, ventilation, etc.). This also applies to the values of system control parameters (e.g., set-point temperatures for room heating and cooling). Thus, adjustment of the control parameter values must also be monitored. Moreover, the state information regarding devices (windows, luminaires, etc.) and associated actuators are of critical importance. Buildings house various technical components such as electrical equipment (e.g., computers and associated peripherals), appliances (e.g., clothes washers and dryers), safety and security equipment (e.g., smoke detectors), and transportation equipment (e.g., elevators). Associated data can benefit multiple applications (e.g., energy optimization, smart grids). Evidence-based building design and energy performance verification require high-resolution energy use monitoring (energy metering). Here, resolution can be understood: (a) in spatial terms (e.g., micro-zones, rooms, floors, whole buildings), (b) across multiple systems (e.g., heating, lighting, equipment), and (c) in temporal terms (e.g., sub-hourly, hourly, daily, monthly, annual). If applicable, energy-harvesting systems such as solar-thermal collectors or photovoltaic panels also need to be monitored.
Table 4-2: Specification of monitored variables Specification
Description
Values
Observational data are typically measured (quantitative) values. Measured values of scalar nature, such as temperature, have a magnitude. Most measured variables in building monitoring have values that can be expressed in terms of real numbers, but some (e.g., thermal comfort evaluations) are typically characterized as nominal data, involving classifications and categories. Typically, a unit must be specified for the variable (e.g., degrees Celsius for air temperature) in order to correctly interpret the numeric values. Spatial and temporal attributes (or extensions) can also be assigned to variable values.
Actors
Changes in the state of control devices and equipment may be triggered by different agents (or actors). For instance, windows may be operated by human agents and motorized shades may be operated based on programmed rules in the automation systems. Ideally, the monitoring system should identify the agent responsible for each change of state.
Sources
Building monitoring can integrate not only common technical sensors (e.g., temperature sensors) and meters (e.g., power meters), but also human agents. For instance, subjective evaluations of indoor climate are customarily assessed via interviews or questionnaires. Data sources must also be specified in terms of their location.
28
4.4.2. Data processing and typical queries The elaboration of monitored data can involve very different data processing paths and options. The steps involved in the related processing routines are strongly dependent on the specific attributes and behavior of the data collection sequence for the sensor, signal convertor, data pre-processing, storage, retrieval, and post-processing. Generally, data post-processing can be separated into two main categories, one for periodic data and one for event-triggered or event-related data. Periodic data are provided by systems that store measurements at regular time intervals based on an internal cycle timer. Corresponding typical systems are BAS and measurement systems or data loggers. The intervals are usually defined by internal setup values. A cycle timer triggers the execution of an internal polling algorithm and the data storage routine. Such data are mainly processed by simple averaging or interpolation of the raw data. Data monitoring systems that are triggered by events (e.g., movement, opening of a door or window, activation of devices, alarms or warnings) tend to store the raw data with corresponding—typically irregular—timestamps. Usually, these data must be postprocessed to generate periodic synchronized data for subsequent analysis, evaluation, or export into other applications (e.g., simulation tools). The generation of periodic data works in terms of a sampleand-hold process, and repeats the last value as long as no new event is recorded. If more than one value is measured during an interval, different post-processing options may be relevant. For instance, periodic instantaneous data may be generated using the last recorded value at each interval. However, in certain use cases (e.g., energy simulation), multiple measurements within an interval are aggregated (e.g., via time-weighted averaging) and assigned as the periodic interval value (e.g., Tahmasebi and Mahdavi 2015).
4.4.3. Building monitoring repositories and prototypical implementations System Design There is a variety of monitoring systems with different system designs to serve different purposes. Modular monitoring applications are best suited to multi-purpose systems: compared to monolithic application designs, they offer more flexibility, maintainability, and optimized resource distribution (Schuss et al. 2016). Independent software modules support the realization of a scalable architecture. Such a concept requires a central distribution mechanism that routes requests between physical machines that may be distributed across buildings within a city. For instance, a Java-based implementation could bundle the components using Message Oriented Middleware (MOM) that can be accessed via a Java Message Service (JMS) Application Programming Interface (API). The communication process is then established by dynamically created queues (point-to-point) and topics (publish-subscribe). On the binary level, there are various protocols that can be used, such as the Advanced Message Queuing Protocol (AMQP). With this technique, it is possible to develop a system core with variously deployable modules residing on different physical machines using a centralized communication mechanism. The system core consists of at least a data access layer that implements the necessary web services to communicate building data via standard industry protocol implementations, such as OPC Unified Architecture (OPC UA), Open Building Information Exchange (oBIX), or custom RESTful (Representational State Transfer) APIs. Sensor data can be requested from 29
distributed sensor webs in real-time via sensor observation services (e.g., IoT networks) or from the application’s data stores (e.g., historic data) via a persistence layer. The system core enriches the raw sensor data with further semantic information from the sensor ontology and builds a sensor data result set that is communicated to client applications or other application services via MOM (internal) or web services (external). Data Repositories Creating high-performance data repositories implies the need for a thorough requirement analysis. The stability of the data repository not only depends on the amount of data to be stored, but also on the queries to be supported, necessary pre- and post-processing, number of requests, desired response time (real-time vs. historic data access), amount of data per request, distribution channels, caching, indexing and partitioning techniques, and so on. The requirements will change depending on the data storage concept adopted. Most monitoring applications store sensor data in files (e.g., CSV), relational databases (e.g., MySQL), NoSQL databases (e.g., MongoDB, Cassandra), embedded databases, inmemory databases, or NewSQL databases. Prototypical Implementation – Monitoring System Toolkit The above monitoring system design concepts were prototypically implemented in the Monitoring System Toolkit (MOST) (Zach et al. 2012). This toolkit was optimized to handle multiple building data on an urban level (Glawischnig 2016). Thus, the discussed implementation of redundant, stateless core components was a vital step. The application consists of four layers that communicate internally via MOM. The persistence layer offers multiple repository implementations. Depending on the use case, either a MySQL or Cassandra repository can be used to store sensor data. The BMS business logic and virtual data-point implementations, which are written in the MOST domain-specific language, reside in the service layer. Furthermore, the ontology used to enrich the sensor data resides in the BMS business logic. The service adapter holds implementations of various standard industry protocols, such as OPC UA and oBIX, as well as a custom RESTful interface to offer access to client applications. Finally, the presentation layer currently consists of a web application and a mobile app. All modules are loosely coupled and can thus be redundantly deployed on different physical machines while sharing the same application context.
4.5. Occupant data collection summary Sensing occupancy behavior and collecting occupant data in buildings is a non-trivial and comprehensive process. It involves experimental design, sensing and data acquisition, collection protocol and data management. There are four types of experimental approaches: in-situ monitoring, laboratory studies, surveys and mixed method that combines qualitative and quantitative analysis. During experimental design, ethics needs to be highly considered. Ethical considerations are country specific. Typically, an institutional review board reviews and oversees all research activities involving human participants (including human biological samples, e.g., blood or tissue). This chapters also summarizes fourteen current state-of-the-art occupant sensing technologies into seven most relevant categories, including threshold and mechanical, image-based, motion sensing, radio-based 30
environmental, mixed sensing, human-in-the-loop, and consumption sensing. Each sensing technology has its own pro and cons. Until now, not a single technology can detect both presence and numbers in a cost-effective way with high accuracy. Finally, this chapter reviewed recently developed ontology for the representation and incorporation of multiple data streams in computational applications, data processing methods and data repositories.
31
5. Modeling Occupant Behavior This chapter contains an introduction to the techniques most frequently used for modeling occupant behavior. Here, the main emphasis is on methods for modeling serially independent data, but it will be stressed that, in the case of serially correlated (time series) data, it is important to consider methods that enable a description of time-correlated data. Additionally, an overview of some important model selection tools is given. Subsequently, some of the major modeling results in the literature and the progress made in Annex 66 are briefly outlined. These results are divided into sections, each corresponding to behaviors or actions such as presence, window opening, window shading, lighting use, thermostat setting, and appliance use. Finally, a section is dedicated to the modeling of diversity in occupants’ behavior.
5.1. Modeling approaches The set of mathematical methodologies used in the field of occupant behavior modeling has grown significantly in recent years. Classical statistical models such as general and generalized linear models have been applied extensively. For time-dependent data, Markov and Hidden Markov chains (Dong and Lam 2016, Liisberg et al. 2016, Andersen et al. 2014, Richardson et al. 2008) have proved to be useful tools. Mixed-effects models have been applied to capture the diversity among occupants, and more recent data mining techniques such as clustering (Pan et al., 2017; Ren et al., 2015) and decision trees have been used (D’Oca and Hong 2015). This section gives a brief methodological overview of the modeling approaches used for occupant behavior models.
5.1.1. General linear models The general linear model (classical GLM) is a classical statistical model that assumes normally distributed response variables and a linear relationship between the explanatory variables and the response variable. For instance, ordinary linear regression and the analysis of variance (ANOVA), and mixtures thereof, are classical examples of GLM. Let 𝑌 = (𝑌1 , … , 𝑌𝑛 ) be a vector of n observations of a response variable. We assume that Y follows a multivariate normal distribution 𝑁(𝜇, Σ). In the classical GLM, it is assumed that the vector of mean values 𝜇 = (𝜇1 , … , 𝜇𝑛 ) can be expressed as a linear combination of some explanatory variables expressed by column vectors 𝑋1 , … , 𝑋𝑘 such as 𝜇 = 𝛽1 𝑋1 + 𝛽2 𝑋2 + ⋯ + 𝛽𝑘 𝑋𝑘
(5.1) for certain parameters 𝛽1 , … , 𝛽𝑘 . For the classical GLM, the variance is independent of the expected response, and any observation is typically written as 𝑌𝑖 = 𝜇𝑖 + 𝜀𝑖 (5.2) where {𝜀𝑖 } is a sequence of independent and identically distributed (i.i.d.) random variables with variance 𝜎². For time series data, this is called a white noise sequence.
32
5.1.2. Generalized Linear Models Generalized linear models (GLMs) are an extension of the concept of general linear models, and were introduced by Nelder and Wedderburn (1972). Here, we relax the assumptions of a normally distributed response variable and a linear relation between the explanatory variables and the mean value of the response variable. Instead, we allow the response variable to be a member of a broader class of distributions (exponential dispersion family). We assume that the mean of the response variable is linear in the explanatory variables only through a link function g, i.e.,
𝑔(𝜇) = 𝑋𝛽
(5.3)
For this model, the variance becomes a function of the mean. The residuals are still assumed to be uncorrelated. GLMs apply to a wide variety of statistical distributions. One example that occurs frequently in occupant behavior models is the Bernoulli distribution, which models the outcome of a yes/no experiment. The corresponding canonical link function is the logit function
𝑔(𝜇) = log(
𝜇 ) 1−𝜇
(5.4)
This model is referred to as Logistic Regression. Some relevant distributions with their canonical link functions and typical use cases are listed in Table 5-1. Table 5-1: Logistic Regression: Relevant distributions with canonical link function and typical uses. Distribution
Link name
Link function
Normal
Identity
𝜇 = 𝑋𝛽
Poisson
Log
Bernoulli
Logit
Binomial
Logit
log(𝜇) = 𝑋𝛽 𝜇 log ( ) = 𝑋𝛽 1−𝜇 𝜇 log ( ) = 𝑋𝛽 1−𝜇
Typical use Continuous response data Count data
Application
Number of occupants
Yes/no data
Window open/closed
Share of “yes” in yes/no data
Number of windows open
Temperature, CO2, ...
5.1.3. Linear mixed effects models The concept of linear mixed effects models (LMMs) is another generalization of the classical GLM. Here, besides the explanatory variables X (here called fixed effects), the model also contains random effects U. In this case, the mean value can be expressed as (5.5)
𝜇 = 𝑋𝛽 + 𝑍𝑈
Random effects handle unobserved heterogeneity in the data and link this to some explanatory variables collected in the vector Z. Random effects account for variation that is prevalent in the data, but whose direct relation to the outcome variable is meaningless for the model. In LMMs, random effects are assumed to be normally distributed. A typical application for this type of model would be measurements that were carried out in batches. Consider, for example, a comfort study carried out on three different dates A, B, and C. An inexplicable relation between the date and the outcome variable of the study might be found, and this
33
should be taken into account. However, “date” is obviously not suitable as a predictor variable for the model, as future subjects would not belong to any of the classes A, B, or C.
5.1.4. Hierarchical generalized linear models The model class of hierarchical generalized linear models (HGLMs) was formulated by Lee and Nelder (1996) as a natural generalization of GLMs to incorporate random effects (Madsen and Thyregod 2011). The model is characterized by (5.6) 𝑔(𝜇) = 𝑋𝛽 + 𝜈(𝑍𝑈) where ν is a monotone function and the random effects U are not necessarily normally distributed (otherwise, the notation is the same as above). Special cases of HGLMs are generalized linear mixed effects models (GLMMs), in which the distribution of U is normal and 𝜈 is the identity function
𝑔(𝜇) = 𝑋𝛽 + 𝑍𝑈 (5.7) GLMMs can also be seen as a generalization of LMMs. As in the GLM, the mean is a linear combination of the predictor variables X through a link function g. Haldi et al. (2016) used a GLMM with a binomial response variable and corresponding logit link function. In this case, the random effects were used to model the behavioral diversity of occupants.
5.1.5. Linear time series models The class of models described up to this point does not consider temporal dependencies between the observations. However, in many cases in the field of occupant behavior, response and explanatory variables are derived from time series data. This leads to correlations among the variables, but also to correlations between the “errors” (residuals) over time, a phenomenon known as autocorrelation (Madsen 2008). The class of autoregressive moving average (ARMA) models provides a description of the variation in time-correlated data, and covers a broad range of linear time series models. ARMA models are a combination of autoregressive (AR) and moving average (MA) models. For a time series {𝑋𝑡 }, an autoregressive model AR(p) is given by p
X t = ∑ i=1 𝜙𝑖 𝑋𝑡−𝑖 + 𝜀𝑡
(5.8)
where 𝜙1 , … , 𝜙𝑝 are model parameters and {𝜀𝑡 } is a series of Gaussian white noise. Hence, the current observation can be represented as a linear combination of the previous p observations up to uncorrelated and identically distributed errors. For a moving average model MA(q), the time series satisfies the expression q (5.9) X =∑ 𝜃𝜀 +𝜀 t
i=1
𝑖 𝑡−𝑖
𝑡
where 𝜃1 , … , 𝜃𝑝 are model parameters. The current value of X is given by a linear combination of time lags of a white noise process.
34
To determine whether a model inherits all systematic dependencies of the variables over time, we can check whether the residuals, i.e., the differences between the one-step prediction and measured outcome, are uncorrelated. In constructing both time static (i.e., regression) and dynamic (i.e., ARMA) models, it is very important to check the i.i.d. assumption with respect to the noise (residuals). The autocorrelation function (ACF) can be used to identify temporal correlations in the series of residuals, and is therefore an important tool for the evaluation of models that describe time series data (for details, see Madsen 2008). The two upper plots in Figure 5-1 show a time series together with its ACF, which exhibits an exponential decay in the correlation. After fitting the data to an AR(1) model, the residuals are close to white noise. The corresponding ACF shows no correlations, as desired.
Figure 5-1: Example of a linear time series model In some cases, it is sensible to model a variable’s stepwise differences instead of its absolute values. The class of ARIMA (Autoregressive Integrated Moving Average Model) generalizes ARMA to include differenced data. Other extensions allow the modeling of multivariate variables (MARIMA) and include external predictors (ARMAX) in the model. Most time series data can be described fairly well by linear time series models. Ignoring any temporal correlation in the residuals might lead to problems. For most occupant behavior models, both 35
explanatory variables (drivers) and response variables (behavior) are expressed through time series data. It is therefore advisable to take temporal correlations into account.
5.1.6. Markov chains Markov chains are used in a wide range of applications in occupant behavior modeling, such as in models of presence, window opening and blind usage, lighting, and occupant activities. The defining assumption of a Markov chain is that future states are dependent only on the current state together with the probabilities of the state changing. Time series in which the quantities take a finite number of states can be modeled using Markov chains. In practice, the quantities modeled using Markov chains in the field of occupant behavior are i) occupancy (presence, absence, number of people present); ii) window states over time (open, closed); iii) blind usage (open, closed, fraction of opening); and iv) activity level (working, sleeping, resting, laundry, cooking, absent). A Markov chain consists of a set of transition probability matrices that describe the transition between states in each time step. The matrix entries can be estimated from the source data using maximum likelihood estimation. A Markov chain is defined as follows. Let M be a finite set and T be an index set. A collection of M-valued random variables {𝑋𝑡 } with 𝑡 ∈ 𝑇 is called a Markov chain if the following equation holds:
𝑃(𝑋𝑡 |𝑋𝑡−1 , 𝑋𝑡−2 , … , 𝑋0 ) = 𝑃(𝑋𝑡 |𝑋𝑡−1 )
(5.10) Hence, the previous time step contains all information needed to calculate the probability of the current time step. This Markov property expresses the memoryless property of the process {𝑋𝑡 }. The set M is called the state space of the Markov chain. For 𝑖, 𝑗 ∈ 𝑀, the conditional probability is given by
𝑃(𝑋𝑡 = 𝑖 |𝑋𝑡−1 = 𝑗) = 𝑝𝑖,𝑗 (𝑡)
(5.11)
Equation (5.11) defines the transition probability from state j to state i (at time t). The matrix Γ(𝑡) = {𝑝𝑖,𝑗 }(𝑡) is called the transition probability matrix. If the transition probabilities do not depend on time, i.e., if the transition probability matrix is constant over time, Γ(𝑡) = Γ, the Markov chain is called homogeneous. Otherwise, it is called inhomogeneous. For a detailed description of Markov chains, refer to Zucchini et al. (2016).
5.1.7. Hidden Markov chains A hidden Markov model (HMM) is a probabilistic model consisting of a Markov chain {𝑋𝑡 } whose states are not directly observed and a series of observations {𝑌𝑡 }. The observations follow a statedependent distribution, i.e., their values are influenced by the current state of the Markov chain. An HMM can be expressed as (5.12) 𝑃(𝑋𝑡 |𝑋 (𝑡−1) ) = 𝑃(𝑋𝑡−1 )
𝑃(𝑌𝑡 |𝑋𝑡 , 𝑌 (𝑡−1) , 𝑋 (𝑡−1) ) = 𝑃(𝑌𝑡 |𝑋𝑡 )
(5.13)
where 𝑋 (𝑡−1) and 𝑌 (𝑡−1) are the complete histories of {𝑋𝑡 } and {𝑌𝑡 }, respectively. The formulas above can be read as: {𝑋𝑡 } depends only on its previous value, and {𝑌𝑡 } depends only on the current value of {𝑋𝑡 }. The transition probabilities and parameters of the state-dependent distribution can be estimated based on maximum likelihood theory. One is usually interested in deriving information about an 36
unobserved entity (i.e., X) from the series of observations (i.e., Y). The most likely sequence of hidden states, given the obtained series of observations, is called global decoding. This can be efficiently calculated by the Viterbi algorithm. For more detailed information on HMMs, refer to Zucchini et al. (2016).
5.1.8. Bayesian network models Bayesian network models (BNs) are directed acyclic graphs (DAGs) or belief networks that are used to represent the relationships among a predefined group of discrete and continuous variables (Xi). BNs consist of a graphical model and an underlying conditional probability distribution. The nodes of the graph represent the variables, and the dependencies between variables are depicted as directional links corresponding to conditional probabilities. Hence, the construction of a BN consists of determining the structure and the probability distribution associated with these relations. The relationships between nodes can be explained by employing a family metaphor: a node is a parent of a child if there is an arc from the former to the latter. For instance, if there is an arc from X1 to X3, then node X1 is a parent of node X3. The Markov property of the BNs implies that all probabilistic dependencies are identified via arcs and that child nodes only depend on the parent nodes. To calculate the joint probability distributions, the following chain rules are used: Discrete case
𝑃(𝑋1 , … , 𝑋𝑛 ) = ∏ni=1 𝑃(𝑋𝑖 | 𝑝𝑎𝑟𝑒𝑛𝑡𝑠(𝑋𝑖 ))
(5.14)
Continuous case
𝑓(𝑋1 , … , 𝑋𝑛 ) = ∏ni=1 𝑓(𝑋𝑖 | 𝑝𝑎𝑟𝑒𝑛𝑡𝑠(𝑋𝑖 ))
(5.15)
5.2. Model selection Model selection is the process of finding the set of predictor variables that build the “best” model. A “good” model is generally considered to be one that explains the observed data well, generalizes to more data, and is as simple as possible (Hastie et al. 2009). In the following, some of the model selection techniques and entities commonly used in the field of occupant behavior modeling are briefly described.
5.2.1. p-value A p-value is a statistical concept for hypothesis testing. It is often used as a criterion for the significance of predictor variables in models. A predictor 𝑋𝑖 is assumed to contribute significantly to a model if its corresponding coefficient 𝛽𝑖 differs significantly from zero. This corresponds to the rejection of the following null hypothesis: 𝐻0 : 𝛽𝑖 = 0 (5.16) The p-value is the probability of obtaining the observed data or something more extreme under the null hypothesis (i.e., given that the parameter in question is zero). Hence, a low p-value indicates a high significance of the predictor. Usually, p = 0.05 is used as a significance threshold.
37
5.2.2. Maximum likelihood estimation With maximum likelihood estimation for some observed data x, we seek the statistical model that best describes the data. Plainly speaking, the premise of this theory is that, out of all potential data, the observed data are the most likely to occur. Therefore, one chooses that statistical model for which the observed data 𝑥 are most likely. We assume a statistical model expressed by a probability function 𝑃𝜃 (𝑥) that is known up to one or more parameters 𝜃. The probability function as a function of 𝜃 is called the likelihood function 𝐿(𝜃). The parameter that maximizes the likelihood function is called the maximum likelihood estimate (MLE): (5.17) 𝜃̂ = max 𝐿(𝜃) = max 𝑃(𝑥|𝜃) 𝜃
𝜃
For theoretical and practical reasons, the logarithm of the likelihood (log-likelihood) is usually maximized.
5.2.3. Akaike’s information criterion Akaike’s information criterion (AIC) is a measure of the relative quality of a statistical model. It is based on the MLE theory described above and favors models with a high likelihood, i.e., models that describe the observed data well. It also penalizes the model complexity, as expressed by the number of parameters k: (5.18) 𝐴𝐼𝐶 = −2(log 𝐿(𝜃̂) − 𝑘) AIC is widely used to compare the quality of two models (note that the minus sign implies models with lower AIC values are preferable). However, it cannot assess the absolute goodness-of-fit of a model, as the absolute value of the AIC has no physical meaning.
5.2.4. Bayesian information criterion The Bayesian information criterion (BIC) is closely related to AIC: 𝑘 𝐵𝐼𝐶 = −2(log 𝐿(𝜃̂ ) − ⋅ log 𝑛) 2
(5.19)
where n is the number of data points in 𝑥. There is no consensus in the literature as to whether AIC or BIC is generally preferred. As the BIC penalizes the number of model parameters more strongly, it favors simpler models more than AIC.
5.2.5. k-fold cross-validation Another well-established technique for model selection is k-fold cross-validation. Usually, a model is requested to perform equally well on the data used to infer the model as with data that are independent from those used for training. If this is not the case, the model may have been overfitted to the training data, which degrades the model predictive capabilities. Cross-validation is an attempt to overcome this problem by subsequently withholding some of the available data in the training stage and using these 38
data as a validation set. The available data are split into k (possibly equal) parts. Subsequently, the model is trained on the k-1 parts and validated on the remaining part. To choose one of several models with different predictor variables, one can compare the average performance of the k validation sets. A popular choice in the literature is k = 10. Once there are sufficient data to split into training and validation sets, k-fold cross-validation is a meaningful technique for model selection.
5.3. Occupancy models Occupancy has a significant impact on building environmental conditions (e.g., window opening and closing, turning on and off of lighting and HVAC systems) and building energy consumption (e.g., use of electrical appliances, heating, etc.). Occupancy is therefore a key factor in all other models inputs, and so the model for occupant presence is essential to develop these models. Markov chains have a wide range of applications in occupancy models (Table 5.2). The occupancy models of Richardson et al. (2008) and Page et al. (2008) are the earliest published examples of firstorder Markov chains being used to generate stochastic synthetic occupancy patterns. The first-order Markov chain technique has been widely adopted in the development of models of occupancy in office buildings (Wang et al. 2011, Liao et al. 2012, Andersen et al. 2014). To determine the lighting and heating requirements of a building, occupancy status at the space level is modeled alongside the number of occupants (Chang and Hong 2012). Wilke (2013) used first- and higher-order homogeneous Markov processes. The higher-order Markov process extends the first-order case by including multiple past values. This approach is coupled with a survival analysis method, as a Weibull distribution is used to estimate the presence durations from higher lags to the current time point. Hence, information about the next time step is not only based on presence information, but also on past values through the survival function that also captures the durations coherently. Table 5-2: Examples of occupancy models Publication
Scope (building typology)
Data used
Modeling approach
Page et al. (2008)
Household and office
Occupancy sensor data
Time inhomogeneous Markov chain
Richardson et al. (2008)
Household
Time use data
Time inhomogeneous Markov chain
Erickson et al. (2009)
Office
Dong et al. (2010)
Office
Wang et al. (2011)
Office
Wilke et al. (2013)
Household
Chang and Hong (2013)
Office
Mahdavi and Tahmasebi
Office
Wireless camera sensor data CO2 sensor, Cameras, PIR, others
Agent-based Hidden Markov Model
Non-homogeneous Poisson process High-order Markov chain Time use data Survival analysis Cumulative and probability Lighting-switch sensors distribution function Wireless ceiling-mounted Statistically aggregated Occupancy sensor data
39
(2014)
sensors (motion detectors)
Andersen et al. (2014)
Office
Feng et al. (2015)
Office
D’Oca and Hong (2015)
Office
Sangogboye et al. (2018) Commercial buildings
profiles; building systems control Inhomogeneous Markov Electrical ballasts chain with time step as triggered by PIR covariate Cumulative and probability Occupancy sensor data distribution function Single or dual occupancy Decision tree model; cluster data analysis Multiple resolution with Occupancy sensor PIR time-shift agnostic data classification
5.4. Window opening models In naturally ventilated buildings, window opening and closing behavior is an important control mechanism used by building occupants to regulate the indoor air quality, in addition to room air temperature. As building envelopes become tighter and better-insulated, window operations gain more importance. As transmission heat losses are decreasing, the share of ventilation losses on the overall energy consumption of a building has increased. Therefore, there is a high demand for window operation models that create realistic patterns for use in building energy simulations. Models for office buildings (Haldi and Robinson 2009, Fabi et al. 2014) and residential buildings (Schweiker et al. 2012, Calì et al. 2016, Andersen et al. 2013) have been suggested. Most current models were developed as inputs for building energy simulation tools. Based on a literature review by Fabi et al. (2012), D’Oca and Hong (2014) list the following potential drivers for window operation behavior:
Physical (indoor and outdoor environment); Psychological (preferences, attitudes); Physiological (age, sex); Contextual (type of environment where the occupants are located); Social (income, lifestyle).
Calì et al. (2016) found that, in residential buildings, the time of day is one of the most important predictors. This indicates that window operations might relate to certain activities or habits. The most common modeling approach for window operations is logistic regression as a special case of GLMs. In some cases, interaction terms between several predictors are considered. Time dependencies are modeled by Markov chains (Fabi et al. 2014, Calì et al. 2016), and survival analysis has been applied to model opening durations (Haldi and Robinson 2009). More recently, GLMMs have been used to model the diversity in the window opening behavior of occupants (Haldi et al. 2016). Fabi et al. (2014) developed different window opening and closing behavior models based on data from seven office rooms in Prague. Besides classic predictors such as temperature, relative humidity, and indoor CO2 concentration, they also took different volatile organic compounds (VOCs) into consideration in their analysis. Multiple logistic regression was applied as a modeling approach, and interaction terms between physical and contextual parameters, such as time of day and season, were 40
included in the analysis. A model selection based on AIC with forward and backward selection showed a tendency toward the classical parameters. They concluded that indoor temperature, indoor relative humidity, and outdoor temperature had the highest influence on window openings, whereas window closings were mainly driven by outdoor temperature. The effect of the VOC concentration was shown to be rather small. D’Oca and Hong (2014) used different data mining techniques to analyze the window opening and closing data of 16 offices in a building in Frankfurt, Germany. First, logistic regression together with a model selection procedure was applied to identify the most significant opening and closing drivers for each office. Additionally, the offices were clustered by the k-means algorithm with respect to the following:
predictor variables for openings; predictor variables for closings; window opening duration; number of window position changes per day; magnitude of the opening angle.
Finally, an association rule method was applied to extract two behavioral archetypes of the occupants; the first type preferred short openings, a passive operation rate, small opening angles, and were influenced by thermal parameters. The second archetype performed more frequent and longer window openings with larger opening angles, and their behavior was influenced by time-dependent factors. In a rigorous methodology, Calì et al. (2016) identified the most important drivers for window operations in residential apartments. Their analysis was based on data collected over a one-year period at one-minute intervals from 60 apartments with a total of 300 windows. The room air temperature, indoor CO2 concentration, room relative humidity, daily average outdoor temperature, outdoor relative humidity, and time of day were taken into consideration. Logistic regression with interaction terms between the continuous variables and the categorical variable (time of day; night, day, evening) was used as the modeling approach. Model selection was performed by a forward–backward algorithm with AIC. Additionally, 10-fold cross-validation was carried out to minimize the bias of the model. Out of 300 models for opening and closing, respectively, the most frequent common predictor variables were found to be the time of day and indoor CO2 (opening) and the daily outdoor temperature and time of day (closing). Counterintuitively, an increase in indoor CO2 was found to be correlated with a higher probability of closing. One explanation for this is that high CO2 levels are correlated with people’s presence, which is a necessary condition for window operation. The fact that the time of day is one of the most important predictors might indicate that window operation behavior is often influenced by certain activities or habits rather than environmental conditions. They conclude that “Occupants tend to open the windows at specific times of day (probably associated to activities) and when the CO2 concentration and relative humidity is elevated. They tend to close windows when it is cold outside and at specific times of day (probably associated with their activities).” Furthermore, significant differences in behavior according to room type (kitchen, bathroom, other) were found. Haldi et al. (2016) developed generalized linear mixed models (g = logit) for window openings, window blind usage, and light switching based on datasets from a Swiss office building and residential buildings in Germany and Denmark. The methodology had been suggested earlier by Haldi (2013). 41
The proposed models included random effects for all predictors. This allows the inter-individual variability to be described, i.e., the diversity in behavior among different occupants, instead of modeling the occupants’ average behavior. Hence, the models separate the variability in the data corresponding to occupants’ diversity from other sources of uncertainty. These kinds of models are especially useful for Monte-Carlo simulations, because an occupant is randomly drawn from a population in every simulation run, resulting in a spread of behavior that reflects reality. Furthermore, Barthelmes et al. (2017) explored a BN framework for modeling window control behavior in the residential sector. Their study addressed five key research questions related to modeling window control behavior: (i) variable selection for identifying the key drivers of window control behavior, (ii) correlations between key variables for structuring a statistical model, (iii) target definition for finding the most suitable target variable (window control actions rather than window states), (iv) BN model with the ability to treat mixed data, and (v) validation and demonstration of the high predictive power of stochastic BN models. An overview of different model approaches is given in Table 5-3. Table 5-3: Examples of window opening models Publication
Scope (building type)
Data used Office laboratory (LESO), Switzerland
Fritsch et al. (1990)
Office
Haldi and Robinson (2009)
Office
Schweiker et al. (2012)
Residential
Andersen et al. (2013)
Residential
Fabi et al. (2014)
Office
Offices in Prague, Czech Republic
D’Oca and Hong (2015)
Office
Offices in Frankfurt, Germany
Calì et al. (2016)
Residential
Apartments in Karlsruhe, Germany
Haldi et al. (2016)
Office and Residential
Barthelmes et al. (2017)
Residential
Office laboratory (LESO), Switzerland Swiss dwellings and Japanese dormitory Rented apartments and privately owned houses in Denmark
Offices in Switzerland, dwellings in Denmark and Germany Apartment in Copenhagen, Denmark
Modeling approach Markov chain dependent on ambient temperature Markov chain with logistic regression and survival analysis Bernoulli and Markov Markov with Logistic regression including interaction terms Markov with Logistic regression including interaction terms Logistic regression, k-means clustering, association rule Markov with logistic regression including interaction terms Generalized linear mixed effects model Bayesian networks
5.5. Window shading adjustment models There is a variety of window shading devices of different materials (aluminum, cloth), positions (interior, exterior), and appearances (Venetian blinds, vertical types). They have three main purposes: 1) to avoid or at least minimize situations of visual discomfort due to glare, 2) to reduce solar radiation entering the room, thereby reducing the thermal load, and 3) to provide privacy by blocking the view into the building from outside. Nevertheless, any one of these purposes can have a negative effect on 42
the other aspects. For instance, during wintertime, the usage of external blinds to avoid glare issues will reduce the solar input. On the other hand, during summertime, the usage of blinds to reduce solar radiation may interfere with aspects of visual comfort such as a clear view outdoors. Overall, window shading devices are at the intersection of thermal and visual comfort, together with the energy use for heating and cooling. Therefore, modeling their usage during the design process is extremely meaningful in terms of optimizing all these effects. Despite the importance of shading, there are fewer sun shading models than, window opening models (Table 5.4). Current methods can be grouped into those that model the shading state (or its change) as a binary outcome (open or closed) and those that model the shading device position (or its change). The statistical methods applied include descriptive analysis, linear regression models, and logistic regression models. Table 5-4: Examples of window shading models Publication
Scope (building type)
Data used
Reinhart (2004)
Office (State change)
Field data
Andersen et al. (2009) Haldi and Robinson (2008) Mahdavi et al. (2008)
Residential (Blind state) Office (Blind state) Office (Usage frequency)
Survey Field data Field data
Modeling approach Decision tree including logistic regression Logistic regression Markov chain Linear regression
5.6. Light switching models Lighting is a major electricity end use in domestic homes and office buildings. Because of fluctuations in daylight availability, lighting also causes most of the variation in both annual and diurnal demand (Stokes et al. 2004, Widén et al. 2009). Therefore, in recent years, there have been an increasing number of attempts to incorporate daylight into building designs (Zhu et al., 2017). Studies on the modeling of lighting energy use have mostly focused on small office and residential buildings, with the research findings greatly dependent on building layout and daylight control systems (Table 5-5). Studies have shown that the two main factors affecting lighting energy use are outdoor illuminance and occupant behavior (Zhou et al. 2015). One common method for predicting lighting energy use combines lighting power density information with lighting schedules. Hunt (1979) introduced a stochastic model to calculate the probability of turning on lights after the arrival of occupants. He concluded that the probability of occupants turning on lights increased when the illuminance of the working surface was below 100 lx. The first report of a stochastic approach to manual lighting control was by Newsham et al. (1995), who developed a model called Light-switch that simulated user occupancy in the workplace based on measured field data from an office building in Ottawa, Canada. Widén et al. (2009) used Markov chains to estimate the probability of occupant movement. The probability of turning on lights was modeled as a decision based on the lighting level and occupant movement.
Table 5-5: Examples of lighting models 43
Publication
Scope (building type)
Hunt (1979)
Office and UK school
Newsham et al. (1995)
Office
Stokes et al. (2004)
Household
Reinhart (1994)
Office
Richardson et al. (2008)
Household
Widén et al. (2009)
Household
Zhou et al. (2015)
Office
Data used Modeling approach Daylight level collected by Probit analysis; integrated time-lapse photography ESP-r and EnergyPlus Occupancy sensor and work place illuminances due to Markov chain daylight Half-hourly measured Object-based lighting power demand Occupancy sensor and workplace illuminance due Inverse transform sampling to daylight Occupancy time use data Markov chain nonand outdoor irradiance data homogeneous series Occupancy time use data Markov chain nonand lighting measured homogeneous indirectly with light sensors Measured lighting energy use data with sub-metering Poisson process systems
5.7. Thermostat adjustment models Occupants’ thermostat use behavior is one of the most influential factors in a building’s HVAC energy performance (Zhou et al., 2016). In the residential sector alone, thermostats control approximately 10% of the total energy use in North America (US DOE 2015, NRCan 2011). Although occupants in commercial spaces tend to have less control over their thermostats, it has been reported that individual control of the indoor temperature improves productivity and employee satisfaction (Fountain et al. 1996, Leaman and Bordass 2000, Wyon 2000). In response to these research findings, it is becoming widespread practice to provide a ±2–3°C of individual control over the default temperature settings in offices. Until recently, the lack of longitudinal thermostat use data from homes and offices meant that research on thermostat use behavior relied on surveys (Peffer et al. 2011, Karjalainen 2009). However, since the early 2010s, thermostat use data from both homes and offices have become available. Smart thermostat companies now provide access to residential thermostat use data. For example, the Donate Your Data program by Ecobee thermostats has provided access to many years of thermostat use data from over 10,000 homes in North America. In office buildings, thermostat use data have been collected through building energy management systems that archive the sensor data in building automation systems. In the reviewed literature, there are only a few statistical models for thermostat use behavior in homes and offices. For example, D’Oca et al. (2014) implemented a thermostat use model in building simulations using data gathered from 15 dwellings by Andersen et al. (2013). D’Oca et al. (2014) clustered occupants into active, medium, and passive users and trained multivariate logistic regression models to predict the likelihood of a set-point increase or decrease. For active users’ set-point increase behavior, their regressors were the time of day, indoor relative humidity, and the outdoor temperature. The active users’ set-point decrease behavior was predicted by looking at the outdoor 44
horizontal solar radiation. For medium users’ set-point increase behavior, the selected regressors were the outdoor temperature and the wind speed. In addition, their set-point decrease behavior was predicted by looking at the time of day. For passive users’ set-point increase behavior, the likelihood was a uniform distribution with no predictors, and their set-point decrease behavior was modeled as a function of the outdoor horizontal solar radiation. Another residential thermostat use model was introduced by Ren et al. (2014), who gathered air-conditioning unit usage data from over 30 apartments in China. They developed a three-parameter discrete Weibull distribution model to represent occupants air-conditioning usage, considering indoor temperature, CO2 concentration, and occupancy state as the model regressors. For office buildings, Gunay et al. (2017) developed a thermostat use model using data gathered from 38 private offices. Their dataset comprised concurrent thermostat keypress, occupancy, indoor temperature, relative humidity, and outdoor temperature records. They developed discrete-time and discrete-event Markov logistic regression models to predict the likelihood of a set-point increase/decrease action during occupied hours. They identified the indoor temperature as the best predictor among the three environmental variables of the dataset for the thermostat set-point increase and decrease actions. Although there was an improvement in the model with the addition of the outdoor temperature as a predictor, the indoor relative humidity did not improve the predictive accuracy. The parsimony of the models was assessed by looking at the AIC and BIC values, and the fit of the models to the dataset was assessed by looking at the p-value and standard error of each regressor and the pseudo R² values. With the increased availability of datasets, it is expected that more thermostat use behavior models will be developed for different building and occupant archetypes. The lessons learned from analyzing large thermostat use behavior datasets will have an impact on building operations practices and thermal comfort standards. Table 5-6: Examples of thermostat models Publication
Scope (building type)
Data used
Modeling approach
Ren et al. (1995)
Residential
Indoor temperature, CO2, and occupancy
Discrete Weibull distributions
Haldi et al. (2008)
Office
D’Oca et al. (2014)
Residential
Corgnati et al. (2014) Langevin et al. (2015) Gunay et al. (2017)
Residential
Office Office
Clothing and activity level, thermal sensation and preference, indoor temperature, outdoor temperature, thermal comfort vote Time of day, indoor relative humidity, outdoor temperature, outdoor horizontal solar radiation, wind speed Heating set point, indoor temperature, outdoor temperature Field comfort and behavior data Indoor temperature, outdoor temperature, relative humidity, occupancy
Logistic regressionbased model Markov chains with Logistic regression Model combined with incremental philosophy and probabilistic approach Agent-based model Markov chains
45
5.8. Appliance use models Occupants’ use of household electrical appliances is an important aspect in understanding behavior in domestic buildings and has received significant interest for building simulations (Swan and Ugursal 2008, Grandjean et al. 2012). Researchers have developed methods to predict the temporal evolution of appliance electricity demand with different time- and space-scale considerations. Occupant behavior models of household electrical appliance use have been used in many applications, such as: i) better predictions of time variations in the demand and peak power demand for analyzing the impact of energy-efficiency schemes or to examine the demand response following modifications to the network load flows after the integration of renewable energy sources (Yamaguchi et al. 2011, Paatero and Lund 2010, Gottwalt et al. 2011); ii) heat-gain models for estimating the performance of lowcarbon buildings (Hoes et al. 2009); and (iii) studying the impacts of Plug-in Hybrid Electric Vehicle charging and discharging on residential demand profiles at specific times (Grahn et al. 2013, Paevere et al. 2014). For appliance models, an approach has been formulated in which the switch-on times of the appliances are determined via Monte Carlo simulations. Appliance models are often linked with an occupancy models, whereby an appliance is only switched on if there is at least one occupant present in the household (Page 2007, Richardson et al. 2010, Wilke et al. 2012). Table 5-7 summarizes the studies that have modeled activities related to electricity, appliance usage, and appliance electricity demand. Table 5-7: Examples of appliance models Publication
Model
Scope (building typology)
Data used
Appliance electricity Household Time use datasets demand Yamaguchi (2003) Electricity demand Office Statistical data Paatero and Lund Appliance electricity Household Statistical data (2006) demand Appliance usage and Monitored appliance Page (2007) Household and Office electricity using sensors Tanimoto et al. (2007, Heating and air Household Time use datasets 2008, 2011, 2012) condition usage Fans, cold drinks, Clothing and activity Haldi et al. (2008) activity and clothing Office level, adaptive action model Widén and Wäckelgård Appliance usage and Household Time use datasets (2010) electricity Appliance usage and Richardson et al. (2010) Household Time use datasets electricity Appliance usage and Gottwalt et al. (2011) Household Statistical data electricity Wilke et al. (2013) Appliance usage Household Time use datasets Fan, heater, and Field comfort and Langevin et al. (2015) Office window use behavior data Plug load data, PIR Mahdavi et al. (2016) Plug loads Office data Monitored appliance Yilmaz et al. (2017) Appliance usage Household using sensors Capasso et al. (1994)
Modeling approach Monte Carlo Markov chain Monte Carlo Monte Carlo Markov chain Logistic regression First-order Markov chain Monte Carlo Monte Carlo Monte Carlo Agent based Weibull distribution Monte Carlo
46
5.9. Modeling the diversity of occupants To date, most occupant modeling research has focused on developing occupancy and occupant behavior models for typical occupants or households. While stochasticity and uncertainty have taken hold in the past decade, we may be failing to capture one of the greatest sources of uncertainty—the details of individual occupants and the diversity between them. This is evidenced by many occupant simulation studies that indicate a much smaller simulated range in possible behaviors than has been measured in reality (O’Brien and Gunay et al. 2016, Pisello et al. 2017). While one source of the common “gap” between measured and modeled energy performance of buildings is occupant behavior, another cause for this discrepancy is the modeling of average occupant behavior rather than explicitly recognizing their diversity (Dar and Georges et al. 2015). As a result, existing models have a limited ability to test the robustness of building designs and other applications of occupant modeling that require an understanding of the probabilistic distribution of predicted building performance. The prevalent modeling approaches for representing diversity are: (1) developing occupant types (e.g., “passive” and “active”) and having discrete models or model coefficients for each type or (2) using a mixed modeling approach (e.g., LMMs) whereby a so-called random effect is used to describe interoccupant diversity. The former method, which has been applied since the early 2000s (Reinhart 2004), is more intuitive, tangible, and generally requires fewer simulations to model a population. However, it is not clear whether occupants can truly be discretized into types and what the appropriate ratio between types is for a given population. The newer LMM approach resolves the last two drawbacks of the discrete occupant type modeling methods. LMMs also provide continuous distributions and allow the impact of multiple behavioral domains to be propagated using Monte Carlo simulations. However, the LMM approach is likely to require a greater number of simulations than when only a few occupant types are modeled. Table 5-8 summarizes the modeling approaches used to represent the diversity of occupants. Table 5-8: Examples of modeling the diversity of occupants Publication
Model
Scope (building typology)
Data used
O’Brien et al. (2016)
Office occupancy
Private office
Event-based occupancy data
Haldi et al. (2016)
Operable windows, window shading devices, electric lights
Window opening, blind adjustments, Schweiker et al. (2016) usage of ceiling fans, and clothing behavior
Homes and offices
Office
Modeling approach Markov chain with linear mixed effects model
Monitored operable window, window Markov shading device, and chain with light state and generalized corresponding indoor linear mixed and outdoor effects environmental models conditions Monitored operable window, window shading device, ceiling Multivariate fan state, clothing logistic and insulation level, indoor linear mixed and outdoor effects model environmental, psychological traits
47
5.9.1. Occupant diversity modeling research This section summarizes three recent papers on the topic of occupant diversity modeling. The first two are statistical approaches that quantify the distribution of occupant characteristics, while the third analyzes patterns from a priori defined groups of occupants. O’Brien et al. (2016) used a multi-year occupancy dataset from 16 private offices to investigate three hypotheses: 1) parameters that define individual occupants have continuous rather than discrete distributions; 2) occupant models that are derived from aggregate data of multiple occupants results in suppressed diversity; and 3) randomly drawing from multiple occupant trait distributions will lead to unrealistic synthetic occupants. The third hypothesis requires a brief summary of the mixed modeling method. The simulation approach involves two steps: i) generate a synthetic occupant from the model parameter distributions (assumed to be normally distributed) that were estimated from the sample of 16 occupants, and ii) simulate each individual synthetic occupant (and repeat numerous times for Monte Carlo analysis). Hypothesis 3 refers to the fact that, in the first step, the failure to maintain correlations among occupant parameters (e.g., probability to start a long absence and likelihood of coming or leaving at a given time step) between the observations and synthetically generated data will result in unrealistic synthetic occupants. The method used by O’Brien et al. followed a similar occupancy modeling approach as that of Page and Robinson et al. (2008). The results showed that the parameters defining the occupancy patterns of the 16 occupants have a relatively continuous distribution and do not form clusters (hypothesis 1). When model parameters were extracted from the aggregated occupancy data, the resulting model closely resembled the mean occupant, but failed to reproduce the measured diversity (hypothesis 2). The parameter correlations among the 16 occupants showed some significance. For instance, occupants who tend to arrive early in the morning also have a lower probability of taking a day-or-longer break. As a result, randomly selecting parameters from each parameter distribution yielded some unrealistic synthetic occupants; this was not observed to the same extent when parameter correlations were maintained (hypothesis 3). This study provided some preliminary evidence that current practice requires new methods to model diversity. It also indicated the need for greater sample sizes to reach stronger conclusions for occupancy and other related domains. Haldi et al. (2016) sought to generalize the discrete-time Markov chain modeling approach of previous efforts (Haldi and Robinson 2009, 2010) to incorporate diversity between occupants. Their study used three datasets from offices and residential buildings across Europe: 1) offices in Lausanne, Switzerland, 2) apartments in Copenhagen, Denmark, and 3) apartments in Baden Wuerttemberg, Germany. The occupant-related domains included operable window, lighting, and window blind use. For all of these domains, two methods were compared: (1) the GLM approach, whereby all occupant data were first aggregated and (2) the GLMM (or LMM, as defined in Section 5.2.3) approach, whereby each occupant was modeled separately and then the regression parameters (assumed to be normally distributed) were computed. An example of the two approaches is illustrated in Figure 5-2. The GLMM approach was found to yield standard parameter errors of approximately three to five times those of the classical GLM approach. This indicates that the new approach is much more suitable for representing true inter-occupant diversity. Haldi et al. (2016) also recognized the consequences of overweighting certain occupants in the classical GLM approach and that this could be
48
resolved by the mixed model approach. Overall, Haldi et al. (2016) reached many of the same general conclusions as O’Brien et al. (2016).
Figure 5-2: Comparison of classic modeling approach and mixed model with random effects approach, where each green line represents a logistic regression curve for an individual occupant’s probability to open their window as a function of indoor CO2 concentration Schweiker et al. (2016) analyzed data from experimental studies in Germany. In contrast to the studies described above, the dataset was divided into subsets before the statistical analysis of behavioral patterns. The subsets were defined based on personal characteristics of the subjects; more specifically, whether the subject had a high or low value of a specific personality trait. In psychology, a trait is a specific characteristic of an individual’s personality that is stable over a longer period. The personality traits of neuroticism, extraversion, openness to new experiences, and general self-efficacy were defined. By means of multivariate logistic and LMM analyses, it was shown that all personality traits lead to significant differences between behavioral patterns for window opening, blind adjustments, usage of ceiling fans, and clothing behavior. Thereby, it was shown that this approach could be helpful for understanding the behavioral patterns of specific subgroups, e.g., to understand the behavioral patterns of the elderly when designing a home for the elderly. At the same time, such an attempt— scarce as it is—may help to explain the underlying mechanisms of occupant behavior.
5.10. Occupant behavior modeling summary The chapter has described the techniques commonly used for modeling occupant behavior. The modeling approaches include general and generalized linear models, mixed effects models, linear time 49
series models, (hidden) Markov chains, and Bayesian networks. A “good” model is generally considered to be one that explains the observed data well, generalizes to more data, and is as simple as possible. To arrive at such a model, a process of model selection is used to find the set of predictor variables that build the most appropriate model. The use of different modeling approaches was exemplified by describing some of the major modeling approaches in the literature, divided into different the behaviors and presence types for which they were developed. Occupancy modeling aims to determine the occupants’ presence either as the occupancy status at the space level or as the number of occupants in a building. Typical approaches use Markov chains or inverse transform sampling. Numerous window opening models have been introduced as input for building energy simulation tools. Markov chains, generalized linear models, generalized linear mixed effects models, and Bayesian networks have been used to model window openings in residential and office buildings. Window shading models are less common. The typical approach is to use logistic or linear regression and Markov chains. Models of occupants’ light switching behavior have mostly focused on small offices and residential buildings. The typical approach is to use Markov chains and Poisson processes. The relatively few statistical models for thermostat use behavior in homes and offices rely on Markov chains and discrete Weibull distributions. In most models of appliance use, the switch-on times of the appliances are determined via Monte Carlo simulation. The models often rely on Markov chains, and many occupant behavior models use data that have been aggregated over dwellings, offices, or occupants. As a result, the models may fail to capture details of individual occupants and the diversity between them. The final part of this chapter discussed modeling approaches that capture diversity amongst occupants through examples from the literature. This topic remains a challenge and deserves further research.
5.10.1.
Occupant behavior modeling nomenclature
P
probability measure
Y
outcome variable
X
input variable, regressor, predictor, explanatory variable, fixed effect
β
regression parameters
U
random effects
Z
random effects parameters
n
number of observations
k
number of model parameters
θ, φ
model parameters
μ
mean value
σ
standard deviation
50
Σ
variance-covariance matrix
ε
model residuals
g
transfer function
logit
logit function
Γ
transition probability matrix
AIC
Akaike’s information criterion
BIC
Bayesian information criterion
H0
null-hypothesis
p
p-value
51
6. Evaluation of Models This chapter of the report primarily concerns the necessary conditions for the systematic evaluation procedures as targeted toward models of occupants' presence and actions in buildings. To appreciate the critical importance of this issue, a brief reminder of the role of inhabitants' models in the larger context of building performance simulation is reported.
6.1. Model evaluation background Building performance simulation models typically require information to be input regarding the context (climate), building geometry, construction, systems, and internal processes. Whereas the specification methods for physical building components and properties (pertaining, for example, to building fabrics and construction) in building performance simulations are fairly well established, representations of occupants (presence, movement, behavior, perception, and evaluation) are frequently rudimentary. It has been suggested that simplistic representations of people as passive and static entities have diminished the reliability of building performance assessments and building operation planning processes (e.g., D’Oca et al. 2014, Liang et al. 2016). Adequate representations of building inhabitants must address building occupants’ passive presence in more detail, as well as the multi-dimensional scope and dynamic nature of their actions (e.g., interactions with buildings’ indoor environmental control devices and systems). A further, related phenomenon that needs to be considered in any model development activity is the occupants’ behavioral diversity (Mahdavi and Tahmasebi 2015a, O’Brien et al. 2016, Haldi et al. 2016). In the past, representations of buildings’ occupants in performance simulation models have mostly consisted of fixed schedules (so-called diversity profiles) and rule-based action models. As such, it has been argued that these kinds of representations do not realistically reflect the inherent temporal fluctuations of occupancy-related processes and events (e.g., entering, leaving, and moving in buildings, operation of devices such as windows, blinds, luminaires, manipulation of control setpoints, equipment usage). Thus, there have recently been a considerable number of efforts—especially by professionals in the building performance simulation community—to develop more sophisticated dynamic models of occupant presence and actions in buildings in terms of stochastic algorithms (for example, reviewed by Parys et al. 2011) and agent-based representations (e.g., Langevin et al. 2015, Chen et al. 2016). A significant number of such efforts have focused on the potential of probabilistic methods and associated formalisms. Thereby, a stated objective has been to replace fixed schedules and rule-based actions models in performance simulations with high-resolution probabilistic models. A number of such models have been incorporated in building performance simulation applications. Such efforts are undoubtedly important. However, they have not been immune to a number of misconceptions regarding model evaluation and application considerations (Mahdavi 2011, 2015; Mahdavi and Tahmasebi 2016b). At times, models have been prematurely promoted as valid and reliable, despite a lack of empirical evidence and information regarding the downstream deployment scenarios. The 52
inclusion of sophisticated and realistic behavioral models in building performance assessment applications is of course desirable, but must proceed in a careful and systematic manner, lest confusion and poor decision making result, e.g., from the uncritical implementation and application of all kinds of insufficiently tested behavioral models. Given this background, the present section is primarily motivated by the lack of general procedures and guidelines for the evaluation of user-related behavioral models. To encourage a deeper discourse in this area, we specifically formulate a number of conditions that are necessary for the systematic and dependable enrichment of building performance assessment applications with behavioral representations of buildings’ occupants. To this end, we use a number of the assertions and findings formulated by Mahdavi and Tahmasebi (2016b). We discuss both general model evaluation requirements and specific circumstances pertaining to models of building occupants. The section concludes with a case study to illustrate exemplary model evaluation processes (Tahmasebi and Mahdavi 2016). Given the rapidly evolving state-of-the-art in the area of occupancy-related model development and the integration of models into the workflows pertaining to the building delivery process, it is unlikely that ultimate and definitive guidelines for model evaluation can be formulated at this time. The case study is intended to illustrate potentially paradigmatic model evaluation steps by comparing a number of recently proposed behavioral models. The main objective is to present and promote a rigorous process toward quality assurance while considering and integrating behavioral representations in building performance assessment tools and practices.
6.2. General principles concerning model evaluation A central tenet of scientific activity is the development of models to describe phenomena and predict events. Despite the persistence and historical evolution of model development activity across a variety of scientific disciplines (e.g., Hulley et al. 2013, Oleckno and Anderson 2002), a brief treatment of the question of model validation in the context of occupancy-related behavioral models would be beneficial. Note that a considerable number of shortcomings in the recent development and evaluation efforts regarding behavioral models are the consequence of the following three circumstances: Firstly, systematic occupancy-related studies in the context of the built environment belong to a relatively young field of inquiry. Note that the strength of research standards in a specific domain typically results from the expected utility and a critical mass of projects and researchers in that domain. Compared to many other areas of scientific inquiry (such as physics, biology, and medical sciences), research pertaining to occupant behavior in buildings is much less developed. A closer instance for comparison purposes would perhaps be research on human comfort in general and thermal comfort in particular. The latter has a longer tradition and is arguably better established, but many open research questions and challenges persist (Schweiker and Wagner 2016, Shipworth et al. 2016, Mahdavi et al. 2016). Secondly, a persistent problem for both model development and model evaluation lies in the rather limited availability of large-scale observational data. Consequently, the demographic basis of the majority of proposed behavioral models is often extremely small. The coverage and representativeness of behavioral models of building occupants depends on the 53
availability and fidelity of observational data. As such data are still hard to come by, models are often developed and disseminated with insufficient empirical backing. This circumstance has also affected the aforementioned thermal comfort research, albeit to a lesser degree. Thirdly, behavioral models require—in principle—the concurrent consideration of multiple physical, physiological, psychological, and socio-cultural parameters. To conduct field or controlled studies addressing this complex pattern of potential causal factors is anything but trivial. The multifarious nature of potential influences and contributory factors to behavior actions creates a “background noise.” Against this background, it is often difficult to discern the typically low-strength “signal” of causal factors hypothesized to be behind behavioral manifestations (Mahdavi et al. 2016). Obviously, a number of the abovementioned challenges in behavioral model development and evaluation cannot be met in the short run. The collection of vast amounts of reliable observational data in the course of field studies is laborious, time-consuming, and costly, and can be hampered by legal and ethical constraints. Likewise, conducting experimental behavioral studies is exceedingly difficult and the corresponding results cannot be readily generalized. This, however, does not mean that the invested community cannot improve the related conditions and processes. To this end, a critical assessment of past efforts in model development and application is essential. Specifically, avoiding certain common misconceptions would help to guide the behavioral modeling discourse in a more solid direction (Mahdavi 2015). Some of the key issues may be formulated as follows: 1. Model accuracy. Arguments pertaining to certain occupancy-related modeling approaches frequently display a certain confusion of simulation (computational, typically dynamic representation of a system’s behavior) with prediction. Long-term exact predictions of buildings’ energy and thermal performance are unrealistic, even under the speculative assumption that the internal (occupancy-dependent) processes could be accurately modeled. As an analogy, the long-term unpredictability of external weather conditions falsifies claims of exact predictions. A more reasoned view of performance simulation appears to lie in its utility toward complex system analysis, rather than accurate long-term predictions. As such, it is important to understand that the frequent mismatch between simulation-based predictions and observations of energy use (the so-called performance gap) is not necessarily, automatically, or exclusively due to behavioral factors. Long-term accurate predictions of building performance indicators are difficult to make because of the extensive list of uncertainties pertaining to internal (occupancy-related) processes and external conditions, as well as assumptions regarding building fabrics and building systems. 2. Terminology. In model comparison and evaluation discourse, the term “deterministic,” which has a weighty philosophical baggage (Mahdavi 2015), is often used in a potentially misleading manner to characterize fixed diversity profiles (e.g., assumed fixed schedules of occupants’ presence) and rule-based behavioral models. From this inaccurate terminology, the inference is then made that building simulation results would necessarily be more “accurate” if occupancy-related diversity profiles and rule-based assumptions were simply replaced with 54
more detailed probabilistic ones (e.g., Tahmasebi and Mahdavi 2015, 2016). There is no conclusive empirical evidence that specific modeling formalisms automatically result in more accurate building performance simulations. 3. Value in different model methods. A class of occupancy-related modeling efforts follow the notion that “people behave randomly,” and hence can exclusively be represented in simulation models via stochastic formalisms. There is nothing wrong with constructing data-driven blackbox models of occupants’ control actions, nor is there anything wrong with the use of probabilistic methods to generate realistic occupancy-related patterns. In fact, many valuable lessons can be learned from the careful deployment of probabilistic modeling techniques in the representation of occupants in building performance simulations. However, this does not point to the absence of a motivational (and potentially causally effective) field shaped by physiological, psychological, and social factors. Hence, efforts toward developing grey-box (or even white-box) behavioral models are both warranted and potentially illuminating. 4. Model validation. Any statements about the validity of specific behavioral models can only be assessed on the basis of carefully prepared documents of the model development and evaluation procedures (such as research design, empirical basis, hypotheses and assumed causal factors, and limitations). This should enable any independent attempts to retrace, comprehend, and reappraise such procedures. Moreover, behavioral models should not claim to be generally “validated” based on a limited set of observational data. Specifically, datasets for model development and model evaluation should not be conflated. Paucity of empirical information does not justify testing a model based on the same dataset used for its development. 5. Extrapolation. It is important not to carelessly extrapolate from a single limited behavioral study to all kinds of populations, building types, locations, and climates. This is especially critical in the case of black-box models, which typically lack explicit causal explanations. 6. Peer evaluation. Similar to other domains in which model evaluation is critical, the behavioral modeling field must safeguard against bias. Internal evaluation by model developers does not provide conclusive evidence for a model’s general reliability. While not easy to conduct, external evaluation procedures, double-blind studies, and round-robin tests are undoubtedly useful in supporting the evaluation of a model’s performance. 7. Underlying data quality. It is of great importance to exercise care when incorporating insufficiently documented and poorly tested behavioral models in broad-scale simulation applications, lest potential users are misled into assuming such models necessarily capture the “reality” of occupants’ presence and behavior in buildings. A more concrete treatment of a number of the abovementioned issues is given later in this section through a paradigmatic case study (see section 6.6). However, prior to the case study, two specific 55
challenges regarding model verification in the building performance evaluation domain need to be addressed: Fit-or-purpose simulation. The reliability and appropriateness of a specific behavioral model cannot be discussed in isolation from the specific circumstances of its deployment in the simulation-assisted building performance evaluation workflow. In other words, building simulations can be deployed at very different stages of the building delivery process and for very different purposes. Consequently, it would be misguided to assume that a specific modeling approach or technique can be appropriately applied to all kinds of use cases (see Gaetani et al. 2016, Mahdavi and Tahmasebi 2016a). Given the significance of this point, it is treated in more detail in section 6.3. Predictive performance. The “feedback” circumstance in occupant behavior models involving indoor environmental explanatory variables poses a specific challenge for model evaluation efforts. As such, the output of behavioral models (i.e., states of devices) influences the inputs (i.e., indoor climate conditions). Obviously, empirical data cannot be obtained for every possible sequence of actions predicted by behavioral models. Section 6.5 addresses some of the approaches that have been adopted to evaluate the predictive performance of occupant behavior models.
6.3. Deployment dependence of model evaluation Performance simulation models can have different levels of resolution with regard to the representation of the underlying (physical) phenomena, required (input) information, and results (output). The choice of a specific level of resolution is generally dependent on the problem being solved by the simulation model. In this context, an important case in point pertains to possible choices of the type and resolution of representations of occupants’ presence and behavior in building performance simulation models. The relationship between these choices and the purpose of the simulation-assisted analyses is not well understood. This, however, represents a practical problem, as it implies that adopted methods in capturing occupants’ presence and behavior in a simulation process may in fact be unsuited to the specific simulation scenario. Likewise, it can be argued that the criteria for the evaluation of the representational fidelity of occupants’ presence and behavior in buildings are dependent on the types of studies undertaken in the course of deploying the simulation tool. Few studies have explicitly addressed the fitness of occupancy-related models with regard to different simulation queries. In a different context, Gupta and Mahdavi (2004) first proposed a perspective for viewing and structuring the performance queries in terms of a multidimensional query space. The classification of queries was intended to render them more suitable for analysis, resulting in enhanced responses through the selection and execution of appropriate computational tools and techniques. Specific to the deployment of occupancy models, Hoes et al. (2009) used sensitivity analysis to arrive at the minimal required user model resolution with regard to a number of building performance indicators and design parameters. That is, when a performance indicator is determined to be more sensitive to occupancy-related assumptions, the simulation effort should start with a more sophisticated model of occupancy (and if the performance indicator still does not fall within the required target value range, a higher resolution level should be applied). However, the focus of their 56
study is on the design stage and empirical data are not used to confirm the conjecture that more sophisticated models would necessarily provide more accurate results. Given the multitude of scenarios (i.e., use cases involving different users, different phases of the building delivery process, different queries) in which building performance simulations can be deployed, a well-structured conceptual framework with a multi-dimensional simulation deployment space is of utmost importance. Such a framework is not only a prerequisite for establishing a solid basis for evaluating the suitability of alternative modeling techniques and resolutions with regard to occupants’ presence and behavior in buildings, but also contributes to substantiating the evaluation process of such modeling techniques. Table 6-1 briefly outlines nine dimensions that are directly relevant to the selection of appropriate occupancy-related models (Mahdavi and Tahmasebi 2016). Table 6-1: Dimensions of the proposed simulation deployment space Dimension
Remarks/examples Early design, detail design, HVAC systems design, building operation Parametric study of design options, generation of energy compliance documents, HVAC system sizing, HVAC controls
i
Phase in the building delivery process
ii
Purpose (or nature) of the study
iii
Domain (discipline)
Energy, thermal comfort, lighting, acoustics, fire safety
iv
Building type
Dominant function of the building (residential, commercial, educational, mixed use)
v
Indoor climate control strategy
Passive, hybrid (mixed mode), fully air-conditioned
vi
Physical destination
Building details, whole buildings, campus, district, urban
vii
Spatial resolution
Whole building, individual floors, orientations, micro-zoning
viii
Performance indicator (results)
Annual heating/cooling demand, peak heating/cooling loads, predicted mean vote (PMV)
ix
Temporal resolution (horizon)
Entire lifecycle, annual, monthly, daily, hourly, sub-hourly
To demonstrate and elaborate on the desirability and usability of such a framework, Mahdavi and Tahmasebi (2016a) tested specific case studies involving probabilistic and non-probabilistic occupancy models. Their findings suggest that we cannot simply declare a priori that a particular modeling technique for generating occupancy-related input information for performance simulations is superior to others. Rather, we must carefully consider the circumstances pertaining to the nature of the application scenario, such as the time horizon of predictions or the granularity of performance indicators. In other words, there are good reasons to suggest that the choice of an appropriate occupancy model and the criteria for evaluating its performance depend on the position of the relevant simulation-based query within the proposed application space.
6.4. Evaluation statistics One of the fundamental challenges of evaluation procedures for behavioral models of building inhabitants pertains to the paucity of systematically classified model performance metrics. The professional community has arguably not converged toward a systematic and expressive set of 57
statistics for quantifying the predictive performance of behavioral models. Some of the reasons for this were alluded to in the introductory sections. Given the variety of domains and application scenarios of behavioral models, identifying a definitive set of evaluation statistics is unlikely to be a trivial undertaking. Whereas an ultimate ontology of fit-for-purpose metrics for behavioral model evaluation cannot be provided here (and may be ultimately unattainable), a potentially important first attempt can be made. Behavioral models typically aim to predict “states” and “events” (or “actions”). In this taxonomy (Mahdavi 2011), events can be system-related (e.g., switching lights on/off) or occupancy-related (e.g., entering or leaving a space). States can refer to systems (e.g., position of shades/windows), indoor environments (e.g., temperature, illuminance), outdoor environments (e.g., solar radiation), and occupants’ presence (i.e., present versus absent). The central step in model evaluation is to compare predicted and monitored events and states. From the large number of indicators used in previous evaluation studies of occupant behavioral models (as well as in studies in related fields such as thermal comfort), two broad categories can be inferred: (i) indicators addressing aggregate aspects of the models’ predictions and (ii) indicators addressing the interval-by-interval congruence between predictions and measurements. Whereas the first category “vertically” aggregates observations and predictions independently before the overall comparison, the second category first compares time series data pairs “horizontally” prior to further statistical processing (Mahdavi and Tahmasebi 2016b). Illustrative listings of these indicators are provided in Figure 6-1. In this framework, indicators that address aggregate traits of the predictions (such as the total number of actions, median state durations) are grouped with indicators that address the proximity of predicted probability distributions to those of the measured ones (such as the Jensen–Shannon divergence) (Fuglede et al, 2004).
58
Figure 6-1: Categories, aggregation structures, and example indicators for occupant behavior model evaluation (Mahdavi and Tahmasebi 2016b) Superior performance in terms of aggregate indicators is specifically desired in simulation studies geared at performance levels over longer periods of time (such as the conventional use of building performance simulation models for estimating annual energy demands). However, it can be argued that the indicators resulting from an interval-by-interval comparison of predictions and measurements are of more interest when short-term performance predictions play a central role (e.g., predictive building systems control).
6.5. Addressing model feedback in evaluation process As stated before, the inherent feedback in occupant behavior models with environmentally relevant indoor explanatory variables poses a challenge for model evaluation efforts. Specifically, the output of behavioral models (for instance, window states) influences the input (for instance, indoor temperature). Of course, it is logically impossible to obtain empirical data matching every possible
59
sequence of actions predicted by behavioral models. In this regard, different approaches have been adopted to evaluate the predictive performance of occupant behavior models. Some model evaluation studies (e.g., Schweiker et al. 2012, Fabi et al. 2015, Wolf et al. 2017) have neglected the feedback in occupant behavior models. Hence, the model predictions at each time interval do not have any impact on the indoor environmental factors for the next interval. This omission can render the validation of behavioral models inconclusive. For example, in evaluating a number of stochastic and non-stochastic window operation models, Tahmasebi and Mahdavi (2016) showed that running two stochastic models without considering the feedback led to a large overestimation of the fraction of time windows were open and the opening duration. In real circumstances, opening windows results in the room temperature dropping, which in turn causes the windows to be closed. In other words, without considering the model feedback, the opening of windows does not reduce the indoor air temperature and is therefore not followed by a closing action. In the same study, neglecting the feedback also countered the tendency of singlethreshold non-stochastic models to predict an unrealistically large number of actions. According to these models, windows are operated as soon as the temperature falls below or rises above a certain threshold, which in reality (including feedback) would result in a large number of opening and closing actions. Given these circumstances, the use of calibrated building performance models may represent an alternative for the evaluation of occupant behavior models (Tahmasebi and Mahdavi 2016). Thereby, calibrated building models serve as virtual representations of buildings that can emulate the response to the predicted occupant behaviors. The development of highly accurate calibrated building models requires extensive input data pertaining to the outdoor environment as well as the physical and operational characteristics of the building. Other approaches to occupant behavior model evaluation do not require the inclusion of feedback, but focus on specific aspects of the model predictions. One method relies on discontinuous model runs. Thereby, as opposed to the aforementioned two approaches, the predicted state of the environmental control device at each time interval is not inherited in the next time step. Thus, at each time interval, the model is fed with the monitored state of the device in addition to the explanatory environmental parameters. The predicted state of the device is then compared with the measured state in the next time interval. In this scenario, there is no need to include the model feedback. However, this model cannot capture the intended continuous behavior in which state predictions for a time step have implications for the subsequent intervals. Consequently, this method can only capture the model performance in correctly predicting the device states at specific intervals and not the overall performance across time frames such as a day or a season. Another evaluation approach that does not require feedback uses the predicted action probabilities instead of the resulting states or actions (see, for example, Fabi et al. 2015). Thereby, the overall performance of the model is derived in terms of the sum of the interval-by-interval differences between predicted action probabilities and observed actions. This approach does not require Monte Carlo simulations of the model or the inclusion of model feedback. However, the comparative interpretation of the cumulative differences derived from this method is not necessarily
60
straightforward. Likewise, the method does not yield specific insights about model performance issues such as the state duration of devices or frequency of actions in specific time periods.
6.6. Case study: evaluation of window operation models This section addresses some of the aforementioned considerations based on a specific illustrative case study of behavioral models. The material for this case study is taken from a paper that explored the reliability of various models pertaining to occupants’ operation of windows for natural ventilation in buildings (Tahmasebi and Mahdavi 2016). In the present context, the results are not of particular interest in the original narrow sense of model comparison, but the case study allows us to elaborate on a number of central model evaluation issues. Note that the case study itself has a number of key limitations (e.g., small set of reference empirical data from only one location, small number of models considered). One could argue that, strictly speaking, models cannot be “validated,” even with large amounts of affirmative evidence. A single counter-example, in contrast, would suffice to “falsify” a model. This is not the point of the case study. In the domain under discussion (assessment of occupants’ behavioral models), it would be unwise to set unrealistically high standards regarding the predictive performance of a model. Consequently, the treatment of this case study’s material does not definitively evaluate the selected models. For such an objective, neither the original empirical basis upon which those models were developed nor the empirical basis we use to examine their performance are sufficient. The case study has a different purpose: the structure and embedded procedure of this external evaluation of a number of window operation models provide a useful context for addressing a number of the aforementioned model evaluation challenges.
6.6.1. Window operation models selected As a case in point, the following external evaluation specifically addresses the performance of window operation models. We studied three existing stochastic and three simple non-stochastic models. The stochastic models (referred to here as A, B, and C) are derived based on occupant behavior in office buildings and are widely referenced in the building performance simulation community. They are all Markov-chain-based logistic regression models that estimate the probability of window opening and closing actions based on the previous window state and a number of occupancy-related and environmental independent variables. The non-stochastic models (referred to as D, E, and F) are defined based on simple rules according to common practice in building performance simulation tools without the integration of stochastic models; for example, models D and F are integrated in EnergyPlus. In our study, we also included variations of models A and C (denoted as A* and C*), as the original models did not capture a key behavioral feature in the building under study (inhabitants are requested not to leave the windows open when they leave the office because of the risk of storm damage). In addition, we considered two benchmark pseudo-models (denoted as G and H) whose purpose is to 61
clarify the performance of the selected models. For the sake of clarity, a brief description of the aforementioned models is provided below: Model A, developed by Rijal et al. (2007), estimates the probability of opening and closing windows based on the outdoor and operative temperatures when the operative temperature is outside a dead-band (Comfort temperature ± 2°C). This model is derived based on data obtained from 15 office buildings in the UK between March 1996 and September 1997. Model A*, a variation of Model A, always returns a closing action upon the departure of the last occupant. Model B, developed by Yun and Steemers (2008), is based on summer data (from June 13 to September 15, 2006) obtained from a naturally ventilated office building in the UK without nighttime ventilation. It estimates the probability of opening windows upon first arrival and the probability of window opening and closing actions within intermediate occupancy intervals (i.e., after first arrival and before last departure) based on indoor temperature. Model C, developed by Haldi and Robinson (2009), estimates the probability of opening and closing actions at arrival times (first and intermediate ones), intermediate occupancy intervals, and departure times (intermediate and last ones) based on a number of occupancy-related and environmental independent variables (see Tahmasebi and Mahdavi (2016) for a list of independent variables and the original and adjusted estimates of the coefficients used in this study). This model was developed based on data obtained from 14 south-facing cellular offices in a building located in a suburb of Lausanne, Switzerland, from December 19, 2001, to November 15, 2008. Model C*, a variation of Model C, always returns a closing action upon the departure of the last occupant. Model D, a non-stochastic model, operates as follows: windows are opened if the indoor temperature is higher than the outdoor temperature and the indoor temperature is higher than 26°C. Otherwise, the windows are closed. Model E, a non-stochastic model, can be specified as follows: windows are opened if the indoor temperature is higher than the outdoor temperature and higher than 26°C. Windows are closed if the indoor temperature is lower than 22°C. Model F, a non-stochastic model, operates as follows: windows are opened if the operative temperature is greater than the comfort temperature calculated from the EN15251 adaptive comfort model. Following the definition of comfort temperature for a free-running period in EN15251, the windows can only be opened if the weighted running average of the previous seven daily average outdoor air temperatures is above 10°C and below 30°C. Model G, a benchmark pseudo-model, “predicts” that the windows are always open. Model H, a benchmark pseudo-model, “predicts” that the windows are always closed. In the case of the stochastic window operation models, to conduct a comprehensive evaluation, both the original and adjusted coefficients of the logistic functions were used. The original coefficients are published by the model developers; the adjusted coefficients were obtained by re-fitting the models to a separate dataset obtained from the building under study in the calibration period. The models with original coefficients are marked with a subscript “O” and those with calibrated coefficients are denoted by a subscript “C”. As mentioned before, the latter option (adjusting model coefficients based on observations from actual buildings) has no relevance to model deployment scenarios pertaining to 62
building design support, but may be of some interest in operation scenarios of existing buildings. Table 6-2 summarizes the model evaluation scenarios. The process of model selection and specification of an external evaluation study already highlights some of the typical challenges faced by external validation studies of behavioral models. Aside from the absence of a prior external validation study, most published models have a limited scope of underlying internal validation. Published models are often derived based on limited data—typically from a single building—rendering them non-representative in statistical terms (e.g., population, climate, building typology). Moreover, even for this limited base, the model documentation typically leaves many questions open or includes questionable assumptions (i.e., the assumption that occupants’ degree of freedom in operating windows is independent of facility management issues in a typical office building). Likewise, hidden assumptions pertaining, for example, to the assumed one-to-one relationship between an inhabitant and a window make it difficult for users to judge whether and to what extent socially relevant interaction patterns between inhabitants, and the related implications for window operation, are captured in the model. Table 6-2: Studied window operation models and evaluation scenarios Model Ao Bo Co Ao* Co* Ac Bc Cc Ac* Cc* D E F
Model type
Coefficients
Adjustment for the absence of nighttime ventilation
Stochastic
Original
No
Stochastic
Original
Yes
Stochastic
Calibrated
No
Stochastic
Calibrated
Yes
Non-Stochastic
-
-
6.6.2. Empirical data for model calibration and evaluation An office area at TU Wien (Vienna, Austria), including an open space with multiple workstations and a single-occupancy closed office, was the data source for external model assessment. The focus was on seven workstations, at which each occupant has access to one manually operable casement window. The occupants’ presence, state of windows, and a number of indoor environment variables (including air temperature, humidity, and CO2 concentration) were monitored on a continuous basis. Outdoor environmental parameters (including air temperature and precipitation) were also continuously monitored via the building’s weather station. For the present study, data at 15-minute intervals over a calendar year (referred to as the calibration period) were used to calibrate the coefficients of the stochastic window operation models. This option is only of interest if the model deployment scenario involves existing buildings (e.g., model use for optimization of building operation). A separate dataset 63
obtained from another calendar year (referred to as the validation period) was used to evaluate the predictive performance of the models. Note that, in this paradigmatic scenario, efforts were made to satisfy a number of the generic model evaluation requirements formulated in previous section. These included, for example, the collection of long-term high-resolution data, a rather rigorous data quality check, and separate datasets for calibration and model comparison. However, a central problem remains: the data used for model evaluation in this case came from only one building and a relatively small number of occupants. This circumstance may remain, at least for some time, unavoidable (large repositories of observational data from different locations and building types are, while highly desirable, unavailable). This underlines the importance of candid and detailed model documentation, as alluded to in the introduction.
6.6.3. Calibrated simulation model of the office area Previous studies on the evaluation of stochastic window operation models (Schweiker et al. 2012, Fabi et al. 2015) did not address model feedback. This circumstance represents a special problem in behavioral model validation, as the impact of behavioral models’ output (for instance, window states) on the models’ input (for instance, indoor temperature) is ignored. Hence, the building’s response to behavioral impulses needs to be emulated via calibrated simulation. Therefore, a calibrated simulation model offers a platform for evaluating behavioral models in which the output influences the input. This necessitates a model that can reliably represent the building’s behavior. For the purposes of the present case study, the building model was first subjected to an optimizationbased calibration to adjust the fixed parameters governing the multi-zone airflow simulations (for details of the calibration procedure, see Tahmasebi and Mahdavi 2012). Secondly, the monitored data pertaining to occupancy, plug loads, use of lights, and operation of the heating system were incorporated into the calibrated building model as a set of full-year data streams at 15-minute intervals. This dataset was obtained in the validation period. The resulting model, when fed with actual window operation data, predicts the hourly indoor temperatures in the validation year with a normalized mean bias error of 2.8% and a coefficient of variation of the root-mean-square error of 4.8%. The building simulation model described above served as a platform, and the selected window operation models were integrated such that each variation represented the occupants’ interactions with windows using the corresponding window model. For each occupant in the building, individual occupancy data and zone-level indoor environmental factors were fed into the window operation model. That is, at each simulation time-step, the window model was executed separately for each occupant. Moreover, a benchmark model was generated using the actual monitoring data obtained in the validation period. As calibrated building performance simulations for the evaluation of occupant behavior models require the deployment of real-year—preferably on-site—weather data, the building model was exposed to the outdoor environmental conditions in the validation period. This was accomplished by generating a weather data file from the on-site weather station measurements. The measured dataset
64
included outdoor air temperature, air humidity, atmospheric pressure, global horizontal radiation, diffuse radiation, wind speed, and wind direction.
6.6.4. Evaluation scenarios for window operation predictions The performance of the window operation models was evaluated in terms of predicting occupants’ interactions with windows for a one-year-long validation period. In this period, the models were fed with monitored occupancy-related and outdoor environmental data from the same period according to their independent variables. The required indoor environmental factors, however, were provided by the calibrated building simulation output to include the models’ feedback. Thus. the calibrated building performance model simulates the impact of the window operation models’ output on the indoor environmental input. For the purpose of the current case study, the following indicators were used to evaluate the predictive performance of window operation models. The first two indicators in the following list are compared interval-by-interval, whereas the others are typically aggregated for comparison: Fraction of correct open state predictions [%]: This is the number of correctly predicted open state intervals divided by the total number of open state intervals. Fraction of correct state predictions [%]: This is the number of correctly predicted interval states divided by the total number of intervals. Overall fraction of open state [%]: This is the total window opening time divided by the observation time. Mean number of actions per day [d-1] averaged over the observation time. Median open state duration [h]. Median closed state duration [h]. To ensure the robustness, transparency, and integrity of the model evaluation procedure, the selection of reliable, expressive, and consistent model performance metrics is indispensable. Future efforts in this direction are thus of utmost importance.
6.6.5. Evaluation results To illustrate the performance of the models in terms of the different evaluation indicators, Figure 6- to Figure 6-2 show the models’ prediction errors under consideration of their feedback. In these figures, the mean value of the Monte Carlo simulations is displayed for the stochastic models.
65
Figure 6-2: Errors of stochastic window operation models with original coefficients and no adjustment as well as non-stochastic models in terms of four evaluation statistics
Figure 6-1: Errors of stochastic window operation models with original coefficients and adjusted to buildings without nighttime ventilation as well as non-stochastic models in terms of four evaluation statistics
66
Figure 6-2: Errors of stochastic window operation models with calibrated coefficients and adjusted to buildings without nighttime ventilation as well as non-stochastic models in terms of four evaluation statistics
6.6.6. Evaluation results discussion With regard to the application of behavioral models, a fundamental question concerns their ability to reproduce empirical observations. Thus, one may first ask whether the models could, in the present case, provide acceptable approximations of the observations. Assuming a threshold of ±20% as a reasonable benchmark for the relative error of model predictions, it has to be concluded that, without adjustments (nighttime ventilation, calibrated coefficients), none of the studied models performs satisfactorily (Figure 6-). However, the nighttime ventilation adjustment markedly improves the performance of stochastic models Ao* and Co* (Figure 6-3). Furthermore, calibrating the coefficients of the stochastic models using observational data significantly improves their predictive performance (Figure 6-4). As stressed before, this case study is based on a limited set of empirical data obtained from one office area. Hence, the findings cannot be extrapolated to the modeling efforts in different contexts. Ongoing and future (more extensive) cross-sectional investigations in this area are expected to utilize a larger empirical foundation and thus lead to more representative and inclusive model evaluations. Specifically, while the calibration of occupant behavior models is not feasible in the majority of building performance simulation efforts, similar external validation studies contribute toward a repository of coefficients for the use of existing occupant behavior models in different contexts.
67
Aside from these specific case study results regarding the performance of the selected models, it is important to highlight a number of observations that are relevant to the model evaluation discussion in general: Data. A general problem in both the development and evaluation of behavioral models pertains to the paucity of empirical data. For instance, models A and B were based solely on office buildings in the UK in summer (15 buildings in the case of model A, 1 in the case of model B), whereas model C was based on a single office building in Switzerland. Moreover, the monitoring period for data collection was rather limited in the case of model B (four months). Earlier in this report, it was suggested that a sound model evaluation process requires clear and detailed model documentation. This condition is often ignored and was not fully met in our case study. For instance, in the case of model A, the treatment of nighttime ventilation is not clearly described. Likewise, in the case of model C, the parameter included for closing a window upon last departure makes the model (with the original coefficients) inapplicable to buildings without nighttime ventilation. As suggested previously, model developers should ideally conduct an internal validation via separate developmental and evaluative datasets. In the present case study, this was not done for models A and B. In the case of model C, the publication introducing the model suggests that a “cross-validation” was performed. Note that only the publication related to model C included any model validation metrics. However, the types, coverage, scope, and suitability of performance metrics for behavioral models remains an open question. Suitable model documentation should include comments on the applicability of the proposed model (e.g., with regard to building type, location, climate, deployment scenario). The documentation of the models selected for our case study does not contain such comments. Overall, the above illustrative external evaluation study underlines a number of challenges in the evaluation process of behavioral models. These include the paucity of underlying empirical information of sufficient quality and representative nature; shortcomings in model documentation; model input requirements that cannot be met in realistic model deployment situations; problems associated with model coefficients and their calibration; the lack of a set of comprehensive, adequate, and universally accepted model performance metrics; and—last but not least—the problem of feedback, i.e., including the impact of the predicted actions on environmentally relevant model input variables.
6.7. Model evaluation conclusions Building performance assessment tools and methods can be significantly improved in terms of coverage and applicability if they are enriched with high-resolution representations of occupants. Many recent model development efforts have explored the potential for detailed mathematical formalisms to provide such representations. However, rigorous external evaluation processes are needed to ensure the usability and reliability of occupancy-related behavioral models. Given the lack of related general procedures and guidelines, we formulated a number of relevant conditions and requirements. 68
Furthermore, a demonstrative model evaluation study was presented, involving a number of recently proposed window operation models. The main concern was not to highlight the observed deviations from reality underlined in this specific case study. Rather, as a paradigmatic model case, the external window operation evaluation study offered the opportunity to identify the need for clear documentation of the uncertainties associated with existing behavioral models in different deployment scenarios and the development of more generally applicable occupancy-related models. Note that ongoing and future trends toward more sophisticated behavioral models are likely to accentuate the critical need for appropriate model validation techniques and procedures. For instance, current approaches are not likely to obtain empirical data that would facilitate a one-to-one comparison between model predictions consisting of multi-aspect (i.e., targeting multiple action domains) and agent-based (i.e., geared toward individual occupants’ dynamic actions) characteristics. The definition and pursuit of rigorous model validation procedures in the behavioral modeling field may be seen as work in progress. Thus, both model developers and potential users are advised to be careful with regard to the introduction and application of behavioral models pertaining to occupants’ actions in buildings. Specifically, statements concerning the validity and overall applicability of models in the building delivery process have little credibility without comprehensive empirical backing and careful model testing procedures.
69
7. Occupant Behavior Modeling Tools and Integration with Building Performance Simulation Programs Building performance simulation (BPS) programs, e.g., EnergyPlus (USDOE 2017), ESP-r (Hand 2015), IDA-ICE (EQUA 2017), DeST (Yan et al. 2008), and TRNSYS (2012), are widely applied to evaluate the performance of building technologies and energy systems with the aim of reducing energy use in buildings and associated greenhouse gas emissions. However, BPS programs usually represent occupant behavior, a key driver of building performance, using different approaches (Crawley et al. 2008) with oversimplified or pre-defined static schedules, or fixed settings and rules. This leads to deterministic and homogeneous simulation results that do not fully capture the stochastic nature, dynamics, and diversity of occupants’ energy behavior in buildings. One of the objectives of Annex 66 was to develop a quantitative description and models of occupant behavior in order to analyze, evaluate, and understand the impact of occupant behavior on building energy consumption, as well as reduce discrepancies between the simulated and measured energy use in buildings. This chapter summarizes the main outcomes from three activities conducted under Subtask D: (1) A survey of BPS program developers and users was conducted to understand the capabilities and limitations of widely-adopted BPS programs in terms of occupant behavior modeling; (2) The development and integration of three occupant behavior modeling tools (obXML, obFMU, and the Occupancy Simulator) for building performance simulations; and (3) Case studies testing the use of co-simulation with occupant behavior functional mockup units (FMUs) and three BPS programs (EnergyPlus, ESP-r, and TRNSYS). For more details on the modeling tools, please refer to the cited journal articles. The developed occupant behavior modeling tools are available free at behavior.lbl.gov and occupancysimulator.lbl.gov. These tools will continue to evolve to address user feedback, add new features for emerging applications, and be further verified and validated using measured data.
7.1. Background on occupant behavior modeling in BPS programs To contribute meaningfully to occupant modeling capabilities in building simulations, it is important to understand the currently available functionality. It is known that functionality among BPS tools is generally inconsistent (Crawley et al. 2008, Zhou et al. 2014, Zhu et al. 2013), particularly stochastic occupant behavior modeling (Hong et al. 2017); it is useful to quantify this issue. To this end, the occupant modeling capabilities of a selection of current BPS programs were reviewed. Information was gathered and recorded in the form of a questionnaire, strongly differentiating between deterministic (or prescribed) and stochastic models. Questions were divided into six modeling categories: (i) occupant movement and/or presence, (ii) use of lights, (iii) use of windows, (iv) use of 70
HVAC, (v) other casual gains (e.g., small power), and (vi) any other occupant behavior (e.g., shading). The following questions were asked for each of these areas:
Does the BPS program include any stochastic model(s) of [modeling category]? If yes, please briefly describe the model(s). If yes, please give up to three references detailing each model. Please briefly describe any deterministic models of [modeling category] included in the BPS tool. Please also provide one reference detailing each model and/or its application.
Data were collected for the following BPS programs: DeST v2.0, DOE-2.1E v124, EnergyPlus v8.3, ESP-r v12.3, IDA ICE v4.6, IES-VE 2016, Pleiades + Comfie v3.5.8.1, and TRNSYS 17 v5.3.0. Where Subtask D participants were not experienced in the use of these programs (IDA-ICE and IESVE), information was sought from other parties with substantial knowledge. This was done to take advantage of existing expertise and minimize the possibility of omitting or misunderstanding obscure or poorly documented functionality. The full results of this review were reported by Cowie et al. (2017). It was found that deterministic occupant modeling functionality was fairly consistent among the BPS tools studied. Prescribed schedules and rule-based control are generally used to represent building occupants and their behavior; for example, schedules of casual gains from occupants are generally used, or window opening control based on temperature set-points may be applied. Whilst there are minor variations between programs, e.g., some are limited to hourly resolution whilst others can handle sub-hourly resolution and some have provision for control in aspects others do not, the input requirements and impact of the functionality are broadly similar. Table 7-1 provides an overview of the stochastic occupant modeling capabilities in the BPS programs. In this table, the term “user-defined” represents functionality or program features that allow users to implement bespoke models. For example, programs such as IES-VE and EnergyPlus include generalized model input functionality, allowing users to program models through the interface in a proprietary language. Others such as IDA-ICE and TRNSYS allow users to integrate models written in externally standardized languages into the simulation. Some allow co-simulation with standalone external programs. Open source BPS programs give users the ability to program models directly into the source code of the program. These methods can all be used to implement both stochastic and deterministic occupant behavior models.
71
Table 7-1: Overview of stochastic functionality Stochastic models or potentially stochastic input capabilities for … Program
Presence / movement
Lighting operation
Window operation
HVAC operation
Others
DeST
Markov chain
Probabilistic control
Probabilistic control
Probabilistic control
None
DOE-2.1E
User-defined
User-defined
User-defined
User-defined
Probabilistic shading control, user-defined
EnergyPlus
User-defined
Scheduled probability, userdefined
User-defined
User-defined
User-defined
Probabilistic control, userdefined
Probabilistic control, userdefined
User-defined
Probabilistic fan control, userdefined
User-defined
User-defined
User-defined
User-defined
User-defined
User-defined
User-defined
User-defined
User-defined
None
None
None
None
None
User-defined
User-defined
User-defined
User-defined
User-defined
ESP-r IDA-ICE IES-VE Pleiades + Comfie TRNSYS
Probabilistic arrival and departure, userdefined User-defined
In general, the stochastic representation of occupants is much less ubiquitous than deterministic modeling capabilities. There are two broad types of functionality available: 1) defined occupant behavior models implemented in the BPS program and 2) features to allow the input of user-defined models. Half of the programs reviewed include some built-in stochastic modeling capability, but the functionality is far from consistent. DOE-2.1E, EnergyPlus, and DeST allow users to define operation probabilities, in some cases functions of independent state variables, though the areas in which this is applicable varies. ESP-r includes occupant behavior models from the literature with fixed operation probabilities. The former approach is more flexible, but requires extra user input; the empirical behavior models of the latter approach restrict its applicability. The ability to input user-defined models is reasonably widespread (available in six of the eight programs), though the means of doing this vary. This variety of languages and input methods compromises model portability, and also raises issues of usability. Programming bespoke models or co-simulation programs generally requires highly technical skills. If users must learn a new coupling standard or programming language for every BPS program they wish to implement a model in, the learning curve could become prohibitive to widespread implementation. For the purposes of the computational deliverables of Subtask D, a co-simulation approach seems appropriate. The results of the survey clarify that there is a need to homogenize and stimulate wider uptake of stochastic occupant modeling capabilities. The development of a BPS program-independent co-simulation platform could address the former by centralizing functionality, allowing models to be implemented within the platform and then applied in a consistent way among different BPS tools. However, the usefulness of this is dependent on the ability of BPS programs to co-simulate with this platform, which in turn relies on the implementation of a co-simulation standard in as many BPS 72
programs as possible. Such developments could potentially be stimulated by the existence of such a co-simulation platform, as this would provide a demonstrable contribution to the functionality of the BPS program. Promoting awareness of these developments could therefore contribute significantly to their impact.
7.2. Occupant behavior modeling tools Based on the above mentioned observations, a suite of new occupant behavior modeling tools was developed under Subtask D of Annex 66 to be used in building performance simulation. The aim of these tools is to improve building performance simulation by: (1) providing a standard representation of occupant behavior models, enabling the exchange and use of occupant behavior models between BPS programs, applications, and users to improve the consistency and comparability of simulation results, and (2) generating realistic occupancy schedules. These tools capture the diversity, stochastics, and complexity of occupant behavior in buildings to improve the simulation and evaluation of behavioral measures, as well as of the impact of occupant behavior on technology performance and energy use in buildings.
7.2.1. obXML: An occupant behavior XML schema obXML (Hong et al. 2015a, Hong et al. 2015b) is an XML schema that standardizes the representation and exchange of occupant behavior models for building performance simulations. obXML builds upon the Drivers–Needs–Actions–Systems (DNAS) ontology to represent energy-related occupant behavior in buildings. Drivers represent the environmental and other context factors that stimulate occupants to fulfill a physical, physiological, or psychological need. Needs represent the physical and non-physical requirements of occupants that must be met to ensure satisfaction with their environment. Actions are the interactions with systems or activities that occupants can perform to achieve environmental comfort. Systems refer to the equipment or mechanisms within the building that occupants may interact with to restore or maintain environmental comfort. A library of obXML files, representing typical occupant behavior in buildings, was developed from the literature (Belafi et al. 2016). These obXML files can be exchanged between different BPS programs, different applications, and different users. Figure 7-1 shows the four key elements of the obXML schema and their sub-elements.
73
attributes Description Tim e Environm ent Drivers Behaviors
Behavior
EventType 0..¥
1..¥
OtherConstraint 0..¥ Therm al Needs
Physical
Visual IAQ Type
Actions
Interaction
Form ula ControlValue
HVAC Lights Window s System s PlugLoad Therm ostats ShadesAndBlinds
Figure 7-1: Overview of the obXML schema showing the DNAS ontology
7.2.2. obFMU: An occupant behavior functional mockup unit obFMU (Hong et al. 2016) is a modular software component represented in the form of FMUs, enabling its application via co-simulation with BPS programs using the standard functional mockup interface. obFMU reads the occupant behavior models represented in obXML and functions as a solver. A variety of occupant behavior models are supported by obFMU, including (1) lighting control based on occupants’ visual comfort needs and availability of daylight, (2) comfort temperature setpoints, (3) HVAC system control based on occupants’ thermal comfort needs, (4) plug load control based on occupancy, and (5) window opening and closing based on indoor and outdoor environmental parameters. obFMU has been used with EnergyPlus and ESP-r via co-simulation to improve the modeling of occupant behavior. Figure 7-2 shows the workflow of co-simulation using obFMU and EnergyPlus.
74
Occupant Models
Describes occupant behaviors
obXML Files
obFMU obFMU obFMU DLL DLL DLL
xml xml xml
Results Results csv files Results csv files csv files
Co-Simulation Info
obXML Schema
obCoSim.xml Simulation period, space mapping between obXML and IDF files
DNAS Ontology
Co-Simulation via FMI Multiple instances of obFMU Each obFMU simulates one space
Building Energy Model IDF File
EnergyPlus
Co-Simulation Info
(Simulation engine, also the co-simulation manager)
ExternalInterface FunctionalMockupUnitImport
Results
Figure 7-2: Co-simulation workflow of obFMU with EnergyPlus
7.2.3. Occupancy Simulator: A web-based occupancy app Occupancy Simulator (Chen et al. 2017, Luo et al. 2017) is a web-based application running on multiple platforms to simulate occupant presence and movement in buildings. The application can also generate sub-hourly occupant schedules for each space and individual occupants in the form of CSV files and EnergyPlus IDF files for building performance simulations. Occupancy Simulator uses a homogeneous Markov chain model (Wang et al. 2011, Feng et al. 2015) and performs agent-based simulations for each occupant. A hierarchical input structure is adopted, building upon the input blocks of building type, space type, and occupant type to simplify the input process while allowing flexibility for detailed information capturing the diversity of space use and individual occupant behavior. Users can choose an individual space or the whole building to see the simulated occupancy results. Figure 7-3 shows the software architecture of the Occupancy Simulator.
Figure 7-3: Software architecture of the Occupancy Simulator
7.3. Integration of occupant behavior modeling tools with BPS programs Occupant behavior modeling tools can function as stand-alone units or be integrated with BPS programs through co-simulation approaches.
75
The Occupancy Simulator can be used as a web application to simulate the presence and movement of each individual as an agent through stochastic models, and generate hourly or sub-hourly room-level occupant schedules (in CSV format or EnergyPlus IDF format) for building performance simulations. The Occupancy Simulator can also function as a stand-alone program by reading user input from an obXML file and a simulation configuration file, and then simulating occupant movements and generating the occupant schedules. obXML files are used by obFMU or directly by BPS programs. In future, obXML could be integrated with Building Information Modeling (BIM), e.g., gbXML (2017), which is widely supported by BPS programs. obFMU works with BPS programs supporting the Functional Mock-up Interface (FMI), e.g., EnergyPlus and ESP-r, through two co-simulation approaches: (1) a third-party tool, e.g., BCVTB, that manages the co-simulation and data exchange between obFMU and the BPS program (Langevin et al. 2015). Lindner et al. (2017) developed a Modelica-based FMU of occupant behavior models, and used a Python-coded tool to manage the co-simulation of the FMU with TRNSYS; and (2) the BPS program manages the co-simulation with obFMU. The following sections describe the latter cosimulation approach using obFMU and the BPS programs ESP-r and EnergyPlus.
7.3.1. ESP-r Linking obFMU with ESP-r enables fully automated co-simulation, and the software can be downloaded at http://www.esru.strath.ac.uk/Programs/ESP-r.htm. This conforms to the typical master– slave paradigm adopted by FMI: at each simulation time step, ESP-r calls obFMU and provides inputs describing environmental conditions, before receiving outputs describing occupant actions over that time step. This functionality has been integrated into the interface of the Project Manager of ESP-r (PRJ); Figure 7-4 shows a screenshot of this interface (graphical X11 version). This interface allows users to specify an arbitrary number of FMUs, each with an arbitrary number of inputs and outputs (subject to data structure limits, which can be modified in a header file).
76
Figure 7-4: FMI specification in ESP-r This linkage was achieved through the use of an external open-source implementation of the FMI standard called FMI Library (www.fmi-library.org). FMI Library is written in C, and has been interfaced with the predominantly Fortran code of ESP-r.
7.3.2. EnergyPlus EnergyPlus is a powerful BPS program for modeling heating, cooling, lighting, and ventilation systems, with obFMU providing the capability to model occupant-based control strategies, which can be downloaded at https://energyplus.net/. EnergyPlus can act as the FMU manager (through the group of External Interface objects) to allow co-simulation with obFMU. Figure 7-5 shows the data exchange between EnergyPlus and obFMU during each simulation time step (from 1–60 min). EnergyPlus exports the zone air temperature, zone CO2 concentration, zone daylight illuminance level (at the daylight sensor position), outdoor air temperature, and outdoor rain indicator to obFMU. Timestep calculations are then performed by obFMU to determine the operation schedule for HVAC, windows, shade/blind, lighting, and plug load, as well as the thermostat set-point. The occupancy, operational, and thermostat set-point schedules are then used by EnergyPlus to simulate the energy performance of the building. Tutorial and example files explaining the integration of obFMU with EnergyPlus for co-simulation are included in the obFMU application guide (LBNL 2016), which is part of the obFMU release package available at behavior.lbl.gov.
77
EnergyPlus
FMU External Interface
Data Exchange
obFMU
Zone air temperature Zone illumination level Zone CO2 concentration Zone lights electric power Outdoor air temperature Outdoor rain indicator
Set variables
Occupancy schedule Lighting schedule Plug load schedule Window schedule Shade/Blind schedule Thermostat setpoint HVAC schedule
Perform time-step calculation • •
Movement Solver Occupancy Interaction Solver Window Shade/Blind Lighting Plug load Thermostat HVAC
Get control variables
Figure 7-5: Data exchange between EnergyPlus and obFMU Chen et al. (2017) introduced a new approach to simulating and visualizing energy-related occupant behavior in office buildings. They used obFMU to model occupant behavior and analyze the impact on building energy use through co-simulation with EnergyPlus, and employed AnyLogic to visualize occupants’ movements and their actions on windows, lights, and HVAC systems, as well as the simulated energy use at each time step.
7.3.3. DeST DeST is a BPS program that calculates the energy usage and indoor environmental parameters using detailed physics-based models, which can be downloaded at https://update.dest.com.cn/. With an embedded occupant behavior module, DeST allows users to select occupant behavior models and specify their inputs to simulate occupant behavior. Figure 7-6 shows the user interface for setting the parameters of occupant behavior models. This occupant behavior module is embedded inside DeST, enabling BPS users to combine occupant behavior modeling with BPS and capture the impact of occupant behavior on building performance.
78
Figure 7-6: Operating interface of the occupant behavior module in DeST DeST creates and uses a Markov chain occupancy movement/presence model (Wang et al. 2011, Feng et al. 2015) to realize stochastic functionality. With prescribed schedules of the number of occupants, DeST could also implement deterministic functionality. To describe the HVAC system, window control, and lighting control stochastically, DeST creates a set of probability models based on events or environmental parameters (e.g., the zone air temperature, zone CO2 concentration, zone daylight illumination level, outdoor air temperature). This enables the operation schedules of HVAC, windows, shades/blinds, and lighting to be determined (Ren et al. 2014, Wang et al. 2015, Wang et al. 2016).
7.3.4. Other integration approaches For EnergyPlus, the Energy Management System (EMS) feature is used to describe and model occupant behavior. EMS allows users to write custom code that overwrites the EnergyPlus calculations in a runtime language without requiring the recompilation of EnergyPlus. Gunay et al. (2015) developed EMS scripts to describe 20 occupant behavior models for use with EnergyPlus. Using Ruby scripts, O’Brien et al. (2016) developed an OpenStudio library of measures representing typical occupant behavior models that can be directly applied to EnergyPlus simulation models.
79
7.4. Case studies testing obFMU in BPS programs 7.4.1. Case studies objective The objective of this activity was to demonstrate the use of the obFMU tool in case studies with BPS programs. The available stochastic user behavior models were integrated into case studies in BPS programs and co-simulations were performed to define the power and limitations of the newly developed tool through utilization in BPS.
7.4.2. Integration of existing occupant behavior models into obXML schema to create obFMUs Firstly, the most suitable occupant behavior models for the case study were identified through the analysis of published studies. To ensure that effective occupant behavior models could be created from the information given in a publication, only those models with clear input and output variables were selected. In addition, the underlying mathematics of the occupant behavior model must be stated. To implement the selected 31 occupant behavior models into BPS programs, separate obXML files were created and a co-simulation with a small case study building was performed in EnergyPlus with obFMU. This process was not successful for all selected occupant behavior models. Thus, the occupant behavior models were divided into five categories according to their method of integration: (1) Integration without alterations; (2) Integration with occupant behavior model modification; (3) Integration with obFMU modification; (4) Not working with obFMU; and (5) No feasible input of occupant behavior model for BPS. A more detailed explanation of the categories is as follows: 1. Integration without alterations: The occupant behavior model could be integrated into obXML without alterations or limitations. 2. Integration with occupant behavior model modifications: The occupant behavior model could be integrated into obXML with some modifications to overcome occupant behavior model limitations. These limitations included: Missing decision for a trigger: Generally, occupant behavior models are based on stochastic modeling, whereas the BPS program requires a clear decision as a trigger for further interaction. Some occupant behavior models do not provide outputs in such a binary form, but instead give a probability (Nicol 2001, Haldi and Robinson 2008). Therefore, the BPS modeler has to make a decision regarding when a probability is sufficiently high to result in an action (e.g., open/close window). One possible method is to compare the probability with a random number. Missing a reversal function: Some models do not define how the action should be reversed or how long the action lasts. For instance, the function of opening windows in relation to the outside temperature is given, but the reverse function of closing windows is not defined.
80
Additional effort required to obtain occupant behavior inputs: For example, the blind model of Haldi and Robinson (2009) was developed from a field study of a building with two separated (upper and lower) external blinds. One of the required inputs is the shaded fraction of the window, because the blind is not always fully drawn or raised. EnergyPlus cannot simulate fractions of the shading device. To implement the model, the modeler would need to divide the window into smaller portions. In addition, there are two different probabilities for upper and lower blinds, which further complicate the application. Therefore, simplifications are required, and these will directly impact the results. 3. Integration with obFMU modifications: The occupant behavior model could be integrated into obXML with some modifications because of obFMU limitations. These limitations included: Missing event type in obXML. Some occupant behavior models (Hunt 1980, Haldi 2013) consider events such as the arrival time or the time of absence. As only certain Event Types are offered in obXML (“Entering Room;” “Leaving Room for more than 1 hour;” “Leaving Room for more than 6 hours”), modifications had to be made. One modification was the approximation of an “absence longer than 8 hours” in Haldi (2013) with “Leaving Room for more than 6 hours” in obXML. 4. Limitations of obFMU: The occupant behavior model could not be integrated into the obXML because of restrictions in obFMU or obXML. Limited types of mathematical equation: obXML provides different equations to implement occupant behavior models, such as constant values, linear, quadratic, logit, probit, or Weibull functions. If the occupant behavior model uses another type of mathematical function or equation (e.g., Rijal et al. 2008), the model cannot be integrated. Fixed model of occupancy: obXML uses the occupancy model of Wang et al. (2011); the inclusion of other occupancy models is currently not possible. Limited types of parameters in obXML: As of June 2017, obXML offers the following parameters: Room Air Temperature; Room CO2 Concentration; Outside Dry-Bulb Temperature; Room Workplane Daylight Illuminance; Room Lights; Power Density; and Rain Indicator (0/1). If an occupant behavior model uses an input parameter other than those listed above, such as direct solar irradiance (Reinhart 2004), the model cannot be integrated into obXML. 5. Not feasible input for BPS: The occupant behavior model could not be integrated into obXML because integration would not have been feasible. The necessary input variables of occupant behavior models must also be present in the common simulation tools. For input variables that can be obtained by field measurements, but not without substantial effort using simulation tools, the authors should provide a different way of estimating these values. In Page (2007), for example, air pollution based on the applied building materials was used to determine the probability of opening a window; this cannot be calculated without considerable effort and knowledge of the materials used in the building.
81
Table 7-2: Results of occupant behavior model integration into BPS programs using obFMU Occupancy
Lighting
Window
Blinds
Set Temp.
Reinhart (2004)
Hunt (1980)
Nicol (2001)
Newsham (1994)
Fanger (1970)
Wang et al. (2005)
Newsham (1994)
Rijal et al. (2007)
Nicol (2001)
Mayer (1998)
Page et al. (2008)
Nicol (2001)
Page (2007)
Reinhart (2004)
Humphrey & Nicol (2002)
Wang et al. (2011)
Reinhart (2003)
Yun, Steemers (2008)
Haldi & Robinson (2008)
Nicol & Humphrey (2007)
Liao et al. (2012)
Rijal et al. (2008)
Haldi & Robinson (2009)
Langevin (2015)
Chen et al. (2015)
Haldi & Robinson (2008)
Haldi (2013)
Yun et al. (2009) Haldi & Robinson (2009) Haldi (2013) Li et al. (2015) No limitations
Model limitation
obFMU limitation
Not working with obFMU
Not feasible or meaningful
Further investigation of the requirements of occupant behavior models for use in BPS programs has been reported by Lindner et al. (2017).
7.4.3. Case study using obFMU in different BPS programs (EnergyPlus, ESP-r, TRNSYS) While the focus of the previous section was the implementation of each investigated occupant behavior model into BPS using obFMU and testing each occupant behavior model in terms of BPS, this section discusses composite occupant behavior models (e.g., window + blind + lighting model) using obFMUs in three different BPS programs, namely EnergyPlus, ESP-r, and TRNSYS. Furthermore, the building of interest is more complex and reflects a real office building in the US. It has two above-ground stories with a total conditioned floor area of 1723 m² and includes three different room types (office, conference room, and classroom) with a total of 37 zones. Detailed information about the case building is given by Sun and Hong (2017a, b). The comparison of baseline heating, cooling, and electricity energy loads across the three BPS programs showed no significant differences. The occupancy schedules for each zone were generated stochastically using the Occupancy Simulator. A set of generated occupancy schedules were used in both the baseline and occupant behavior models,
82
whereas the occupant behavior was set differently to enable the evaluation of the impact of occupant behavior models: Occupant behavior in baseline model The occupant behavior in the baseline model was considered to be deterministic: I.
II. III.
Ventilation: The infiltration rate was set to 0.7 ACH; the outdoor air in mechanical ventilation is 68 m³/(h∙person) (this building was over-ventilated according to the requirements of ASHRAE Standard 62.1). Blind control: Blinds were controlled based on the total solar radiation on the window facade, with a trigger point at1 30 W/m². Lighting control: deterministic schedule with diversity factors.
Selection of stochastic occupant behavior models Two combinations of occupant behavior models were tested. The models of Yun and Steemers (2008) for windows and Newsham (1994) for lighting were considered as simple occupant behavior models that require few input parameters and are based on simple equations. In contrast, the complex models of Haldi (2013) for window and blind operation and Reinhart and Voss (2003) for lighting require multiple parameters for the calculation of probabilities. Results of the case study Three research institutes (LBNL, University of Strathclyde, and Fraunhofer) carried out the cosimulation with the case study using EnergyPlus, ESP-r, and TRNSYS. They answered the following five questions: 1. 2. 3. 4. 5.
Integration of obFMUs into BPS programs: How were obFMUs integrated into BPS? Success of co-simulation: Could the simple and complex obFMUs be integrated successfully? What challenges were faced during the implementation process? What was the computation time with the simple/complex obFMUs and without FMUs? Recommendation: What should users consider in the use of obFMUs?
The results of this comparison study with BPS programs are summarized in Table 7-3.
7.4.4. Occupant behavior model integration case study results The newly developed obFMU modeling tool provides an environment for co-simulation based on the FMI standard. This enables an iterative data exchange between more than two simulation programs. The pre-defined obXML files allow BPS modelers to integrate available occupant behavior models into a BPS program more easily for the consideration of stochastic user behavior. However, the prerequisite for the application of this approach is that the BPS program should support FMI. In addition, the computation time with obFMU is longer than without obFMU, and specifying the instance names for each parameter in every zone requires dedicated effort. Thus, the process is prone to error if not handled carefully, as shown by the case study using TRNSYS. Other limitations include lack of integration of non-equation-based models into obFMU, use of a single occupancy model, and lack of treatment of interdependent behavior choice hierarchies. 83
Table 7-3: Results of the case study using obFMU in three BPS programs: EnergyPlus, ESP-r, and TRNSYS Question
EnergyPlus ESP-r TRNSYS External interface module in E+ for co-simulation Export as FMU file in TRNSYS using type 1. Integration of obFMUs into obFMU uses input variables from E+ and Define linkage directives through the project 6139a and type 6139b BPS programs: How were generates output variables to be used in E+ manager interface. The data required are similar Co-simulation using Python as master– obFMUs integrated into BPS? Use obXML files to exchange information of to those of the EnergyPlus implementation. slave occupant behavior models 2. Success of co-simulation: Could the simple and complex Yes Yes No (see the reason in 3) obFMUs be integrated successfully? At the beginning, obFMU did not provide FMI for co-simulation v.1.0 was integrated into FMI functions to load obFMU into Python ESP-r and is executed using pyFMI library All input/output variables required for co(solved now) Debugging of co-simulation, making sure that the simulation with obFMU were programmed into Each parameter needs separate coupling 3. What challenges were faced occupant behavior models are working and ESP-r and made available through the interface. with obFMU for every zone, unlike during the implementation simulated correctly It was an iterative development and EnergyPlus. Connecting individual process? Solving conflicts of occupant behavior models implementation process parameters for 37 zones separately is very with existing settings in BPS Ensuring consistency with models in other BPS time-intensive. tools was difficult in some aspects, due to Highly susceptible to errors for a TRNSYSdiffering functionality. based building model with large number of zones (large number of inputs and outputs). Computation time without obFMU: 20–25 4. What was the computation Computation time without obFMU: 3 min Computation time without obFMU: 28 min min time with the simple/complex Computation time with obFMU (simple): 17 min Computation time with obFMU: 41 min Computation time with obFMU only for 1 obFMUs and without FMUs? Computation time with obFMU (complex): 23 min zone: 1 h 14 min Interaction: How the occupant behavior models It is important to carefully consider interactions Model identifier (instance name) for the interact with each other and with existing systems among models in obFMU, and also between obFMU should be separately specified for operation, e.g., window & HVAC operation obFMU and ESP-r each parameter of every zone, otherwise Consistency: all the system operation related to It is critical to read the documentation fmiInstantiateSlave failure error would 5. Recommendation: What occupants should be consistent with the occupancy thoroughly and ensure prerequisites are satisfied, arise. should users consider in the schedule FMIL does not allow multiple instances This process is currently time-intensive use of obFMUs? Each simulated zone has its own obFMU, for a (generally 1 instance per zone), so each instance Although TRNSYS and obFMU provide large energy model with many zones, the requires a separate invocation of obFMU – this the FMI standard, it seems to be practically complexity and computational time can be a can lead to significant overheads with large impossible as a normal user to apply this challenge! models. approach to large models.
84
7.5. Occupant behavior model integration case study conclusions The existing BPS programs use various approaches to model occupant behavior in buildings, leading to challenges in exchanging the occupant behavior models and comparing simulation results between BPS programs. Moreover, occupant behavior models are often over-simplified, leading to simulation inaccuracies. There is a strong need to develop and use standardized representations of occupant behavior models, as well as ensure interoperable modular implementations of occupant behavior models in BPS programs. Subtask D developed and tested new methods and tools to fill these gaps, enabling robust integration of occupant behavior modeling in BPS programs to capture the complexity and impact of occupant behavior on building performance. Occupant behavior models should be used with particular applications in mind. Chapter 8 discusses the fit-for-purpose approach to selecting and applying occupant behavior models for building performance simulations. In general, when considering modeling occupant behavior, BPS users should pay close attention to: Selecting occupant behavior models of suitable complexity (model fidelity and spatial and temporal resolution) and usability for a particular application. If needed, occupant behavior models should be evaluated in terms of their rational use of metrics and approaches, as discussed in Chapter 6. Detailed occupant schedules representing the temporal and spatial diversity of occupants at the zone/room level are critical to evaluating occupant-based building technologies and control strategies. Homogeneous and static occupant schedules are not adequate to capture the dynamic nature and diversity of actual occupant presence and movement in buildings, which can lead to significant under- or over-estimation of occupant-based controls. Repeating the simulation to obtain statistically significant results. As most occupant behavior models are stochastic and use random number generators, each simulation case (when using different seeds to generate random numbers) will provide different results. It is recommended that simulations be repeated 10–15 times with stochastic occupant behavior models to ensure a good average or mean value, and to conduct 30–50 repetitions to achieve a good variance of results (Feng et al. 2016). The simulation results given by stochastic occupant behavior models should be presented and interpreted from a statistical perspective. This should include an average value as well as a probability distribution or range representing the impact of the uncertainty of occupant behavior in reality.
85
8. Applications of Occupant Behavior Modeling This chapter brings together case studies of building occupant behavior modeling applications from around the world. The purpose is to illustrate the range and types of applications, contribute to a framework for classifying types of applications, and explore which modeling approaches are most appropriate for which contexts. To determine which model is most appropriate for which context, three dimensions are particularly important: the stakeholder and their problem (Who? Why?); the building type, services, and provisions (What?); and the process stage and relevant tools (When?). The case study summaries answer these questions and provide succinct discussions of the adopted modeling strategy. The write-ups also include pointers to full publications that provide further details for readers who wish to learn more. This chapter aims to provide a framework for determining (1) when occupant behavior becomes important for making decisions about buildings, (2) which tools are most appropriate for specific applications, and (3) what insights emerge from practical experience with these tools. The cases summarized in Table 8-1 place these concerns into context. Table 8-1: Overview of the most common occupant behavior modeling approaches according to size, resolution and complexity (Gaetani et al., 2016). Simulation framework
Conventional
Agent-based
Type of model
Size
Resolution
Complexity
Schedules
Deterministic
Non-probabilistic
Probabilistic/stochasti c
Agent-based stochastic
The chapter summarizes a set of case studies of modeling occupant behavior in buildings using various computational decision support tools. These cases of occupant behavior modeling innovations provide a “demand–pull” view, as seen by the users of such tools, to counterbalance the “supply– push” perspective that many who create such models bring to the subject (Godin 2017). Motivation comes from practitioners responding to an international survey who believe occupant behavior is a major source of discrepancy between simulated and measured building energy performance, and that current modeling practice is quite simplistic (O’Brien et al. 2016). A review of
86
nine current BPS programs by Cowie et al. (2017) identified “a widening gap between knowledge and implementation in the field of occupant behavior modeling.” The remainder of this chapter considers the cases in which occupant behavior matters, how to support decision making in different building project phases (more specifically, how to support decision making through modeling and simulation), presents conclusions, and identifies future needs. Case study details are available in a separate technical report "Occupant behavior case study sourcebook" (ISBN 978-0-9996964-4-6).
8.1. Framework for determining the impact of occupant behavior on building energy performance To reduce the gap between the predicted and actual building energy consumption, a better understanding of occupant behavior and assessing the impact of occupant behavior on energy use is essential. Other subtasks of Annex 66 deal with energy prediction methodologies, occupant behavior modeling techniques, and advanced dynamic systems that allow for relatively accurate simulated predictions of energy use by integrating advanced user behavior models in energy simulations. However, in practice, users may not understand the details of the models and may not use them as intended. First, there is a need to select an appropriate tool for the given system design complexity. Then, information on the design parameters should be commensurate with the level of detail of the model. The characteristics of building energy performance simulation tools that incorporate occupant behavior should therefore vary according to application context. Thus, highly complex software tools may not be of much use when simple energy use estimations are required. In contrast, for a building design phase that calls for detailed modeling, the energy simulations require precise guidelines on defining the parameters related to occupant behavior. The simulation tools described in the peer-reviewed literature often incorporate considerable knowledge and evidence regarding the links between occupant behavior and building energy performance. In contrast, modeling practice makes relatively little use of the most advanced tools during the design phase because of their complexity and difficulty of use (O’Brien et al. 2016). Many practitioners use simplified tools such as rules of thumb or benchmarking for energy usage estimation. This suggests there is a need for better understanding of behavioral impacts on energy use in order to assess the suitability of certain tools and techniques for different situations. Case studies provide preliminary evidence regarding these tools’ fitness for use in specific situations. In certain buildings, occupants have more impact on energy use by having direct control over actions leading to energy consumption (switching lights and fans on/off, turning thermostat up/down, and window/door opening and shading positioning) than they do by merely occupying or being present in a space (Ahn and Park 2016). This needs to be recognized before the actual modeling takes place. The impact of occupant behavior on building energy consumption is often assessed inaccurately, which can cause errors, misinterpretation, and distrust of the simulation results (Yan et al., 2016). Typically, there is uncertainty when using energy prediction techniques because some factors are impossible to predict or cannot be foreseen. Realistic modeling of occupant behavior has only limited 87
feasibility, as each person behaves in a distinctive way and interacts differently with the surrounding environment. However, it is important to distinguish the cases in which analyzing occupant behavior adds more value, and then demonstrate and quantify the impact of occupant behavior on building energy performance. In this way, users can determine which methodology is most suitable for which case and which occupant behavior models should be applied. Initially defining the building design requirements (what, who, when, why) makes it easier to recognize the actual needs and purposes of the building occupant behavior model application. Such a categorization strategy can decrease the mismatch between predicted and actual energy use, increase the usability of suitable tools (occupant behavior models, energy simulation software), and increase confidence in the obtained results. Furthermore, practitioners can acquire a better understanding of the impact of occupant behavior on building energy use for different cases (see Figure 8-1).
Figure 8-1: Illustration of the driving factors (who, what, why, when) upon which a suitable energy modeling technique should be elaborated for each specific case (Gaetani et al. 2016) Figure 8-2 illustrates this categorization process. It assembles specific application scenarios from contextual factors. In fact, the sensitivity of energy use to occupant behavior is based on different factors (building scale, typology, occupant type and presence, time period). This illustrates that different levels require different knowledge to predict the energy usage as accurately as possible (because occupant behavior is not necessarily the most influential factor). The driving factors can be reduced to three effective dimensions that define the main objectives of energy modeling: •
Who and why: Stakeholder and problem;
•
What: Building type, services and provisions; and
•
When: Process stage and tools.
88
This approach helps ensure that the main objectives of the simulations are answered. It stimulates and triggers the designer to address the occupant behavior impact and by understanding the occupant behavior impact level (high/low) on energy use, the modeler can choose an occupant behavior model and energy prediction technique that is the most suitable for that case.
Figure 8-2: Illustration of correlation between the different variations of building scale, building typology, occupant type and presence, climate, and time period according to different scenarios: national energy standard, energy trends, energy contracting, peak shaving (Polinder et al. 2013) An example from commercial buildings illustrates this approach. As shown in Table 8-2, some aspects of office building energy use relate to occupant presence (“occupancy”), whereas others are a result of occupant actions (“behavior”). Beyond their mere presence, employees in open-plan offices typically have little influence on energy usage, whereas those in private offices have more controllable features that they can manipulate, as discussed in Case Study #3 of the report “Occupant behavior case study sourcebook” (ISBN 978-0-9996964-4-6). Table 8-2: Influential occupant behavior parameters in offices Interior Design Open plan office Activity-based office Cellular (private) offices
Presence-based Internal heat gains Lighting Internal heat gains Lighting Internal heat gains
Behavior-based Plug-load equipment usage Equipment usage Movement & location Manipulation of HVAC, windows, shades, lighting Plug-load equipment usage
Figure 8-3 adds an important aspect of the “what” question, i.e. automation. The case studies suggest that energy usage in small, manually controlled spaces is highly sensitive to occupant behavior, whereas large, automated spaces are only minimally sensitive to occupants’ actions. For different building types, the extent to which occupant actions (responding to comfort conditions and using equipment or home appliances) will drive energy usage varies. In cases where occupant behavior has 89
a relatively low impact on energy usage, simpler occupant behavior models and energy prediction techniques may be sufficient. Hence, it is important to distinguish between different building typologies that have different occupancy schedules when selecting appropriate energy usage prediction techniques.
Figure 8-3: Influence of occupant behavior on energy demand per occupant versus occupancy for different automation levels Furthermore, in each different design stage (when), a different level of accuracy is needed to predict the energy use. It is important that energy modeling is cost-effective, which implies finding a balance between model accuracy and the simulation aims (including allocated timeframe, money expenditure, and legal liabilities). However, there is clearly a lower threshold of acceptable accuracy, and this should increase as scientific understanding advances. Depending on the scope and goal of energy modeling (why), different energy modeling techniques may be most appropriate. During the conceptual design process, simple tools should be sufficient, enabling relatively simple estimation of energy consumption for a certain building type (residential, non-residential) and archetypal user profiles (students, family, elderly). In the final design stages, more time-consuming, expensive, and complex software tools should be used to increase the accuracy of energy use predictions. Figure 8-4 summarizes these relationships.
90
Performance gap, Model complexity
Time, project phase More detailed OB model Traditional design approach OB model complexity Figure 8-4: Performance gap between energy analysis using traditional and occupant behavior enhanced techniques across project phases Moreover, depending on the building scale, different levels of complexity are needed. As described by Gaetani et al. (2016), a more detailed and complex model is needed when energy usage for a single building is assessed (design/retrofit). However, using complex tools is not necessarily justified when conducting a simple estimation of energy use for a number of buildings in a residential district. Furthermore, larger errors might be obtained from simulations in which the design parameters are not adequately defined (instead using the default values) compared to when using simplified methods (rule of thumb or benchmarking). For a single building, occupant behavior needs to be more carefully modeled, whereas when predicting the energy usage of a certain building district (residential area), several other factors will influence the total energy use, and therefore detailed and complex modeling of user behavior is not necessarily efficient. Certain occupation profiles and scenarios can be used to estimate the representative energy usage of specific building types in a specific area (which can be derived from benchmarking results). Overall, the modeler should choose and critically justify the model complexity and technique for each individually investigated case to ensure that it is fit-for-purpose.
8.2. How to support decision making in different building project phases This section defines for each phase in the development of a building project, the key participants and decision makers, and the insights about occupant behavior that are most relevant.
91
8.2.1. Building project phases, stakeholder involvement, and occupant behavior implications Since the start of the environmental discussion in the 1970s (Program 1972, Meadows et al. 1972), the built environment disciplines have largely attributed improvement potentials to the building fabric and building services/systems and their impact on initial and operational energy. This is evident in the typical weighting of parameters in building performance-rating schemes such as LEED, BREEAM, DGNB, and Greenstar. The past decade has seen a broadening of scope that has recognized building occupants as operators of the building fabric and building systems, which implies both direct and indirect responsibility for the resulting greenhouse gas emissions. To evaluate the impact of this more holistic view of building operation on the built environment professions, it is important to consider how these professions commonly operate. In most countries, professional bodies propose subdivisions of the building process into separate stages to clarify responsibilities, deliverables, liabilities, and fee structures, and to provide templates and models. The guidelines should offer a clear template for the scope of professionals’ work through the different phases of a typical commission: early design, developed design, construction, handover and operation, retrofit. Every board of professionals generally adopts such guidelines. Table 8-3 provides an overview of the different project stages, as defined by official documents of the Royal British Institute of Architects, the American Institute of Architects, the Australian Institute of Architects, the FIDIC (Federation Internationale des Ingenieurs-Conseil), and the German Fee Schedule for Architects and Engineers HOAI (Honorarordnung für Architekten und Ingenieure). It is evident that the overall content of a building process is similar in all countries, and is likely to be similar in countries not listed in the table. However, what appears to be country-specific is the way in which the overall building process is subdivided into different project phases and the relationships between different stakeholders. This is likely to be due to differences in country-specific building culture, legal, and educational systems (Guy 2000, BDA document 2011). For the purpose of simplification and applicability in countries not mentioned in the table, the final column suggests how the different country-specific project stages can be summarized into four main phases. These phases have been established with regard to their relevance to different aspects of occupant behavior in buildings. The early design phase describes the part of the building process where the written or orally presented design brief is analyzed and translated into a visual “design narrative” in sketch format, capturing the essential characteristics of the proposed building. Depending on the specific project, parameters such as the degree of open vs. closed, indoor vs. outdoor, transparent vs. opaque, light vs. heavy, complexity of building management systems, ventilation type (e.g., natural, mechanical, hybrid ventilation) and HVAC strategies may be determined at this stage. These parameters have sufficient accuracy to describe the character and aspirations of the project, but are often not to scale, their dimensions are not determined, and systems and their functionality are not defined (Roetzel 2015). Once these qualitative decisions have been made, the following phase of “developed design” elaborates the sketch design into a set of construction drawings that can be provided to the builder, with detailed specifications about dimensions, materials and functionality of systems and controls (Roetzel 2015). The following construction phase then turns the set of drawings into the physical 92
building. This is followed by the final phase, where the built environment professions such as architects are commonly involved in the handover and operation of the building. In many countries, architects and structural engineers remain liable for 30 years or more, but they are not generally involved in the operational phase and rarely receive feedback, such as from post-occupancy evaluations. Occupant behavior necessarily remains a set of assumptions during the design phases, but it is possible to elicit occupant concerns early on and measure occupant behavior during the operational phase of a building’s lifecycle.
93
Table 8-3: Sequential stages of a building’s design process Stages from first to last in sequence 1 2
3
4
Royal Institute of British Architects (RIBA) Strategic definition Preparation and brief
Concept design
Australian Institute of Architects (AIA)
American Institute of Architects (AIA)
Development of Design Brief
Schematic design phase
Design phase (analysis of the brief and sketch design)
Design Development phase
Developed design Design development, documentation and building approvals
5
6
Technical design
Construction
Construction
Construction document phase
Bid or negotiation phase
Federation Internationale des Ingenieurs-Conseil (FIDIC) Scoping of Services Pre-Design
Concept Design
Developed Design
Preliminary Design
Construction Documentation
Building Warrant Drawing
Building Permission Application
Detailed Design Preparation of Tenders
In use
9
Retrofit
-
Post Construction -
Developed design
Tender Analysis
Handover and Close out
8
Early Design
Procurement
Construction phase
Defects liability period
Simplified summary of stages
Definition & Scope of Work
Schematic Design
Construction 7
Honorarordnung für Architekten und Ingenieure (HOAI)
-
Site Inspection & Work Supervision Administration & Documentation – Work Completion
Construction
Handover and operation
-
Retrofit
94
8.2.2. Participants in each phase In Table 8-4, the stakeholder involvement at different phases of a building construction project is summarized. While the involvement of different stakeholders in different project phases can vary depending on the project and country-specific requirements, building occupants are generally only consulted in operational phases (as they are often unknown in earlier phases). Rather than settle for no occupant involvement before the operational phase, deeper involvement may be an advantageous strategy.
Designers architecture
Engineers
Designers - Visuals
Specialist constructors
Local authorities
Public interest groups
X
X
X
(X)
X
?
Developed design
X
X
X
X
X
(X)
X
Construction
X
X
(X)
X
(X)
X
X
X
(X)
X
X
Handover and operation Retrofit
X
X
Main contractor
Owner X
Users
X
Occupants
Early Design
Phase / Stakeholder
Client
Table 8-4: Typical stakeholder involvement in a building construction project
X
X X
8.2.3. Occupant and user involvement in the design process Building users play a critical, but poorly understood and often overlooked, role in the built environment. There are good reasons to introduce the occupants’ perspective into the building design process. Janda (2011) argues that, to reach this goal, design teams need to develop their professional expertise to improve buildings and seek ways of integrating user involvement in building performance. As each building project differs in terms of occupants, users, and other stakeholders, it makes sense to apply a tailored occupant participation and engagement method. According to the European Project (NewTrend 2017), the aspects influencing the depth and breadth of participation are the building function, building characteristics, project objectives, project scale, technical characteristics, timescale, budget, client relation to occupants and users, client characteristics, design team characteristics, building occupancy, building use, continuity of occupancy/use, tenure, commitment to building, socio-economic characteristics, capacity for collective action, history of occupant engagement, knowledge of building, and financial investment.
95
The level of occupant involvement should be decided first, based on the scope and aim of the project. An appropriate set of methods and tools should then be chosen to define an occupant and user involvement concept. These methods include:
online forum (social media) surveys focus group discussions interviews public forums – open days consensus conference post-occupancy workshops, and others
Design teams can elicit essential feedback and input data from these methods to support and enhance the building design, achieve energy-efficient operation, and fulfill occupants’ needs.
8.2.4. Occupant behavior inputs needed in each phase To establish how to support decision making around the impact of OB, in each design phase, it is helpful to identify the key stakeholders, major decisions to be made, and impacts of these decisions on occupant behavior. Table 8-5 uses the project phases established in Table 8-2 and summarizes the stakeholders related to each phase, as derived from the description of responsibilities given by the different architectural bodies. In addition, the types of decisions made at each stage and how they are likely to have an impact on occupant behavior are identified. The case studies in the appendix contain several lessons to be learned in each project phase. Table 8-5: Stakeholders and decisions made in four main design phases Phase
Main stakeholders involved
Key decisions made
Client
Budget
Architect and client
Design narrative, attitude and atmosphere
Architect and client, specialist consultants
Basic volumetric geometry (building depth and height)
Architect and client, monitoring agents
Spatial relationships
Architect, client, builder, building authorities (permits), monitoring agents, building services engineers and specialist consultants
Building services systems (ventilation, heating, cooling, lighting systems) Building services controls
Early Design
Developed design
Impact of decisions on occupant behavior Predefines all other parameters, excludes options that exceed budget Basic volumetric and spatial characteristics, e.g., degree of open vs. closed, indoor vs. outdoor, transparent vs. opaque, light vs. heavy. Predefines thermal properties of the building envelope, magnitude of solar heat gains and façade properties. Predefines potential for cross and stack ventilation, predefines percentage of building that can be lit by daylight (indirect impact on lighting control) Predefines size of spaces and their location with respect to others. Predefines system dimensioning and control opportunities as well as group dynamics around the use of building controls
Predefines use of controls
Predefines use of controls
96
Construction
Architect, builder, monitoring agents
Handover and Operation
Building operator, building occupants Facilities manager, building operator, monitoring agents Facilities manager, building operator Building occupants Building occupants Building operator, building occupants
(complexity, accessibility) Façade typology, window opening type Shading systems Interior fit-out (material and acoustic properties) Adherence to the design and quality of construction n/a as all decisions are specified in the previous phase Type and use of office equipment
Predefines availability and use of natural ventilation Predefines control of shading Predefines space usage
Continuous commissioning, effects of changes made during the construction phase
Predefines internal heat loads, indirectly influences use of conditioning systems
State of systems maintenance
As-built conditions, predefines IAQ and use of systems and controls
Type of systems
Predefines IAQ and use of systems and controls
Group dynamics Personal attitude Furnishing and occupant density
Influences occupant interaction and use of controls Influences occupant interaction and use of controls Influences the number of occupants who have access to control systems
8.3. Supporting decision-making through modeling and simulation 8.3.1. Fit-for-purpose occupant behavior modeling and simulation in building design, control, operation, retrofit, equipment and policy Occupant behavior is an important source of uncertainty when dealing with building performance simulation (BPS) (Clevenger and Haymaker, 2006, Hoes et al., 2009). For this reason, an increasing number of models is appearing in literature to attempt modeling occupant behavior in a more realistic manner. Such models can be classified according to their complexity – here defined as in (Zeigler and Oren, 1979) as the amount of detail in a model, which in turn results from its size and resolution. At the lowest spectrum of complexity are the diversity factors – or schedules –: hourly fractions from 0 to 1 which are multiplied for a maximum amount of e.g. heat gains due to people, equipment, lighting, etc. Schedules are commonly employed to represent occupant presence and occupant behavior in BPS tools, due to their ease of use and to the incentives from the building code (Yan et al., 2015). However, it is argued that they are not representative of actual occupant behavior, which is typically stochastic and influenced by a high number of variables. Moreover, schedules neglect occupants’ diversity (O’Brien et al., 2017b). For this reason, researchers developed non-probabilistic, probabilistic, and agent-based models, which are supposed to give a more accurate representation of people’s behavior (Gaetani et al., 2016, Gunay et al., 2013), contain a review of the available modeling frameworks and to discuss their advantages and drawbacks. 97
It is important to note that uncertainties in BPS tools have a varied importance, according to the aim of the simulation. For example, a cumulative number of hours of equipment use over the year may be sufficient to evaluate a building’s yearly energy use, while it is not if the aim of the simulation is to investigate onsite-energy-matching strategies. As a consequence, the required confidence in the prediction depends on the aim of the simulation. Moreover, different buildings and performance indicators are affected in a diverse manner by the various aspects of occupant behavior: some cases are extremely sensitive to the way a particular aspect is modeled, while others may be barely affected. An overview of comparative studies aiming at identifying the best performing model among models of different complexities is given in Table 8-6, which shows how different studies identified different models as having the best predictive ability. This conclusion is in line with the assumption that different modeling complexities are appropriate for different cases. In this context, it is apparent how choosing the most suitable model for each aspect of occupant behavior for a given case is a complex task. Annex 66 contributed to providing guidelines to support BPS users in this task by means of the fit-for-purpose occupant behavior modeling (FFP-OBm) strategy (Gaetani et al., 2017a). The strategy is based on the conviction that goodness-of-fit should not be the only method to compare models. Instead, in order to guarantee generalizability to other datasets, fit-for-purpose is deemed a valid indicator. A fit-for-purpose model is good enough to do the job it was designed to do (http://www.macmillandictionary.com/dictionary/british/fit-for-purpose.). The FFP-OBm strategy is based on two main concepts: i) there is a trade-off between abstraction error and input uncertainty when increasing the modeling complexity (i.e., more complex models do not necessarily yield better results), and ii) the modeling complexity for each aspect of occupant behavior should depend on its impact on the results – there is no sense of increasing modeling complexity of an occupant behavior aspect that has been proven trivial. The first concept is included in the strategy as an uncertainty analysis which allows to filter-out modeling complexities according to the phase in the building lifecycle. The second concept – based on the notion of building robustness to occupant behavior (Hoes et al., 2009) – is integrated with a sensitivity analysis using the statistical Mann-Whitney U test. Figure 8-5 illustrates the FFP-OBm strategy.
98
Table 8-6: Comparative studies identifying best performing occupant behavior model among different complexity models (Gaetani et al., 2016)
Author(s) year [Ref.] Mahdavi and Tahmasebi (Mahdavi and Tahmasebi, 2015) Tahmasebi et al. (Tahmasebi et al., 2015) Tahmasebi and Mahdavi (Tahmasebi and Mahdavi, 2017) Duarte et al. (Duarte et al., 2013) D’Oca et al. (D’Oca et al., 2014) Langevin et al. (Langevin et al., 2014) Chapman et al. (Chapman et al., 2014) Azar and Menassa (Azar and Menassa, 2010) Yamaguchi et al. (Yamaguchi et al., 2012)
Type of behavior Occupancy
Occupancy, lighting and plugloads Occupancy
Occupancy Window opening and thermostat adjustment User behavior User behavior Blinds regulation, lighting/ equipment, DHW User behavior
Aim of simulation; performance indicator; building typology Systems control; daily occupancy profile; (single, semi-closed, open-plan) office Annual and peak energy demand for heating and cooling; office Annual and peak energy demand for heating and cooling; office
Models considered for comparison = best performing model(s), = other considered model(s) NonSchedule Agentprobabilisti Probabilistic s based c
(energy PIs)
(presence distribution and peak values)
Daily occupancy profile; (single, open-plan) office Design; energy demand for heating; household
Energy demand and thermal acceptability; office Design; energy demand; office and household Electric/gas demand; university
(behavior duration, transitions)
Behavior duration, start/end time, number of transitions, probability distribution, number of different patterns 99
(variety of behavior patterns)
8.3.2. FFP-OBm strategy
Figure 8-5: FFP-OBm strategy step-by-step All the steps of the FFP-OBm are explained in detail in “Occupant behavior modelling approaches and evaluation” (ISBN 978-0-9996964-1-5). In the following section, a case study is presented to illustrate how increasing modeling complexity of trivial occupant behavior aspects proved to be an unnecessary time/resources expenditure.
100
8.3.3. Case study: increasing modeling complexity of trivial occupant behavior aspects A testbed of 16 different cubicle office variants was modeled in EnergyPlus v8.3 (Gaetani et al., 2017b). In order to investigate a variety of cases, two climates, two window-to-wall ratios, two power densities (lights and equipment) and two building constructions were defined (Occupant behavior case study sourcebook, ISBN 978-0-9996964-4-6). The Mann-Whitney U test was employed to conclude whether cooling energy, heating energy, and weighted overheating hours (WOH) were affected by occupants’ presence, HVAC use, heating and cooling setpoint, use of lights, equipment, windows and blinds. In this report, only the effect of use of lights, windows and blinds on the cooling energy of two building variants (Variant A and Variant B) is considered. The Mann-Whitney U test showed that the cooling energy of Variant A is affected by lights use, while the cooling energy of Variant B is affected by blinds and windows use. Widely used stochastic models (Haldi and Robinson, 2009, Haldi and Robinson, 2010, Reinhart, 2004) were employed to test the effect of increasing modeling complexity for lights, windows and blinds use in both cases. The results are reported in Figure 8-6 and Figure 8-7. Generally, it can be noted how applying higher complexity models to trivial aspects of occupant behavior leads to negligible effects in the results. For example, in figure 8-6, the cooling energy consumption is more sensitive to lights use, while as for figure 8-7, it is more sensitive to blind use.
Figure 8-6: Effect of implementing stochastic models for lighting (L), blind (B) and window (W) use on the cooling energy of building Variant A (sensitive to lights use) (Gaetani et al., 2017b)
101
Figure 8-7: Effect of implementing stochastic models for lighting (L), blind (B) and window (W) use on the cooling energy of building Variant B (sensitive to windows and blinds use) (Gaetani et al., 2017b) In conclusion, the appropriate application of occupant behavior model depends on a number of factors; the FFP-OBm strategy attempts at offering guidelines for the BPS user to achieve efficient, informed decision-making and ensure the required level of confidence in the prediction. A simple case study proved the validity of the FFP-OBm strategy assumption that the modeling complexity for each aspect of occupant behavior should depend on its impact on the results. An issue which emerges when using higher complexity, stochastic models, is how to deal with the presentation and deployment of results with various modeling techniques. This topic is the core of the following section.
8.3.4. Presentation and deployment of results from different modeling techniques A parametric study was performed for a generic perimeter office space in Ottawa, Canada to identify how different occupant behavior modeling approaches affect predicted energy use and comfort and how these approaches may influence design decisions (Gilani et al., 2016). In particular, the impact of conventional and probabilistic occupant modeling approaches on daylight and energy performance in the design process were evaluated. Generally speaking, conventional occupant modeling failed to capture the influence of building design over occupants’ behavior, and vice versa. The static and stochastic occupant behavior modeling approaches yielded different optimal design regarding energy consumption. For instance, WWR 60% and 40% generally yielded the lowest lighting electricity use with the static and stochastic cases, respectively (Figure 8-8). Figure 8-8 also explores a representation of uncertainty using error bars. The results of this study necessitate more advanced occupant behavior models as requirements
102
for code compliance modeling to prevent the two risks associated with the use of conventional occupant models: inaccurately predicted building performance and sub-optimal designs.
Figure 8-8. Annual lighting electricity use under static and stochastic occupant behavior modeling for: (a) Design option 1 (baseline design), (b) Design option 2 (window type), and (c) Design option 3 (blind transmittance).
8.4. Occupant behavior modeling conclusions and future needs This chapter has shared insights from a rich set of case studies of occupant behavior analysis and energy modeling in buildings. The case studies summarized in the appendix provide a wealth of illustrations of occupant behavior modeling applications. Table 8-7 provides an overview of the case studies. Table 8-7: Overview of occupant behavior modeling case studies Timeframe Where Building types Building size Owner type Occupant type
2009-2017 USA (12), Europe (8), China (8), Rest of Asia (4) Office (20), residential (8), government (2), laboratory (1), school (1) Large (0), medium (15), small (17) Public (10), private (13), government (7), university (2) Office workers (22), residents (8), students (2)
The key findings of this chapter include: The amount of influence that occupant behavior has on building energy consumption varies according to the degree of automation, interior layout and personalization of spaces, the relation between internal and external thermal loads, and occupant schedules, plus numerous less-important factors. Designers should understand the approximate relative importance for their project before investing in detailed analysis. The degree of precision regarding occupant influences on energy consumption varies significantly over the phases of a building’s life, spanning early design, developed design, construction, operation, and retrofit. This should inform the selection of tools for incorporating occupant behavior insights, and guide a preference for simple rather than complex tools when feasible. By answering “who,” “what,” “why,” “when,” and “where” questions, analysts can better select the most appropriate occupant behavior modeling tools for each specific application. Increasing modeling complexity of non-influential OB aspects does not lead to improved results, but involves an unnecessary time expenditure. 103
The selection of appropriate modeling complexity for the case at hand is a complex function of the purpose of the simulation and of the building case. The FFP-OBm complexity attempts to provide a framework for such selection. More work is needed on several topics, including the following.
A complete framework for classifying applications of occupant behavior modeling The chapter begins the development of a framework for classifying applications of occupant behavior modeling. This is an important and ongoing task. A better framework will allow users to match models to applications more effectively, achieving a “fit for purpose” modeling standard.
Changing occupant and operator behavior in existing buildings Encouraging behavior changes can help achieve significant reductions in energy consumption within buildings. This brings the need for both hardware and software provisions to influence behavior. Hardware provisions refer to technologies that help occupants and operators to make adjustments in temperature settings, operation of windows and blinds, and optimization of central air-conditioning plants. Software includes programs to encourage cultural changes, awareness, information regarding energy performance, and efforts to enhance occupant and operator knowledge. Three case studies (Occupant behavior case study sourcebook, ISBN 978-0-9996964-4-6) demonstrate these effects and highlight the value for further research on the combinations of hardware and software that would be most effective in bringing changes to the behavior and practices of the occupiers or operators of buildings.
Need for a design guideline on occupant behavior in buildings The value of occupants has increased over the past decades, transitioning from workers in an ‘office factory’ to highly valued staff whose health and well-being at the workplace is crucial to employers (Roetzel et al. 2010). This tendency is clearly displayed in the recent emergence of certification systems that assess health and well-being of occupants in buildings, such as the WELL Building Standard (http://standard.wellcertified.com/). Designers are generally not yet equipped with specific knowledge on the environmental and comfort implications of occupant behavior. In Annex 66, the behavioral patterns of people have been investigated and modeled and a considerable amount of knowledge has been assembled about the relationship and interactions between buildings, interior spaces, and people. Mechanical and electrical systems, window structures, shading devices, and whole facades should be designed in to account for the usability and actual usage patterns of occupants. One of the key parameters of large office building developments is the occupant density in the office spaces. Occupancy research conducted as part of Annex 66 could help designers to calculate expected real occupancy and internal heat gains for their design, instead of or alongside the rule-of-thumb of design standards. Many other design parameters predefine occupant behavior through control zone sizes, thermostat locations, and usability.
104
Therefore, we argue that there is a need for a design guideline for built environment professionals that specify the environmental implications of occupant behavior in buildings. In the future, outcomes of the field of energy-related occupant behavior research could greatly enhance the design process in practice.
Supporting decision making through monitoring, modeling, and simulation Monitoring of occupant behavior in existing buildings provides data for calibrating both design and operations models. Modelers can choose appropriate strategies based on the building lifecycle phase and the associated profiles drawn from an inventory. These associated profiles present similar building and occupant profiles, and have a similar occupant behavior effect. Through statistical analysis, it becomes possible to create different diversity profiles for different categories (such as type of occupants, type of building) for each specific development (design) stage. In general, such an inventory helps analysts to choose the most appropriate modeling technique (appropriate level of complexity in occupant behavior modeling) and allows a basic determination of the correlation between the occupants and energy usage. For example, Samuelson et al. (2016) showed that calibration can substantially reduce errors relative to the incremental cost of performing careful calibration. Similarly, D’Oca et al. (2015) highlighted the potential for knowledge discovery in databases to create an occupancy schedule learning framework. Determining the impact of occupant behavior on energy use alone is not enough. It is also important that such information be provided to the occupants so that they understand how their behavior affects the building’s energy consumption. This allows them to increase their awareness and may trigger more energy-efficient behavior.
Need for investigation of qualitative influences on occupant behavior in buildings As indicated in Table 8-4, the operational phase is characterized by a number of influences that are subjective in nature (Roetzel and Chen 2016). Social and organizational norms (e.g., sustainability policies at the company level) can influence the way a building is operated (Chen and Knight 2014, Cui et al. 2017). Individual attitudes towards energy savings are situated in this social and organizational context and can influence the individual use of controls. Perceived behavioral control, group dynamics, subjective norms, and perceived spatial hierarchy influence whether controls that are physically or technically available to occupants are actually used as intended. This may not be the case if the operation of controls is, in the perception of individual occupants, associated with a degree of social discomfort. In addition, the quality of maintenance can influence the long-term functionality of available controls. While Annex 66 has focused on quantitative influences on occupant behavior, the investigation of qualitative influences provides an interesting field for future research. In conclusion, applications of occupant behavior modeling are increasing and it is important to focus on how well the available tools match specific applications. The value of these tools increases when matched to appropriate phases in the building’s lifecycle and to specific cases in which occupant behavior matters to outcomes. The applications summarized in the attached case studies show that there is much more to mine in this rich vein.
105
9. Interdisciplinary Approaches to Studying Occupant Behavior The issue of occupant behavior and its impact on building energy use is a highly complex problem that is not influenced by technology-driven measures or technologies alone. Researchers in Annex 66 activities argue that achieving global energy efficiency and carbon reduction goals in the building sector require an interdisciplinary understanding of the “human dimensions” of building energy use. In this context, Annex 66 proposed a research agenda integrating occupant behavior within an interdisciplinary approach that combines insights from the technical, analytical, and social dimensions of building energy use. Research under Annex 66 activities aims to establish methodologies, case studies, an innovative research framework, and tools to support researchers in the interdisciplinary fields of building, social, and data sciences, to better understand and quantify the influence of occupant behavior on building energy performance. This chapter summarizes the main activities, outcomes and findings from interdisciplinary research under Annex 66, including: (1) the needs and approaches of interdisciplinary research, (2) a review of occupant behavior survey studies, (3) the integrated occupant behavior framework and cross-country occupant behavior survey, and (4) the challenges of interdisciplinary occupant behavior research.
9.1. Needs and Approaches for Interdisciplinary Theories of Human Behavior The problem of understanding occupant behavior in buildings, and the associated energy outcomes, is very complex and requires the integration of perspectives from multiple disciplines. Therefore, an interdisciplinary process that encourages the integration of research, theories, and methodologies from multiple disciplines is needed. However, this type of research can be extremely difficult because of discrepancies in methodological and epistemological views, as each discipline has its own set of assumptions, theories, and worldviews that inform selected research designs. As stated by Repko (2008, p. 104) “The methods a discipline favors correspond to the theories it embraces.” One of the challenges to interdisciplinary research is the need to blend varying methods and research tactics to better understand the problem. In Annex 66, theoretical frameworks and behavioral science theories from social sciences were leveraged to understand occupant behavior in buildings, and research tactics and methodologies from other disciplines—especially engineering and architecture—were used to gather data. The blending of disciplines was challenging, but ultimately, appropriate methodologies and approaches were used and integrated throughout the research period. Interdisciplinary research is essential for educating and informing building designers, engineers, social scientists, and policy makers on the multifaceted dimensions of designing and building energy-efficient systems and networks (Editors of Nature 2015). Interdisciplinary research links two or more distinct 106
scientific fields in an integrative way that combines the fields’ frameworks, study designs, and methodologies to create a homogeneous perspective and pursue complex problems (Stephenson 2017). Innovation in research and development is established around the understanding of the socio-technical link between building occupants’ behavior and the use of building technologies, energy services, and controls. This interdisciplinary approach can be described as a two-way exchange of knowledge from socio-technical disciplines of science, in which: “sociologists can provide more insight into macro-level factors that shape […] energy use. Also, input from environmental scientists can be of valuable importance to further improve intervention studies. The environmental sciences can help translate energy-related behaviors […] into their environmental impact, e.g., in terms of CO2 emissions, and help select high-impact behaviors” (Abrahamse and Steg 2011). Advances in interdisciplinary research have emerged through the integration of the relevant frameworks, and have been used to better understand human–building interactions in terms of both the building physics and social sciences. Research by Allison (1969), Axsen and Kurani (2012), Ryghaug and Toftaker (2014), Sheller and Urry (2016), and Sovacool (2017) confirms that, while disciplinary theories contribute important understandings of behavioral phenomena, blending aspects of interdisciplinary theories can provide additional interpretations and insights. In this picture, further research integrating multiple theories, comprehensively describing the energy-relevant human–building interactions in office buildings based on the knowledge of interdisciplinary fields, will provide beneficial data. A conceptual framework for assessing energy use in the domestic sector was developed by Kowsari and Zerriffi (2011). Recently, Von Grabe (2016a, b) postulated a systematic framework for the energy-related human– building contextual factors with the aim of providing a synergetic organization of this interaction phenomena in buildings. Likewise, Wolske et al. (2017) introduced an integrated framework that combines variables from behavioral theories to explain consumers’ interest in residential solar photovoltaic systems. Similarly, based on a theoretical framework integrating multiple theories and disciplines, Li et al. (2017) developed a survey instrument for gathering interdisciplinary knowledge on energy use behavior in buildings. Li’s study provided survey data on statistical models of occupant behavior, providing insights into occupant energy-saving behavior and characteristics as a function of motivation, opportunity, and ability to interact with building technologies. Importantly, Li’s study also provides useful suggestion on occupant interventions. In the following sub-sections, a set of theories that address the broader scope of social and building engineering contributions to the occupant behavior literature is illustrated, including the Social Cognitive Theory (Bandura 1986), the Theory of Planned Behavior (Ajzen 1991), Theory of Practice (Shove 2014), as well as the Actor-Network Theory (Latour 1994) and the Attitude-Behavior-Context (A-B-C) model (Abrahamse and Steg 2009). Table 9-1 summarizes examples of commonly used social science theories in occupant behavior and energy behavior research.
107
Table 9-1: Examples of theories used to examine occupant and energy behavior Theory Name The Attitude Behavior Context (A-B-C) Model Norm Activation Model (NAM) Sustainable Energy Technology Acceptance Model (SETA) Social Cognitive Theory
Social Practice Theory
Technology Acceptance Model (TAM) The Theory of Planned Behavior (TPB)
The Theory of Practice (TP)
Value-Belief Norm Theory (VBN)
Original Authors Guagnano et al. (1995). Influences on attitude-behavior relationships: A natural experiment with curbside recycling. Environment and behavior, 27(5), 699-718. Schwartz, S. H. (1977). Normative influences on altruism. Advances in experimental social psychology, 10, 221-279. Huijts et al. (2012). Psychological factors influencing sustainable energy technology acceptance: A review-based comprehensive framework. Renewable and Sustainable Energy Reviews, 16(1), 525-531. Bandura (1986). Social foundations of thought and action: A social cognitive theory. Englewood Cliffs, N.J.: Prentice-Hall. Giddens (1979) ‘Central Problems in Social Theory. Action, structure and contradiction in social analysis,’ Contemporary Social Theory. Bourdieu (1990). The logic of practice. Stanford University Press. Davis (1989). Perceived usefulness, perceived ease of use, and user acceptance of information technology. MIS quarterly, 319340. Ajzen (1991). The theory of planned behavior. Organizational behavior and human decision processes, 50(2), 179-211. Bourdieu (1969) ‘The logic of practice,’ Studies in Philosophy and Education, 7(1), pp. 28–43. Bourdieu (1977) ‘Outline of a Theory of Practice,’ Cambridge studies in social anthropology, 16(16), p. 248. Giddens (1979) ‘Central Problems in Social Theory. Action, structure and contradiction in social analysis,’ Contemporary Social Theory Reckwitz (2002) ‘Toward a Theory of Social Practices: A Development in cultural Theorizing,’ European Journal of Social Theory, 5(2), pp. 243–263. Stern et al. (1999). A value-belief-norm theory of support for social movements: The case of environmentalism. Human Ecology Review, 81-97.
9.1.1. The Social Cognitive Theory The Social Cognitive Theory (SCT) developed by Bandura (1986) describes human behavior as a dynamic interplay of environmental, personal, and behavioral factors (Figure 9-1). According to SCT, people learn a certain behavior by observing others under the influence of these three factors (triadic reciprocal determinism). In other words, what people perceive (environmental physical and social factors, comfort and control), believe (personal factors), and do (exercised past behavior) affects their own and other people’s behavior (exercised future behavior). By applying SCT, one study attempts to investigate how occupant perceptions of their physical and social environment, such as building characteristics, social norms in the workspace dynamic, and perceived comfort sensation and behavioral control over the shared indoor environment, affect their reported behavior (D’Oca et al. 2017). In turn, this knowledge became a functional predictor for their intended future behavior.
108
Figure 9-1: Triadic reciprocal determinism of environmental, personal, and behavioral factors in Social Cognitive Theory
9.1.2. The Theory of Planned Behavior The Theory of Planned Behavior (TPB) developed by Ajzen (1991) has been widely adopted by researchers in the fields of energy and social sciences to analyze pro-environmental behavior and target specific attitudes, subjective norms, and perceived behavioral control shaping intentions. According to TPB (Figure 9-2), an individual’s intention towards that behavior is the major predictor of behavior, and can hence be considered the direct antecedent (proxy) for behavior. In turn, behavioral intention is influenced by three key components: (1) attitude, (2) subjective norms, and (3) perceived behavioral control (PBC). Confirming Ajzen’s theory, Kaiser and Gutshcer (2003) demonstrated that the three components of TPB were capable of predicting up to 81% of an occupant’s intention for energy conservation in their home. Similarly, Greaves et al. (2013) studied energy-related behavior within a workplace, and determined that TPB explained 46–61% of the variance in employees’ intentions to engage in pro-environmental behavior, such as turning off their computers when leaving their desk, using video conferencing rather than traveling to meetings, and recycling at work.
Figure 9-2: Framework of Theory of Planned Behavior explains attitude, subjective norms, and perceived control influencing the exercised adaptive control in office buildings
109
9.1.3. The Theory of Practice The Theory of Practice (TP) is a social theory stating that behavior cannot be seen only as individual actions (where all social phenomena are explained in terms of individual actions). Instead, the theory suggests that behavior is an outcome of complex inter-relationships and shared social practice, including the influence of the (social and physical) environment in which they occur. The theory explains that a practice is a constant interplay between social structure and human agency, which shape one another in a dialectic process. As argued by Chappells and Shove (2005), other human and non-human actors play an important role in why people (with diverse motives and intentions) behave in a certain way. They developed a three-element model incorporating materials, meanings, and procedures. This implies that behavior is a product of the relationship between people, their environment, and the technologies that surround them. TP is, as Reckwitz (2002) further explains, fundamentally different from TPB. The latter is based on the “homo economics” principle, which explains human action through recourse to individual purposes, intentions, and interests; social order is then a product of the combination of single interests. The model of “homo sociologicus,” which is the basis of TP, explains human actions by pointing to collective norms and values. Social order is guaranteed by a normative consensus, embedded in collective cognitive and symbolic structures and in a ‘shared knowledge,’ which enables a social, common, shared, or collective way of ascribing meaning to the world.
9.2. Case studies of occupant behavior using interdisciplinary approaches This chapter presents four important case studies of interdisciplinary work to enrich the overall understanding of occupant behavior. The following sections discuss four case studies in terms of their purpose, methodology, results, and implications.
9.2.1. Case study I: Energy saving behavior in commercial buildings Project title: Investigating willingness to save energy and communication about energy use in the American workplace with the attitude-behavior-context model (Xu et al. 2017). The purpose of this study was to investigate the willingness to save energy and communication about energy use in the American workplace through the Attitude-Behavior-Context (A-B-C) model (Abrahamse and Steg 2009). Built on the A-B-C model (Figure 9-3), this study examined how attitudinal factors (i.e., belief about the importance of energy saving and belief about the comfort–productivity connection) and contextual factors (i.e., group norms and organizational support) were associated with 1) employees’ willingness to save energy at work at some cost to personal comfort and 2) the perceived ease of communicating with coworkers about saving energy.
110
Figure 9-3: The Attitude-Behavior-Context model A total of 245 employees in the United States completed an online survey containing both quantitative measures and open-ended questions. Five-point Likert scales were used to measure the following variables: willingness to save energy, perceived ease of communication, energy saving belief, comfort– productivity belief, group norms, and organizational support. Regression analyses were conducted with the attitudinal variables, contextual variables, and their interactions as predictors in the model. Approximately 50% of the participants indicated a willingness to save energy at work at some cost to personal comfort, and about 65% of the participants reported that it was easy to communicate with their co-workers about energy saving. Regression results showed that employees who believed in the importance of saving energy were more likely to sacrifice some personal comfort to save energy. Instead, those who did not think comfort and productivity were associated were more likely to sacrifice comfort when they perceived organizational support; positive group norms were associated with perceived ease of communication about energy saving, but only for employees who believed energy saving to be important. The most frequently cited reasons for not being willing to save energy were comfort needs (39.5%) and concerns about work productivity (34.9%). However, these concerns may not be well-grounded, as several scholars (Dear et al. 2010) have found that ideal productivity could be acquired over a vast range of indoor conditions according to the adaptive comfort theory. The survey participants cited co-workers not caring about the energy/environmental issues as the major barrier to communicating about energy saving, which supports the finding that contextual factors (the group norms) are important. This was one of the first studies to integrate social psychology, occupant behavior, and building design theory to enhance the understanding of energy behavior in office buildings. It demonstrated, most importantly, the interactions between attitudinal factors and contextual factors in affecting energy behavior at work. The findings can be used to design better energy saving programs based on employee characteristics, as well as to cultivate an organizational culture that fosters energy-saving behavior. The findings confirm the necessity to consider human factors in the modeling and simulation of building energy use.
111
9.2.2. Case study II: Residential occupants’ energy saving behavior Project title: Thermal comfort or money saving? Exploring intentions to conserve energy among lowincome households in the United States (Chen et al. 2017). The impact of one important residential group—low-income households (LIHs)—has been repeatedly overlooked in the residential energy sector (Allen et al. 2006, Dong et al. 2013, Farley and Mazurstommen 2014, Silva and Ghisi 2014). Based on an extended TPB framework (Ajzen 1991), which includes the major variables proposed or proven to predict energy-saving intention (e.g., attitude towards energy saving, perceived behavioral control, social norms, energy-environmental concerns, cost concerns, thermal comfort needs, climate zone, and some demographics), this study attempted to answer the following series of questions: 1) What are the most important social psychological factors influencing LIHs’ energy conservation motives? 2) Among LIHs, are climate zones and demographics predictive of energy-saving intentions? and 3) Does the extended TPB framework outperform the original TPB framework in predicting energy-conservation intentions among LIHs? Previous studies failed to examine the social-psychological variables at play in the actual adoption of these programs. This research used tools to better understand and engage the LIH population in energy-saving practices. An Internet survey was distributed among 248 LIHs in the United States. Participants had to pay non-flatrate electricity bills and have an annual income of less than twice the federal poverty level to qualify. Participants were spread across seven of eight climate zones in 43 states and the District of Columbia. Regression analysis was conducted to determine the impact of each independent variable on energy saving intentions. This study found that low-income families, in general, expressed a mid-level intention to save energy. On each item measuring intention to save, at least 75% of the respondents indicated somewhat positive intentions to conserve energy. The TPB variables (attitudes, subjective norms, and perceived behavioral control) were all significant and accounted for half of the variance in energy-saving intentions. Attitudes had the greatest impact, followed by PBC. In the extended TPB model, cost concerns had the strongest positive impact, while the thermal comfort needs had the next strongest impact, albeit negative; energy concern and frugality each had a positive impact on energy saving intentions. In terms of the influence of demographics, females had a greater tendency to save energy, and residents in warmer climate zones had stronger intentions than residents in colder climate zones. The extended TPB framework was proven to outperform the original framework in predicting energy-saving intentions. This research shows that internal values and perceptions, such as attitude, energy concerns, and PBC, have greater influences than external factors. Most notably, surveyed LIHs had a low level of PBC, and PBC was demonstrated to be one of the most important predictors of energy-saving intention. This echoes the previous finding that a lack of control over one’s environment is a major barrier to conserving energy. To conclude, we advocate the consideration of social-psychological variables in improving the design of energy saving programs among LIHs.
112
9.2.3. Case study III: A review of occupant behavior survey studies Project title: Investigation of methodology applied and limitations of 33 occupant behavior surveys (Belafi et al. 2017). In this case study, 33 studies on occupant behavior using cross-sectional surveys or interviews for data collection were reviewed (Belafi et al. 2017). Although these studies contributed to the field of energyrelated occupant behavior research, this review showed that many methodological aspects of the questionnaire surveys were poorly considered or entirely neglected. This issue may have introduced significant bias into the results of these studies. Cross-sectional surveys are useful tools for gaining information of energy-related occupant behavior. However, the information in the literature is scattered in terms of occupant action, building type, and geography (Figure 9-4).
Figure 9-4: Temporal and geographic distribution of survey projects reviewed In most cases, researchers focused on a particular environmental or other physically tangible parameter that drives human behavior. These projects were designed and conducted by researchers with backgrounds in technical and engineering fields. Therefore, important issues from the field of social science were ignored or oversimplified, and many other key aspects of human behavior were not measured or considered. The field of energy-related occupant behavior research could benefit from the
113
adoption of surveying methods developed by experts in the social sciences to ensure that surveys are comprehensive and integrate the relevant social and behavioral aspects. The importance of a valid construction in ensuring the reliability of results was demonstrated. Moreover, the phrasing of the questions must be clear, and high-quality translations are needed in the case of international studies. Defining a clear branching structure and using smart piping techniques to eliminate superfluous questions and answer choices, and reducing the length of the questionnaire to 15–20 minutes, is essential. This might also influence the selection of appropriate survey tools for the research. With a clear structure, it is also easier to manage and process datasets from different countries. Some studies reviewed introduced monetary incentives to obtain higher response rates (lottery, raffle), which might help to motivate occupants to complete the questionnaire. At the same time, the phrasing of the invitation email should be clear, and must introduce the research topic in an interesting way to achieve a high response rate from occupants. This review of survey distribution methods shows that obtaining an appropriate contact database is essential for the success of large-scale cross-sectional projects, as both the quality and quantity of survey responses are crucial. The sample size was rarely discussed in the studies reviewed. It appears likely that the sample size was mostly determined by the resources available to reach respondents. Therefore, it is highly recommended that future cross-sectional questionnaire projects provide statistically appropriate sample size calculations to ensure the reliability of the results obtained from datasets. In addition, understanding the errors and limitations of a dataset when an appropriate sample size could not be reached is necessary. Ensuring sample diversity and appropriate geographic coverage is also important, and another key element is accounting for the similarities and differences in specific buildings and rooms in which the questionnaire was completed. Complementary datasets are beneficial, but can be difficult to obtain with large sample sizes. Data on the environmental conditions of the responding occupant should be collected at the time of their answers as part of the cross-sectional questionnaire.
9.2.4. Case study IV: Understanding architectural and social-psychological influences on occupant behavior in office buildings Project title: Understanding qualitative and quantitative influences on occupant behavior in offices (Roetzel and Chen 2016). The aim of this study was to understand the interplay of social-psychological and architectural parameters in influencing occupant behavior and the resulting operational energy consumption in offices. Existing literature on occupant behavior was reviewed from both architectural and social-psychological perspectives. The key influences identified by both disciplines were mapped into the framework of Integral Sustainable Design (ISD), with the aim of providing a more holistic framework for further research.
114
Annex 66 originally emerged out of a building simulation context, and the nature of the simulation tools required occupant behavior to be approached in a quantitative manner. While the actions or patterns of behavior can be described quantitatively, the drivers (why people act) are often qualitative in nature. To translate qualitative behavioral drivers into quantitative simulation inputs, a more holistic understanding of occupant behavior was required (Roetzel and Chen 2016). The theoretical approach of ISD (DeKay and Bennett 2011) based on Wilber’s (2000) Integral Theory provides a framework for a more holistic understanding of occupant behavior. It examines any occurrence from multiple, simultaneous qualitative and quantitative perspectives. These perspectives are represented by four quadrants (see Figure 9-5), with the upper-left quadrant focusing on experiences (subjective + individual), the lower-left quadrant on cultures (subjective + collective), the upper-right quadrant on performance and behaviors (objective), and the lower-right quadrant on relationships and context (objectives, systems). For this study, the ISD approach was used to frame a preliminary literature review focused on identifying social-psychological and architectural parameters that influence occupant behavior and the resulting operational energy consumption in offices. The identified occupant behavioral parameters were mapped to the four quadrants of the ISD approach, as illustrated in Figure 9-5. The upper-left quadrant accounts for individual experiences as a result of social and architectural context, which influence human behavior. The lower-left quadrant refers to collective interpretations (social norms) in which the individual experiences are situated. The upper-right quadrant refers to influences on occupant behavior, which can be attributed to the building and its controls. The lower-right quadrant describes influences on occupant behavior, which are defined by contextual relationships between occupants and the building.
Figure 9-5: Architectural and social-psychological parameters mapped across the four quadrants of the ISD
115
This study demonstrates that the ISD approach can be used to frame future occupant behavior research in a more holistic way. The preliminary literature review identified influences on occupant behavior from the perspectives of social-psychology and architecture, opening up pathways for more in-depth inter- and trans-disciplinary research in the future.
9.3. Interdisciplinary cross-country research methodology The following briefly describes the interdisciplinary cross-country research methodology developed within the framework of Annex 66 and its background. Interdisciplinary research among behavioral and energy-related fields could be employed through crosscountry studies by analyzing occupant behavior data from diverse backgrounds and cultures. Despite a wealth of research in recent decades, there is still a shortage of social scientists and engineers who are trained in conducting cross-country and comparative studies (Leeuw et al. 2008). In particular, few occupant behavior researchers have conducted comparative studies across countries or continents. Within the context of occupant behavior studies, researchers could use cross-country surveys to compare the diverse characteristics of occupant behavior under various building sectors and social-psychological influences, which would facilitate interdisciplinary collaboration. In some cases, cross-country survey research could be similar to other forms of survey analysis, albeit with certain key differences that distinguish an effective study from one that is ineffective. For example, a monocultural study can utilize tailored language and culture-specific concepts, while a multicultural study cannot for fear of cultural bias. Monocultural studies should produce reliable and valid data within a national context that are still capable of being compared and harmonized across contexts (Leeuw et al. 2008). Comparative research at the national level benefits the country conducting the research as well as any countries that utilize the data; the initial country receives data that, for example, can be used to identify significant intra-country trends, and other countries can use the same data to compare a variable under different demographics. These provisions of comparative research result in benefits such as stronger correlations and a framework that can be utilized in future research. A common challenge for comparative research across countries is the cost. Despite the apparently expensive and complex nature of obtaining multinational data, refined research methods are not guaranteed. Cost is a large obstacle preventing comparative studies from pre-testing questions and developing effective surveys. Harmonizing research methodologies and data across countries is also challenging because of cultural differences. When language, research practice, and data collection methods differ between two or more countries, the number of variables that must be controlled for becomes important. For example, a country that values living with family past young adulthood versus a country that does not hold that value will most likely have different socio-demographics and energysaving behaviors. Methodologies used in one culture should be rigorously analyzed to account for cultural bias, validity, and reliability before being used in another cultural context (Leeuw et al. 2008). Comparative research ensures quality data through a high rate of comparability. A common method of ensuring this comparability is to retain as many variables as possible. However, this is not always optimal 116
because of different definitions and practices that can limit survey analysis. By using standardization practices to enhance comparability and determine the stipulations of a study between countries, researchers can analyze cross-national studies through a uniform metric system (Leeuw et al. 2008). Therefore, a uniform system would strengthen the reliability and establish connections among multiple nations, which future studies could utilize to ensure the continuation of occupant behavior research.
9.4. Outcomes from the interdisciplinary research 9.4.1. Interdisciplinary research framework Reflecting the emergent trend in energy and social sciences research, one of the goals of Annex 66 was to develop a data-driven research framework integrating multiple theories and interdisciplinary aspects relevant to occupant behavior research. D’Oca et al. (2017) explored and combined theories and insights on the technical and social dimensions of human–building interaction to support researchers in the fields of building and social sciences to better quantify the influence of occupant behavior on building energy performance (Figure 9-6). The research framework proposed by D’Oca et al. is grounded in SCT, the DNAS framework for energy-related behavior, and TPB.
Figure 9-6: Interdisciplinary research framework integrating the SCT, DNAS, and TBP The integrated framework has several strengths compared with each individual theory. These strengths combine in the selection of the most significant socio-technical components of energy-related behavior from each of the three frameworks, as well as in the synthesis of new variables reflecting the sociotechnical nature of building energy use behavior.
117
As an example, TPB ignores the need to perform certain tasks, but the DNAS framework has an explicit component to enhance these requirements. The DNAS framework explains energy-use behavior (the Actions having energy- and comfort-related effects on the control Systems) as a direct consequence of personal Needs, (i.e., thermal, visual, acoustic comfort) compelled by a set of motivational Drivers (e.g., temperature too hot, poor indoor air quality, lack of view from outside). However, data obtained through that linear approach are still based on somewhat physical components, which limit the degree to which social norms, group dynamics, or individual motivations can be covered. TPB provides explicit components to improve DNAS, i.e., how the need to perform some behavior is mediated by social dynamics in the workspace, such as the perceived social pressure from co-workers and employers on how one should behave, or how the intention to share control is shaped by personal beliefs, habits, or the perceived power over the control systems. SCT connects with the DNAS framework and TPB as the outermost layer, organizing the dynamic interplay of environmental, personal, and behavioral factors (motivational drivers) of energy-use behavior. This point is reflected in the new framework through the hypothesis that people adopt certain behaviors to accomplish basic biological needs. This is affirmed by the influences of personal cognitive factors from the social environment (i.e., attitudes, social norms, perceived behavioral control that is further explained using elements of TBP) or the physical environment (i.e., the actual access to the control systems as described in the specific element of the DNAS framework).
9.4.2. Design of interdisciplinary cross-country survey The research framework stands as the foundation for a survey instrument that aims to validate crosscountry data-driven knowledge on four key research questions associated with the key learning objectives: motivational drivers, group behavior, ease and knowledge of control, and satisfaction and productivity. An online survey including 37 questions was designed to collect data across four continents (America, Asia, Europe, Australia) and eight countries (Brazil, China, Italy, Hungary, Poland, Switzerland, Taiwan, United States). Every survey question was implemented using the Qualtrics software. The survey instrument, originally developed in English, was translated into local language using a Double Translation Process (DTP) protocol (McGorry 2000) to ensure equivalence across languages.
9.4.3. Results of the interdisciplinary cross-country survey: Italian case study The survey questionnaire was first validated in three university institutions located in Turin (Polito – Politecnico di Torino), Perugia (UniPg – University of Perugia), and Rende (UniCal - University of Calabria). The target group for the proposed survey was administrative staff, faculty members, and students who regularly occupy a working space. The Qualtrics survey link was sent to the sample group through the institutional e-mail lists of the three universities over a period of four weeks during the spring season (from April 5 to May 8, 2017). Reminders were sent to the participants at the end of each week. A total of 118
1160 valid responses were collected from the online questionnaire (Table 9-2). Despite incentives, the response rate was low (11–16%). Table 9-2. Response Rate Total Valid Total Sent Response Rate
PoliTo – Turin 502 4424 11%
UniPg – Perugia 405 2991 14%
UniCal – Rende 253 1598 16%
The respondents’ gender was almost equally distributed (50% male and 48% female, 2% NA). Most were full-time employees (with 31–40 hours workspace occupancy per week), who typically occupy shared or private offices (33%), shared open offices (30%), cubicle spaces (2%), or unspecified locations (35%). Significantly, single private offices were typically occupied by men (61%) from 40–61 years old, with fewer women (37%) or younger people of 18–28 years old (1%). The majority of the sample population holds a Ph.D. or post-laureate Master’s degree (41%), or a Master’s or equivalent 5-year degree (36%). Regarding the individuals’ motivational drivers towards interacting with shared building environmental controls, office workers mainly open windows for fresh air, while they typically close windows because the indoor temperature is perceived as too cold or too warm. Window blinds and shades are frequently pulled up or opened to let more daylight into the office space, and are mainly drawn to reduce the glare on computer screens or in the workspace. Thermostat set-points and lighting systems are generally regulated to restore comfort conditions in the workspace (because the temperature is perceived as too hot or too cold or to adjust the lighting level in the room) and less frequently as a consequence of energy conservation behavior. Regarding group dynamics (Figure 9-7), the intention to share controls does not appear to be correlated with perceived comfort, satisfaction, productivity, or knowledge of how to use technology, but rather as a behavioral trait of the occupant. Shared control of the indoor environment in the office space is generally perceived as a fair or good thing across all climate zones, highlighting a common positive attitude of office workers towards sharing control devices. Occupants in the Northern region (Turin) tend to report a stronger subjective norm on the co-workers’ expectation to share control over the Indoor Environmental Quality (IEQ). 35% 30% 25% 20% 15% 10% 5% 0%
Group discussion
Management/person By meeting the needs The first person who Everyone can operate with the highest rank of those who express speaks out decides the devices without pre-set discomfort talking to others
Figure 9-7: Workspace group norms across the three climatic zones: Northern-continental (black), Central-mild (red), and Southern-Mediterranean (gray)
119
45% 40% 35% Ease
30% 25% 20% 15% 10% 5% 0% Strongly disagree
Knowldge
thermostat settings
Somewhat disagree
Neutral
operable windows
Somewhat agree Strongly agree
artificial lighting
blinds or shades
50% 45% 40% 35% 30% 25% 20% 15% 10% 5% 0% Strongly disagree thermostat settings
Somewhat disagree
Neutral
operable windows
Somewhat agree Strongly agree
artificial lighting
blinds or shades
Figure 9-8: Frequency of perceived ease of sharing and knowledge of control averaged across the three case studies Regarding perceived behavioral control (Figure 9-8) of building technologies (ease of usage and knowledge), office workers tend to perceive greater ease in sharing the control of operable windows, lighting systems, and blinds/shades than toward thermostat settings. Similarly, respondents appear to be more acquainted with the usage of windows, blinds, shades, and artificial lighting than the regulation of thermostats in their workspace. Consequently, a general dissatisfaction emerges over the shared control of thermostat settings in office spaces (Figure 9-9).
120
Satisfaction of controls
30% 25% 20% 15% 10% 5% 0%
Thermostat My My is not workspace workspace accessible or is hotter is colder controlled than other than other by others areas areas
Air drafts
Windows Surfaces Windows Surfaces are too close (walls, are too far (walls, to me floors) from me floors) around me around me are too cold are too hot
Figure 9-9: Satisfaction of controls averaged across the three case studies Focusing on perceived comfort, satisfaction, and productivity (Figure 9-10), office workers tend to be more satisfied with the quality of natural and artificial lighting than with the indoor temperature and indoor air. Natural and artificial lighting seem to predominantly influence productivity, whereas variables such as indoor temperature and indoor air are more frequently perceived as responsible for the loss of productivity by office workers. Perceived comfort was correlated with satisfaction and productivity, and less so with the ease of usage and knowledge of control, as well as attitudes and subjective norms. 45% 40% Productivity
35% 30%
Indoor Temperature Indoor Air Artificial Lighting Natural Light
25% 20% 15% 10% 5% 0% Very negatively
Somewhat negatively
Neutral
Somewhat positively
Very positively
121
45% 40%
Satisfaction
35% 30%
Indoor Temperature Indoor Air Artificial Lighting Natural Light
25% 20% 15% 10% 5% 0% Very unsatisfied
Somewhat unsatisfied
Neutral
Somewhat satisfied
Very satisfied
Figure 9-10: Frequency of satisfaction and productivity averaged across the three Italian climate zones
9.5. Challenges faced by interdisciplinary studies of occupant behavior Despite the interdisciplinary research related to occupant behavior described above, there exist a number of challenges. These challenges can be grouped into general challenges of interdisciplinary research and specific challenges related to occupant behavior research. The former include the tendencies that interdisciplinary research is “harder to fund, do, review and publish” (Editors of Nature 2015). Without going into detail, the key factor in addressing these points is the openness and ability to redefine perspectives and paradigms, whether as the funding giver, researcher, reviewer, or publisher. A first and fundamental step is open communication, discussion, and sharing related to fundamental, but essential, aspects such as the definitions inherent in each discipline, e.g., when discussing a “model” and common objectives. The latter, i.e., challenges specific to occupant behavior research, include the integration of findings revealed by interdisciplinary research projects into occupant behavior models and simulation tools, and further into design and operation practices. The research conducted within the framework of Annex 66 includes findings that show the significance of, for example, personality traits—a psychological construct—on behavioral patterns (Schakib-Ekbatan et al. 2015, Schweiker and Wagner 2015, Schweiker et al. 2016); this is the first step towards a framework facilitating the integration of complex and interdisciplinary occupant behavior models into simulation tools by means of the obXML framework (Hong et al. 2015). However, a bigger challenge is to show the applicability and value of such findings and construct tools for the design and operation of future buildings and/or intervention studies. Although occupant behavior research has seen important advances in recent years, substantial challenges remain that call for further interdisciplinary research. A key research challenge among multidisciplinary
122
fields centers on the complexity of human behavior. With a lack of consolidated methods and platforms to test findings, research outcomes will remain of limited use.
9.6. Interdisciplinary studies conclusions and future work Human behavior is a critical dimension that is as important as technological factors in ensuring the energy-efficient design, construction, and operation of buildings. Occupant behavior research has the potential to solve some of the significant challenges surrounding single-discipline research through interdisciplinary collaborations amid social scientists, building designers, and engineers. Future occupant behavior research can utilize interdisciplinary studies as exemplified in the following areas: 1. Allow researchers to pay increased attention to occupants and their social contexts, and identify the specific social-psychological variables influencing the human–building interaction. These variables tend to vary with the target behavior, building type, and demographics. For example, energy-saving or pro-environmental behavior is typically guided by self-interest, meaning that if people care about themselves or their children’s future, they will care about environmental issues (Young et al. 2015). This creates the need for investigations focused on an extensive set of socialpsychological factors relating to occupant behavior. Therefore, integrating social science theories into occupant behavior has become important. As identified by Hong et al. (2015), when examining the full scale of human–building interactions, occupant behavior research must “focus on the individual, group, and collective behaviors.” For example, a study conducted by Chen and Knight (2014) found that both injunctive norms and perceived behavioral control had direct and positive effects on Chinese employees’ intention to conserve energy in the workspace. 2. Occupants have diverse personalities and backgrounds, making them heterogeneous. This point is critical in developing a representative sample that allows results to be generalized at the population level. To encompass the heterogeneity of occupants (i.e., location, gender, culture) and diverse environments (residential and commercial buildings), research requires extensive datasets from integrated sources such as community income maps and utility energy consumption. As the data expand, the choices and solutions surrounding energy-saving behavior also expand. However, gathering human subject data can be a challenging task because of privacy and data protection issues. Future research should account for this difficulty and employ multiple methods to increase the data variance, such as widespread surveys and interviews. 3. As occupants often share spaces, the limited attention on understanding and modeling group behavior in commercial buildings should be urgently addressed. The engineering and building design communities can be supported on this issue through social science theories evaluating the motivations and productivity of personal and group norms within a composite indoor environment. The implication of comfort and energy requirements through multi-adaptive behaviors continues to be difficult to clarify, however, by enhancing the design and operational phases of commercial buildings, as well as model predictive control algorithms through the integration of data-driven knowledge concerning human perception, habits, and behaviors, these issues can be addressed. Advanced methodologies for integrating self-reporting and simulated behavioral data are still required for further investigation and validation. 123
4. In contrast to the classical rational choice theory, intervention strategies (i.e., financial incentives and information) have only added complexity to occupant behavior and building efficiency (Parker et al. 2012). Therefore, it is important to clearly identify all underlying mechanisms and barriers to behavior. Specifically, it is necessary to evaluate all arbitrary variables that describe why certain behavioral analyses do not have advantages. Considering both socialpsychological variables and political orientation, for example, Xu et al. (2015) found that environmentally framed benefits induce more positive attitudes toward energy saving than economically framed benefits among those with moderate levels of environmental concern and among more politically liberal participants. This suggests that environmentally framed messages might stimulate positive responses within a subset of US energy consumers. In the contexts of both office and residential settings, therefore, researchers should consider striking a balance between occupant comfort and energy efficiency, while identifying the behavioral and psychological relationships underlying occupant energy-saving intentions. 5. Alongside a further inquiry into social and psychological influences on OB, more research on the architectural context in which occupant behavior is situated would be beneficial for a more holistic understanding. While research has focused predominantly on control patterns related to adaptive opportunities, the nature of these controls, the systems they are controlling, and the space they are servicing should also be considered and further investigated. 6. Interdisciplinary solutions have the potential to increase energy conservation and reduce energy consumption. As illustrated in Figure 9-11, many different specialists involved in the diverse elements of a building’s lifecycle must be included in the research, with expertise from the human, built, and digital environments. This covers building occupants, architects, building owners, operators, facility managers, HVAC engineers, software developers, researchers, and policy makers in the energy, social, and building science fields. These models are continually changing and improving as interdisciplinary research continues to refine our understanding of occupant behaviors and their interactions with a variety of buildings, appliances, control options, and other occupants. 7. The future of occupant behavior research calls for standardized practices that encompass an interdisciplinary approach to the diverse fields being investigated. This will ensure universally agreed information, knowledge, and insight into energy-related occupant behavior in buildings. Better understanding and representations of occupant behavior can improve the global energy performance of buildings. Better energy performance predictions would be beneficial for all stakeholders in a construction project, from business investors and building designers to building users and managers. Going forward, efforts to strengthen and update interdisciplinary and international relationships and networks will be continuously nurtured, both within Annex 66 research arena and the industry, through groups such as the ASHRAE Multidisciplinary Task Group (MTG) on Occupant Behavior in Buildings (OBB). The final goal is to drive better empirical findings towards the development of market actions and policies to support the global goal of energy saving and carbon reduction in the building sector.
124
Figure 9-11: Domains and disciplines relevant to occupant behavior research
125
10. Summary and Conclusions This chapter summarizes the key research findings, main outcomes, and potential topics for future research.
10.1. Key findings The major product of Annex 66 is a scientific methodological framework to guide occupant behavior simulation research on data collection, modeling and evaluation, modeling tools development and integration, applications, and interdisciplinary issues. Through collaborative research activities, Annex 66 community reached a consensus regarding occupant behavior research and identified some important issues that are worth thorough deliberation and further discussion. The following topics have been studied in Annex 66, and their significance identifies them as worthy of further study in future work. 1.
2.
Occupant behavior has significant impacts on energy use and occupant comfort in buildings, as demonstrated in the 32 case studies. Data, methods, and models are developed and applied to understand and reduce the gap between the simulated and measured building energy performance by representing occupant behavior in a standardized ontology and XML schema, developing an occupant behavior software module for co-simulation, and integrating these with building performance simulation programs. Data collection is fundamental for occupant behavior modeling. Methods of collecting data are evolving with the rapid development of sensors and Information and Communication Technologies. Most data collection campaigns are conducted in a typical working environment rather than a laboratory. With precise control of the indoor environment and good reproducibility, laboratories are becoming an alternative for the collection of occupant behavior data. However, the “Hawthorne Effect,” whereby subjects may alter their behavior when they are aware of being observed, may be an unfavorable factor for laboratory studies involving occupants. New sensors for detecting occupancy and occupants’ actions are being developed. For example, the occupancy in a space can be measured in various ways. The indirect approach uses the change in CO2 concentration to estimate the occupancy. Infrared or ultrasonic occupancy sensors try to detect the movement of occupants around a room, whereas wearable sensors and smartphones can locate occupants with a high resolution. Cameras are also being used to recognize occupancy patterns, producing data that could be analyzed with image recognition algorithms and offering a high computational capacity. New devices such as Microsoft’s Kinect are being used to automatically detect occupancy. The evolution of technology requires researchers to have a good understanding of the available data collection methods and apply them to the most appropriate situation. However, there are still uncertainties regarding the accuracy of image analysis and positioning using Wi-Fi signals, as well as the associated ethical considerations. The development of data collection techniques allows for the generation of large-scale datasets. For instance, applications on phones can identify occupants and their movements, and these data can reveal nationwide patterns of occupants’ habits. Data mining 126
3.
4.
5.
methods are being introduced to efficiently analyze and extract valuable knowledge from such large datasets. Choice of occupant behavior models in building simulation depends on the building context and application purposes. The modeling of occupant behavior often encompasses stochasticity to capture the spatial, temporal, and individual diversity. Nevertheless, related studies have suggested that stochastic models do not necessarily perform better than simplified deterministic models. The appropriate model should be determined based on the various application scenarios. Current occupant behavior models focus on the estimation of building energy consumption for a relatively long period, typically a year. The purpose of this type of model is to make the estimation as accurate as possible. In other situations, such as for model predictive control, however, the purpose of the model is to predict the specific parameters for an ensuing short-term period. Models that simulate energy consumption are not good candidates in this context, as they have little information with which to predict the near future based on available historical data. Another view of current occupant behavior models indicates that they are data-driven, implying that the models were built through regression based on data collected from the environment and occupancy or occupants’ actions, rather than by studying the occupant behavior mechanism from a physiological or psychological perspective. The development of thermal comfort research and its combination with sociological studies could shed some light on the description and modeling of occupant behavior on a mechanism-modeling basis. The combination of these studies allows for a new path for occupant behavior modeling. The evaluation of occupant behavior models, as revealed earlier, should take explicit metrics from the application scenario to quantify model performance. Specifically, the evaluation of stochastic models has roots in the statistical comparison between stochastic simulation results and deterministic measurement results (i.e., using bootstrap validation, cross-validation, or random sample validation). New approaches that adopt statistics techniques for the evaluation of model accuracy are under development. The integration of occupant behavior models with building performance simulation tools links academic research with industrial applications. The DNAS framework and the co-simulation architecture proposed in Annex 66 have made great progress in integrating multiple occupant behavior models with building performance simulation programs in a flexible and robust manner. Nevertheless, significant work remains in pursuit of easy-to-use interfaces in occupant behavior simulations for practical applications. An important issue is the representation of occupant behavior diversity. Behavior patterns differ among individuals, and this diversity is perplexing for researchers and engineers tasked with identifying the behavior patterns and corresponding parameters for simulations involving occupants. As a compromise between the diversity of actual occupant behavior and the simplicity of building simulations, some typical occupant traits have been proposed, i.e., reconciling clusters of behavioral patterns with data-driven inputs and predictive models. Efforts have been made by the Annex 66 community to address occupant behavior diversity with different approaches, such as case measurements and questionnaires. This open issue is of great significance in the application of occupant simulations and requires significant further investigation. The application of occupant behavior models veils the technical details of modeling and provides engineers with a friendly interface. A guidebook detailing the appropriate situations for each model would provide significant help to modelers, allowing them to avoid using models in 127
6.
scenarios completely different to those for which they were developed. Policy makers could benefit from occupant behavior modeling by observing the simulated energy reduction when behavior patterns are altered. This procedure facilitates the development of efficient policies for reducing energy consumption in buildings. The remaining unresolved issue is the modeling of occupant behavior evolution when certain incentives motivate energy-saving behavior. A similar question arises when occupants are transferred to a new environment and their behavior changes correspondingly. The sociological and psychological aspects of occupants should be studied under these circumstances to gain clear explanations of the alteration of occupant behavior according to different incentives. Interdisciplinary research across building science, building technologies, social science, behavioral science, data science and computer science is needed to deeply understand, represent, model and simulate human behavior in buildings, and quantify their impacts on building energy use, occupant comfort and health. Human behavior is a critical dimension that is as important as technological factors in ensuring the energy-efficient design, construction, and operation of buildings. Annex 66 established an interdisciplinary research framework and developed an interdisciplinary cross-country survey on occupant energy-related behavior in buildings, which provides valuable data on insights of occupant behavior and the basis of occupant behavior modeling and simulation.
10.2. Main outcomes The main outcomes from Annex 66 include (1) five technical reports, available as separate publications, (2) three occupant behavior modeling tools, and (3) 103 peer-reviewed journal articles (listed in Appendix A.5). The five technical reports are: 1. 2. 3. 4. 5.
Studying occupant behavior in buildings: methods and challenges, ISBN 978-0-9996964-0-8. An international survey of occupant behavior in workspaces, ISBN 978-0-9996964-3-9. Occupant behavior modeling approaches and evaluation, ISBN 978-0-9996964-1-5. Surveys to understand current needs, practice and capabilities of occupant modeling in building simulation, ISBN 978-0-9996964-2-2. Occupant behavior case study sourcebook, ISBN 978-0-9996964-4-6.
The three occupant behavior modeling tools are as follows: 1. obXML, an XML schema to standardize the representation and exchange of occupant behavior models for building performance simulation. obXML builds upon the DNAS ontology. A library of obXML files, representing typical energy-related occupant behavior in buildings, has been developed. These obXML files can be exchanged between different BPS programs, different applications, and different users.
128
2. obFMU, a modular software component in the form of functional mockup units enabling cosimulations with BPS programs using the standard functional mockup interface. obFMU reads occupant behavior models represented in obXML and functions as a solver. 3. Occupancy Simulator, a web-based application to simulate occupant presence and movement in buildings using stochastic models. This tool generates sub-hourly occupant schedules for each space and individual occupants in CSV files, which can be used for building performance simulations.
10.3. Future research Annex 66 identified and tackled several key research problems on occupant behavior definition, modeling and simulation, data collection, experimental design, surveys, and applications. However, occupant behavior is a complex and interdisciplinary research topic, and there remain many challenging and important topics for future research. For example: Definition of reliable and affordable ways to collect large-scale occupant behavior data Development and application of occupant behavior models o Representation of inter-occupant behavior diversity. o Consideration of interaction of multiple occupants. o Fit-for-purpose, i.e. considering model fidelity for specific application context. o Methods and datasets for model evaluation, verification, and validation. o Standard approaches to integrating occupant behavior models or tools with the existing building performance simulation programs. Applications o Guideline to integrate occupant behavior sensing, analytics, modeling, and simulation with the building lifecycle, including planning, design, construction, commissioning, operation, controls, and retrofit. o Guide technology development and evaluation, considering different scenarios of occupant behavior in the modeling, simulation, and evaluation of building technologies to understand the variation of performance, quantify risk of investment, and thus inform technology investment and adoption. o Guide energy policy making, e.g., codes and standards, considering occupant behavior in the evaluation and adoption of technology measures in building energy codes and standards, evaluating and providing credits to behavioral measures for energy saving. The concept proposal of a new annex, focusing on occupant behavior-based building design and operation, led by Andreas Wagner and William O’Brien, was approved by the IEA EBC in November 2017. This will continue the research and application of occupant behavior in buildings.
129
11. List of Authors Many participants contributed to the writing of the final report. Table 11-1 contains a complete list of authors for each chapter of the final report. Table 11-1: List of authors Chapter Executive Summary 1 2 3 4 5 6 7 8 9 10 11 12 13 Appendices A and B
Authors Tianzhen Hong, Da Yan Da Yan, Tianzhen Hong Da Yan, Tianzhen Hong Da Yan, Tianzhen Hong Andreas Wagner, Bing Dong, Liam O’Brien, Mikkel Baun Kjærgaard, Marilena De Simone, Burak Gunay, Dafni Mora, Jakub Dziedzic, Jie Zhao, Stephanie Gauthier, Julia Day, Chien-Fei Chen, Sara Gilani, Ardeshir Mahdavi, Mahnahmeh Taheri, Farhang Tahmasebi Sebastian Wolf, Rune Korsholm Andersen, Verena Barthelmes, Burak Gunay, Jan Kloppenborg Møller, Henrik Madsen, William O’Brien, Marcel Schweiker, Selin Yilmaz Ardeshir Mahdavi, Farhang Tahmasebi Tianzhen Hong, Andrew Cowie, Sumee Park, Da Yan, Kaiyu Sun, Andreas Lindner Clinton Andrews, Khee Poh Lam, Cary Chan, Astrid Roetzel, Isabella Gaetani, Peter Op’t Veld, Ad van der Aa, Pieter Jan Hoes, Ruidong Chang, Yujie Lu Chien-fei Chen, Simona D’Oca, Zsofia Deme Belafi, Tianzhen Hong, Astrid Roetzel, Julia Day, Marcel Schweiker, Vojislav Novakovic Tianzhen Hong, Da Yan Da Yan, Tianzhen Hong Da Yan, Tianzhen Hong Da Yan, Tianzhen Hong Da Yan, Tianzhen Hong
130
12. Publicity Annex 66 uses various channels to communicate the project research goal, methods, and outcomes among the project participants, as well as to reach out to related activities and stakeholders, including: (1) (2) (3) (4) (5)
One website, annex66.org Five newsletters 27 symposia, workshops, and seminars Four topical issues for three journals 103 journal articles on occupant behavior research and applications
Details are described in Appendix A.
131
13. References 1972. Declaration of the United Nations Conference on the Human Environment. 2011. Energy Use Data Handbook 1990 to 2011. 2017. gbXML.org. accessed September 3. Annex 66, IEA. 2014. http://www.annex66.org/. ABRAHAMSE, W. & STEG, L. 2009. How do socio-demographic and psychological factors relate to households’ direct and indirect energy use and savings? Journal of economic psychology, 30, 711-720. ABRAHAMSE, W. & STEG, L. 2011. Factors related to household energy use and intention to reduce it: The role of psychological and socio-demographic variables. Human Ecology Review, 30-40. AGARWAL, Y., BALAJI, B., DUTTA, S., GUPTA, R. K. & WENG, T. Duty-cycling buildings aggressively: The next frontier in HVAC control. Information Processing in Sensor Networks (IPSN), 2011 10th International Conference on, 2011. IEEE, 246-257. AHN, K.-U. & PARK, C.-S. 2016. Correlation between occupants and energy consumption. Energy and Buildings, 116, 420-433. AIA http://www.aia.org/aiaucmp/groups/secure/documents/pdf/aiap026834.pdf. AJZEN, I. 1991. The theory of planned behavior. Organizational behavior and human decision processes, 50, 179-211. ALLEN, D. & JANDA, K. The effects of household characteristics and energy use consciousness on the effectiveness of real-time energy use feedback: a pilot study. Proceedings of the ACEEE summer study on energy efficiency in buildings, 2006. 7-1. ALLISON, G. T. 1969. Conceptual models and the Cuban missile crisis. American political science review, 63, 689-718. ANDERSEN, P. D., IVERSEN, A., MADSEN, H. & RODE, C. 2014. Dynamic modeling of presence of occupants using inhomogeneous Markov chains. Energy and Buildings, 69, 213-223. ANDERSEN, R., FABI, V., TOFTUM, J., CORGNATI, S. P. & OLESEN, B. W. 2013. Window opening behavior modelled from measurements in Danish dwellings. Building and Environment, 69, 101-113. ANDERSEN, R. V., TOFTUM, J., ANDERSEN, K. K. & OLESEN, B. W. 2009. Survey of occupant behavior and control of indoor environment in Danish dwellings. Energy and Buildings, 41, 11-16. AUSTRALIA, A. http://www.architecture.com.au/docs/default-source/becoming-being-anarchitect/becoming-an-architect-brochure.pdf?sfvrsn=0. AXSEN, J. & KURANI, K. S. 2012. Social influence, consumer behavior, and low-carbon energy transitions. Annual Review of Environment and Resources, 37, 311-340. AZAR, E. & MENASSA, C. A conceptual framework to energy estimation in buildings using agent based modeling. Proceedings of the Winter Simulation Conference, 2010. Winter Simulation Conference, 31453156. BANDURA, A. 1986. Social foundation of thought and action: A social-cognitive view. Englewood Cliffs. BARTHELMES, V. M., HEO, Y., FABI, V. & CORGNATI, S. P. 2017. Exploration of the Bayesian Network framework for modelling window control behavior. Building and Environment, 126, 318-330. BECERIK-GERBER, B., JAZIZADEH, F., LI, N. & CALIS, G. 2011. Application areas and data requirements for BIM-enabled facilities management. Journal of construction engineering and management, 138, 431-442. BELAFI, Z., HONG, T. & REITH, A. 2016. A library of building occupant behavior models represented in a standardized schema. Proceedings of BEHAVE. BELAFI, Z., HONG, T. & REITH, A. 2017. A Critical Review on Questionnaire Surveys in the field of Energy-Related Occupant Behavior. Energy Efficiency (Under Review). BENNET, I. E. & O’BRIEN, W. 2017. Field study of thermal comfort and occupant satisfaction in Canadian condominiums. Architectural Science Review, 60, 27-39. BERC 2013. Building Energy Research Center. Annual Report on China Building Energy Efficiency. Tsinghua University. BERC 2016. China Building Energy Usage 2016. Tsinghua University. BNA. http://www.bna.nl/wp-content/uploads/2015/02/150224-Scope-of-Work-Germany-US-UK-c-BDACoFA_Flyer.pdf.
132
BOURDIEU, P. 1977. Outline of a Theory of Practice, Cambridge university press. BOURDIEU, P. 1990. The logic of practice, Stanford University Press. BRäUCHLER, B. & POSTILL, J. 2010. Theorising media and practice, Berghahn Books. BREEAM 2017. http://www.breeam.com/. November 8. BUTLER, J. 2011. Gender trouble: Feminism and the subversion of identity, routledge. CALì, D., ANDERSEN, R. K., MüLLER, D. & OLESEN, B. W. 2016. Analysis of occupants' behavior related to the use of windows in German households. Building and Environment, 103, 54-69. CAPASSO, A., GRATTIERI, W., LAMEDICA, R. & PRUDENZI, A. 1994. A bottom-up approach to residential load modeling. IEEE transactions on power systems, 9, 957-964. CHANG, W.-K. & HONG, T. Statistical analysis and modeling of occupancy patterns in open-plan offices using measured lighting-switch data. Building Simulation, 2013. Springer, 23-32. CHAPMAN, J., SIEBERS, P.-O. & ROBINSON, D. Coupling multi-agent stochastic simulation of occupants with building simulation. BSO14 building simulation and optimization, second IBPSA—England conference in association with CIBSE, UCL—University College London, London, 2014. 23-24. CHAPPELLS, H. & SHOVE, E. 2005. Debating the future of comfort: environmental sustainability, energy consumption and the indoor environment. Building Research & Information, 33, 32-40. CHEN, C.-F. & KNIGHT, K. 2014. Energy at work: Social psychological factors affecting energy conservation intentions within Chinese electric power companies. Energy Research & Social Science, 4, 23-31. CHEN, C.-F., XU, X. & DAY, J. K. 2017a. Thermal comfort or money saving? Exploring intentions to conserve energy among low-income households in the United States. Energy Research & Social Science, 26, 61-71. CHEN, Y., HONG, T. & LUO, X. An agent-based stochastic Occupancy Simulator. Building Simulation. Springer, 1-13. CHEN, Y., LIANG, X., HONG, T. & LUO, X. Simulation and visualization of energy-related occupant behavior in office buildings. Building Simulation, 2017b. Springer, 1-14. CHEN, Y., LUO, X. & HONG, T. 2016. An agent-based occupancy simulator for building performance simulation. CLEVENGER, C. M. & HAYMAKER, J. The impact of the building occupant on energy modeling simulations. Joint International Conference on Computing and Decision Making in Civil and Building Engineering, Montreal, Canada, 2006. Citeseer, 1-10.COHEN, R., RUYSSEVELT, P., STANDEVEN, M., BORDASS, W. & LEAMAN, A. 1999. Building intelligence in use: lessons from the Probe project. Usable Buildings, UK. CORGNATI, S. P., D’OCA, S., FABI, V. & ANDERSEN, R. K. Leverage of behavioural patterns of window opening and heating set point adjustments on energy consumption and thermal comfort in residential buildings. Proceedings of the 8th International Symposium on Heating, Ventilation and Air Conditioning, 2014. Springer, 23-31. COWIE, A., HONG, T., FENG, X. & DARAKDJIAN, Q. Usefulness of the obFMU Module Examined through a Review of Occupant Modelling Functionality in Building Performance Simulation Programs. CRAWLEY, D. B., HAND, J. W., KUMMERT, M. & GRIFFITH, B. T. 2008. Contrasting the capabilities of building energy performance simulation programs. Building and environment, 43, 661-673. CRESWELL, J. W. & CLARK, V. L. P. 2007. Designing and conducting mixed methods research. CUI, Y., YAN, D. & CHEN, C.-F. 2017. Exploring the factors and motivations influencing heating behavioral patterns and future energy use intentions in the hot summer and cold winter climate zone of China. Energy and Buildings, 153, 99-110. D'OCA, S. & HONG, T. 2014. A data-mining approach to discover patterns of window opening and closing behavior in offices. Building and Environment, 82, 726-739. D’OCA, S., CHEN, C.-F., HONG, T. & BELAFI, Z. 2017. Synthesizing building physics with social psychology: An interdisciplinary framework for context and occupant behavior in office buildings. Energy Research & Social Science, 34, 240-251. D’OCA, S., CORGNATI, S. & HONG, T. 2015. Data Mining of Occupant Behavior in Office Buildings. Energy Procedia, 78, 585-590. D’OCA, S., FABI, V., CORGNATI, S. P. & ANDERSEN, R. K. Effect of thermostat and window opening occupant behavior models on energy use in homes. Building Simulation, 2014. Springer, 683-694.
133
D’OCA, S. and HONG, T. 2015. Occupancy schedules learning process through a data mining framework. Energy and Buildings, 88, 395-408.D’OCA, S., HONG, T. & LANGEVIN, J. 2018. The human dimensions of energy use in buildings: A review. Renewable and Sustainable Energy Reviews, 81, 731-742. DAR, U. I., GEORGES, L., SARTORI, I. & NOVAKOVIC, V. Influence of occupant’s behavior on heating needs and energy system performance: A case of well-insulated detached houses in cold climates. Building Simulation, 2015. Springer, 499-513. DAY, J., THEODORSON, J. & VAN DEN WYMELENBERG, K. 2012. Understanding controls, behaviors and satisfaction in the daylit perimeter office: a daylight design case study. Journal of Interior Design, 37, 17-34. DAY, J. K. & GUNDERSON, D. E. 2015. Understanding high performance buildings: The link between occupant knowledge of passive design systems, corresponding behaviors, occupant comfort and environmental satisfaction. Building and Environment, 84, 114-124. DE DEAR, R. 2004. Thermal comfort in practice. Indoor air, 14, 32-39. DE DEAR, R. Thermal comfort in natural ventilation—a neurophysiological hypothesis. 2010 WINDSOR CONFERENCE: ADAPTING TO CHANGE: NEW THINKING ON COMFORT, 2010. DE LEEUW, E. D. & DILLMAN, D. A. 2008. International handbook of survey methodology, Taylor & Francis. DECLARATION, S. 1972. Declaration of the United Nations conference on the human environment. URL= http://www. unep. org/Documents. Multilingual/Default.asp. DEKAY, M. 2011. Integral sustainable design: transformative perspectives, Routledge. DEVINE-WRIGHT, P. 2002. A sociology of energy, buildings and the environment: constructing knowledge, designing practice. ACADEMIC PRESS LTD ELSEVIER SCIENCE LTD 24-28 OVAL RD, LONDON NW1 7DX, ENGLAND. DGNB, G. S. B. C. 2017. http://www.dgnb.de/en/. November 8. DONG, B., ANDREWS, B., LAM, K. P., HöYNCK, M., ZHANG, R., CHIOU, Y.-S. & BENITEZ, D. 2010. An information technology enabled sustainability test-bed (ITEST) for occupancy detection through an environmental sensing network. Energy and Buildings, 42, 1038-1046. DONG, B., DUAN, Y., LIU, R. & NISHIMOTO, T. The impact of occupancy behavior patterns on the energy consumption in low-income. CATEE Clean. Air Through Energy Effic. Conf. San. Antionio, Tex., 2013. DONG, B. & LAM, K. P. 2011. Building energy and comfort management through occupant behavior pattern detection based on a large-scale environmental sensor network. Journal of Building Performance Simulation, 4, 359-369. DUARTE, C., VAN DEN WYMELENBERG, K. & RIEGER, C. 2013. Revealing occupancy patterns in an office building through the use of occupancy sensor data. Energy and Buildings, 67, 587-595. EIA 2015. Residential Energy Consumption Survey. https://www.eia.gov/consumption/residential/data/2015/. EILERS, M., REED, J. & WORKS, T. 1996. Behavioral aspects of lighting and occupancy sensors in private offices: a case study of a university office building. ACEEE 1996 Summer Study on Energy Efficiency in Buildings. ENERGY, U. S. D. O. 2017. EnergyPlus.net. accessed September 3. ERICKSON, V. L., LIN, Y., KAMTHE, A., BRAHME, R., SURANA, A., CERPA, A. E., SOHN, M. D. & NARAYANAN, S. Energy efficient building environment control strategies using real-time occupancy measurements. Proceedings of the First ACM Workshop on Embedded Sensing Systems for EnergyEfficiency in Buildings, 2009. ACM, 19-24. FABI, V., ANDERSEN, R. K. & CORGNATI, S. 2015. Verification of stochastic behavioral models of occupants' interactions with windows in residential buildings. Building and Environment, 94, 371-383. FABI, V., ANDERSEN, R. V., CORGNATI, S. & OLESEN, B. W. 2012. Occupants' window opening behavior: A literature review of factors influencing occupant behavior and models. Building and Environment, 58, 188-198. FABI, V., MAGGIORA, V., CORGNATI, S. P. & ANDERSEN, R. K. Occupants' behavior in office building: stochastic models for window opening. 8th Windsor conference, 2014. FARLEY, K. & MAZUR-STOMMEN, S. Saving energy with neighborly behavior: Energy efficiency for multifamily renters and homebuyers. 2014. American Council for an Energy-Efficient Economy. FENG, X., YAN, D. & HONG, T. 2015. Simulation of occupancy in buildings. Energy and Buildings, 87, 348-359.
134
FENG, X., YAN, D. & WANG, C. 2017. On the simulation repetition and temporal discretization of stochastic occupant behavior models in building performance simulation. Journal of Building Performance Simulation, 10, 612-624. FENG, X., YAN, D., WANG, C. & SUN, H. 2016. A preliminary research on the derivation of typical occupant behavior based on large-scale questionnaire surveys. Energy and Buildings, 117, 332-340. FOGARTY, J., AU, C. & HUDSON, S. E. Sensing from the basement: a feasibility study of unobtrusive and low-cost home activity recognition. Proceedings of the 19th annual ACM symposium on User interface software and technology, 2006. ACM, 91-100. FOUNTAIN, M., BRAGER, G. & DE DEAR, R. 1996. Expectations of indoor climate control. Energy and Buildings, 24, 179-182. FRIEDMAN, J., HASTIE, T. & TIBSHIRANI, R. 2009. The elements of statistical learning (2nd Edition), Springer series in statistics New York. FRITSCH, R., KOHLER, A., NYGåRD-FERGUSON, M. & SCARTEZZINI, J.-L. 1990. A stochastic model of user behavior regarding ventilation. Building and Environment, 25, 173-181. FUGLEDE B, TOPSOE F. Jensen-Shannon divergence and Hilbert space embedding[C]//Information Theory, 2004. ISIT 2004. Proceedings. International Symposium on. IEEE, 2004: 31. GAETANI, I., HOES, P.-J. & HENSEN, J. L. 2016. Occupant behavior in building energy simulation: towards a fit-for-purpose modeling strategy. Energy and Buildings, 121, 188-204. GAETANI, I., HOES, P.-J. & HENSEN, J. L. 2017a. Introducing and testing a strategy for fit-for-purpose occupant behavior modeling in a simulation-aided building design process. Building Physics and Services. GAETANI, I., HOES, P.-J. & HENSEN, J. L. 2017b. On the sensitivity to different aspects of occupant behaviour for selecting the appropriate modelling complexity in building performance predictions. Journal of Building Performance Simulation, 10, 601-611. GARfiNKEL, H. Studies in Ethnomethodology. Cambridge: Polity Press. GIDDENS, A. 1979. Central problems in social theory: Action, structure, and contradiction in social analysis, Univ of California Press. GILANI, S. & O’BRIEN, W. 2017a. Modelling and simulation of lighting use patterns in office spaces. Building Simulation, San Francisco, CA. GILANI, S. & O’BRIEN, W. 2017b. Review of current methods, opportunities, and challenges for in-situ monitoring to support occupant modelling in office spaces. Journal of Building Performance Simulation, 10, 444-470. GILANI, S., O’BRIEN, W., GUNAY, H. B. & CARRIZO, J. S. 2016. Use of dynamic occupant behavior models in the building design and code compliance processes. Energy and Buildings, 117, 260-271. GODIN, B. 2017. Models of Innovation: History of an Idea. MIT Press, Cambridge, MA. GOTTWALT, S., KETTER, W., BLOCK, C., COLLINS, J. & WEINHARDT, C. 2011. Demand side management—A simulation of household behavior under variable prices. Energy policy, 39, 8163-8174. GRAHN, P., MUNKHAMMAR, J., WIDéN, J., ALVEHAG, K. & SöDER, L. 2013. PHEV home-charging model based on residential activity patterns. IEEE Transactions on power Systems, 28, 2507-2515. GRAM-HANSSEN, K. 2010. Residential heat comfort practices: understanding users. Building Research & Information, 38, 175-186. GRANDJEAN, A., ADNOT, J. & BINET, G. 2012. A review and an analysis of the residential electric load curve models. Renewable and Sustainable Energy Reviews, 16, 6539-6565. GREAVES, M., ZIBARRAS, L. D. & STRIDE, C. 2013. Using the theory of planned behavior to explore environmental behavioral intentions in the workplace. Journal of Environmental Psychology, 34, 109-120. GREENSTAR, G. B. C. A. 2017. http://new.gbca.org.au/green-star/. November 8. GUNAY, H. B., O'BRIEN, W. & BEAUSOLEIL-MORRISON, I. 2013. A critical review of observation studies, modeling, and simulation of adaptive occupant behaviors in offices. Building and Environment, 70, 31-47. GUNAY, H. B., O'BRIEN, W. & BEAUSOLEIL-MORRISON, I. 2016. Implementation and comparison of existing occupant behavior models in EnergyPlus. Journal of Building Performance Simulation, 9, 567-588. GUNAY, H. B., O'BRIEN, W., BEAUSOLEIL-MORRISON, I. & BURSILL, J. 2017. Development and implementation of a thermostat learning algorithm. Science and Technology for the Built Environment, 24, 43-56. GUNAY, H. B., O'BRIEN, W., BEAUSOLEIL-MORRISON, I. & PERNA, A. 2014. On the behavioral effects of residential electricity submetering in a heating season. Building and Environment, 81, 396-403. GUPTA, S. & MAHDAVI, A. 2016. Exploring performance query space. IBPSA-USA Journal, 1.
135
H, Y. 2013. Annex 53 Final Report: Total energy use in buildings, analysis and evaluation methods. IEA. HALDI, F. A probabilistic model to predict building occupants’ diversity towards their interactions with the building envelope. Proceedings of the international IBPSA conference, Chambery, France, 2013. 147. HALDI, F., CALì, D., ANDERSEN, R. K., WESSELING, M. & MüLLER, D. 2017. Modelling diversity in building occupant behavior: a novel statistical approach. Journal of Building Performance Simulation, 10, 527-544. HALDI, F. & ROBINSON, D. 2008. On the behavior and adaptation of office occupants. Building and environment, 43, 2163-2177. HALDI, F. & ROBINSON, D. A comprehensive stochastic model of blind usage: theory and validation. Proceedings of the Eleventh International IBPSA Conference, 2009a. 529-536. HALDI, F. & ROBINSON, D. 2009b. Interactions with window openings by office occupants. Building and Environment, 44, 2378-2395. HALDI, F. & ROBINSON, D. 2010. Adaptive actions on shading devices in response to local visual stimuli. Journal of Building Performance Simulation, 3, 135-153. HAND, J. 2011. Strategies for deploying virtual representations of the built environment. Glasgow: University of Strathclyde. HAWIGHORST, M., SCHWEIKER, M. & WAGNER, A. 2016. Thermo-specific self-efficacy (specSE) in relation to perceived comfort and control. Building and Environment, 102, 193-206. HITCHCOCK, G. 1993. An integrated framework for energy use and behavior in the domestic sector. Energy and Buildings, 20, 151-157. HOES, P., HENSEN, J., LOOMANS, M., DE VRIES, B. & BOURGEOIS, D. 2009. User behavior in whole building simulation. Energy and buildings, 41, 295-302. HOLMES, M. J. & HACKER, J. N. 2007. Climate change, thermal comfort and energy: Meeting the design challenges of the 21st century. Energy and Buildings, 39, 802-814. HONG, T., CHEN, Y., BELAFI, Z. & D’OCA, S. Occupant behavior models: A critical review of implementation and representation approaches in building performance simulation programs. Building Simulation, 2017a. Springer, 1-14. HONG, T., D'OCA, S., TAYLOR-LANGE, S. C., TURNER, W. J., CHEN, Y. & CORGNATI, S. P. 2015a. An ontology to represent energy-related occupant behavior in buildings. Part II: Implementation of the DNAS framework using an XML schema. Building and Environment, 94, 196-205. HONG, T., D'OCA, S., TURNER, W. J. & TAYLOR-LANGE, S. C. 2015b. An ontology to represent energyrelated occupant behavior in buildings. Part I: Introduction to the DNAs framework. Building and Environment, 92, 764-777. HONG, T., SUN, H., CHEN, Y., TAYLOR-LANGE, S. C. & YAN, D. 2016a. An occupant behavior modeling tool for co-simulation. Energy and Buildings, 117, 272-281. HONG, T., TAYLOR-LANGE, S. C., D’OCA, S., YAN, D. & CORGNATI, S. P. 2016b. Advances in research and applications of energy-related occupant behavior in buildings. Energy and Buildings, 116, 694-702. HONG, T., YAN, D., D'OCA, S. & CHEN, C.-F. 2017b. Ten questions concerning occupant behavior in buildings: the big picture. Building and Environment, 114, 518-530. HTTP://WWW.MACMILLANDICTIONARY.COM/DICTIONARY/BRITISH/FIT-FOR-PURPOSE. HU, S., YAN, D., GUO, S., CUI, Y. & DONG, B. 2017. A survey on energy consumption and energy usage behavior of households and residential building in urban China. Energy and Buildings, 148, 366-378. HULLEY, S. B., CUMMINGS, S. R., BROWNER, W. S., GRADY, D. G. & NEWMAN, T. B. 2013. Designing clinical research, Lippincott Williams & Wilkins. HUNT, D. 1979. The use of artificial lighting in relation to daylight levels and occupancy. Building and environment, 14, 21-33. HUNT, D. 1980. Predicting artificial lighting use-a method based upon observed patterns of behavior. Lighting Research & Technology, 12, 7-14. JAIN, R. K., GULBINAS, R., TAYLOR, J. E. & CULLIGAN, P. J. 2013. Can social influence drive energy savings? Detecting the impact of social influence on the energy consumption behavior of networked users exposed to normative eco-feedback. Energy and Buildings, 66, 119-127. JANDA, K. B. 2011. Buildings don't use energy: people do. Architectural science review, 54, 15-22. KAISER, F. G. & GUTSCHER, H. 2003. The proposition of a general version of the theory of planned behavior: Predicting ecological behavior. Journal of applied social psychology, 33, 586-603.
136
KARJALAINEN, S. 2009. Thermal comfort and use of thermostats in Finnish homes and offices. Building and Environment, 44, 1237-1245. KONIS, K. 2013. Evaluating daylighting effectiveness and occupant visual comfort in a side-lit open-plan office building in San Francisco, California. Building and Environment, 59, 662-677. KOWSARI, R. & ZERRIFFI, H. 2011. Three dimensional energy profile: A conceptual framework for assessing household energy use. Energy Policy, 39, 7505-7517. LABORATORY, L. B. N. 2016. Occupant Behavior Functional Mockup Unit (obFMU) Application Guide. Berkeley, CA, USA. LANGEVIN, J., WEN, J. & GURIAN, P. L. Including occupants in building performance simulation: integration of an agent-based occupant behavior algorithm with Energy Plus. ASHRAE/IBPSAUSA Building Simulation Conference. Atlanta, GA, 2014. LANGEVIN, J., WEN, J. & GURIAN, P. L. 2015. Simulating the human-building interaction: Development and validation of an agent-based model of office occupant behaviors. Building and Environment, 88, 27-45. LATOUR, B. 1987. Through Society. LATOUR, B. 1996. On actor-network theory: A few clarifications. Soziale welt, 369-381. LATOUR, B. 2007. Reassembling the social. Hampshire: Oxford University Press. LAW, J. & HASSARD, J. 1999. Actor network theory and after. LEAMAN, A. & BORDASS, B. 2000. Keeping occupants “satisfied.”. Energy and Environmental Management, 2, 23-27. LEED, U. G. B. C. 2017. https://www.usgbc.org/?CMSPageID=1970. November 8. LI, C., HONG, T. & YAN, D. 2014. An insight into actual energy use and its drivers in high-performance buildings. Applied energy, 131, 394-410. LI, D., MENASSA, C. C. & KARATAS, A. 2017. Energy use behaviors in buildings: Towards an integrated conceptual framework. Energy Research & Social Science, 23, 97-112. LI, Z., JIANG, Y. & WEI, Q. 2007. Survey on energy consumption of air conditioning in summer in a residential building in Beijing. Journal of heating ventilation and air conditioning, 37, 46-51. LIANG, X., HONG, T. & SHEN, G. Q. 2016. Improving the accuracy of energy baseline models for commercial buildings with occupancy data. Applied Energy, 179, 247-260. LIAO, C., LIN, Y. & BAROOAH, P. 2012. Agent-based and graphical modelling of building occupancy. Journal of Building Performance Simulation, 5, 5-25. LIISBERG, J., MøLLER, J. K., BLOEM, H., CIPRIANO, J., MOR, G. & MADSEN, H. 2016. Hidden Markov Models for indirect classification of occupant behavior. Sustainable Cities and Society, 27, 83-98. LINDNER, A. J., PARK, S. & MITTERHOFER, M. Determination of requirements on occupant behavior models for the use in building performance simulations. Building Simulation, 2017. Springer, 861-874. LUO, X., LAM, K. P., CHEN, Y. & HONG, T. 2017. Performance evaluation of an agent-based occupancy simulation model. Building and Environment, 115, 42-53. MADSEN, H. 2007. Time series analysis, CRC Press. MADSEN, H. & THYREGOD, P. 2010. Introduction to general and generalized linear models, CRC Press. MAHDAVI, A. 2011. The human dimension of building performance simulation. Proceedings of Building Simulation 2011, K16-K33. MAHDAVI, A. 2015. Common fallacies in representation of occupants in building performance simulation. Proceedings of Building Simulation Applications, 1-7. MAHDAVI, A., DEL BOLGIA, M. & TAHMASEBI, F. Understanding the user-driven natural ventilation in Buildings: Can we benefit from the operationalisation of high-level human-ecological concepts? MAHDAVI, A., LAMBEVA, L., MOHAMMADI, A., KABIR, E. & PRöGLHöF, C. 2007. Two case studies on user interactions with buildings' environmental systems. Bauphysik, 29, 72-75. MAHDAVI, A., MOHAMMADI, A., KABIR, E. & LAMBEVA, L. 2008. Occupants' operation of lighting and shading systems in office buildings. Journal of building performance simulation, 1, 57-65. MAHDAVI, A. & TAHMASEBI, F. 2015a. The inter-individual variance of the defining markers of occupancy patterns in office buildings: A case study. Proceedings of BS2015, 2243-2247. MAHDAVI, A. & TAHMASEBI, F. 2015b. Predicting people's presence in buildings: An empirically based model performance analysis. Energy and Buildings, 86, 349-355. MAHDAVI, A. & TAHMASEBI, F. 2016. The deployment-dependence of occupancy-related models in building performance simulation. Energy and Buildings, 117, 313-320. MAHDAVI, A. & TAHMASEBI, F. 2016. On the quality evaluation of behavioral models for building performance applications. Journal of Building Performance Simulation.
137
MAHDAVI, A., TAHMASEBI, F. & KAYALAR, M. 2016. Prediction of plug loads in office buildings: Simplified and probabilistic methods. Energy and Buildings, 129, 322-329. MCCAMBRIDGE, J., KYPRI, K. & ELBOURNE, D. 2014. Research participation effects: a skeleton in the methodological cupboard. Journal of clinical epidemiology, 67, 845-849. MCCAMBRIDGE J, Witton J, Elbourne D R. Systematic review of the Hawthorne effect: new concepts are needed to study research participation effects. Journal of clinical epidemiology, 2014, 67(3): 267-277. MCGORRY, S. Y. 2000. Measurement in a cross-cultural environment: survey translation issues. Qualitative Market Research: An International Journal, 3, 74-81. MCLAUGHLIN, S., MCDANIEL, P. & AIELLO, W. Protecting consumer privacy from electric load monitoring. Proceedings of the 18th ACM conference on Computer and communications security, 2011. ACM, 87-98. MEERBEEK, B., TE KULVE, M., GRITTI, T., AARTS, M., VAN LOENEN, E. & AARTS, E. 2014. Building automation and perceived control: A field study on motorized exterior blinds in Dutch offices. Building and Environment, 79, 66-77. NATURE, E. O. 2015. Why interdisciplinary research matters. Nature, 525(7569), 305-305. NEWSHAM, G. 1994. Manual control of window blinds and electric lighting: implications for comfort and energy consumption. Indoor Environment, 3, 135-144. NEWSHAM, G., MAHDAVI, A. & BEAUSOLEIL-MORRISON, I. Lightswitch: a stochastic model for predicting office lighting energy consumption. Proceedings of right light three, the third European conference on energy efficient lighting, Newcastle-upon-Tyne, 1995. 60-66. NEWTREND, P. 2017. Manual describing the conduct of the developed collaborative design system. Deliverable 2.7 - D2.7. NICOL, J. F. Characterising occupant behavior in buildings: towards a stochastic model of occupant use of windows, lights, blinds, heaters and fans. Proceedings of the seventh international IBPSA conference, Rio, 2001. 1073-1078. O'BRIEN, W. & GUNAY, H. B. 2014. The contextual factors contributing to occupants' adaptive comfort behaviors in offices–A review and proposed modeling framework. Building and Environment, 77, 77-87. O'BRIEN, W. & GUNAY, H. B. 2016. Implementation of the Occupant Behavior and Presence Models in OpenStudio. Final Report to Natural Resources Canada, Carleton University. O'BRIEN, W., KAPSIS, K. & ATHIENITIS, A. K. 2013. Manually-operated window shade patterns in office buildings: A critical review. Building and Environment, 60, 319-338. O’BRIEN, W., GAETANI, I., GILANI, S., CARLUCCI, S., HOES, P.-J. & HENSEN, J. 2017a. International survey on current occupant modelling approaches in building performance simulation. Journal of Building Performance Simulation, 10, 653-671. O’BRIEN, W., GUNAY, H. B., TAHMASEBI, F. & MAHDAVI, A. 2017b. A preliminary study of representing the inter-occupant diversity in occupant modelling. Journal of Building Performance Simulation, 10, 509-526. OLECKNO, W. A. 2002. Essential epidemiology: principles and applications, Waveland. PAATERO, J. V. & LUND, P. D. 2006. A model for generating household electricity load profiles. International journal of energy research, 30, 273-290. PAEVERE, P., HIGGINS, A., REN, Z., HORN, M., GROZEV, G. & MCNAMARA, C. 2014. Spatiotemporal modelling of electric vehicle charging demand and impacts on peak household electrical load. Sustainability science, 9, 61-76. PAGE, J. 2007. Simulating occupant presence and behavior in buildings. PAGE, J., ROBINSON, D., MOREL, N. & SCARTEZZINI, J.-L. 2008. A generalised stochastic model for the simulation of occupant presence. Energy and buildings, 40, 83-98. PAN, S., WANG, X., WEI, Y., ZHANG, X., GAL, C., REN, G., YAN, D., SHI, Y., WU, J. & XIA, L. Cluster analysis for occupant-behavior based electricity load patterns in buildings: A case study in Shanghai residences. Building Simulation, 2017. Springer, 889-898. PARKER, D., MILLS, E., RAINER, L., BOURASSA, N. & HOMAN, G. 2012. Accuracy of the home energy saver energy calculation methodology. Proceedings of the 2012 ACEEE Summer Study on Energy Efficiency in Buildings. PARYS, W., SAELENS, D. & HENS, H. 2011. Coupling of dynamic building simulation with stochastic modelling of occupant behavior in offices–a review-based integrated methodology. Journal of Building Performance Simulation, 4, 339-358.
138
PEFFER, T., PRITONI, M., MEIER, A., ARAGON, C. & PERRY, D. 2011. How people use thermostats in homes: A review. Building and Environment, 46, 2529-2541. PENG, C., YAN, D., WU, R., WANG, C., ZHOU, X. & JIANG, Y. Quantitative description and simulation of human behavior in residential buildings. Building simulation, 2012. Springer, 85-94. PISELLO, A. L. & ASDRUBALI, F. 2014. Human-based energy retrofits in residential buildings: A costeffective alternative to traditional physical strategies. Applied Energy, 133, 224-235. PISELLO, A. L., CASTALDO, V.L., PISELLI, C., FABIANI, C., & COTANA, F. 2016. How peers’ personal attitudes affect indoor microclimate and energy need in an institutional building: Results from a continuous monitoring campaign in summer and winter conditions. Energy and Buildings, 126, 485-497. POLINDER, HENK, SCHWEIKER, M., AA, A. V. D., SCHAKIB-EKBATAN, K., FABI, V., ANDERSEN, R. & MORISHITA, N. 2013. Final Report Annex 53 - Occupant Behavior and Modeling (Separate Document Volume II). PRENTOW, T., RUIZ-RUIZ, A., BLUNCK H., STISEN A., KJÆRGAARD M. 2015 Spatio-temporal facility utilization analysis from exhaustive wifi monitoring. Elsevier. Pervasive and Mobile Computing 16, 305316 REA, M. S. 1984. Window blind occlusion: a pilot study. Building and Environment, 19, 133-137. RECKWITZ, A. 2002. Toward a theory of social practices: a development in culturalist theorizing. European journal of social theory, 5, 243-263. REINHART, C. F. 2004. Lightswitch-2002: a model for manual and automated control of electric lighting and blinds. Solar energy, 77, 15-28. REINHART, C. F. & VOSS, K. 2003. Monitoring manual control of electric lighting and blinds. Lighting research & technology, 35, 243-258. REN, X., Yan, D., Hong, T. 2015. Data Mining of Space Heating System Performance in Affordable Housing. Building and Environment. REN, X., YAN, D. & WANG, C. 2014. Air-conditioning usage conditional probability model for residential buildings. Building and Environment, 81, 172-182. RIBA. https://www.architecture.com/Files/RIBAProfessionalServices/Practice/RIBAPlanofWork2013Overview.p df. RICHARDSON, I., THOMSON, M. & INFIELD, D. 2008. A high-resolution domestic building occupancy model for energy demand simulations. Energy and buildings, 40, 1560-1566. RICHARDSON, I., THOMSON, M., INFIELD, D. & CLIFFORD, C. 2010. Domestic electricity use: A highresolution energy demand model. Energy and buildings, 42, 1878-1887. RIJAL, H. B., TUOHY, P., HUMPHREYS, M. A., NICOL, J. F., SAMUEL, A. & CLARKE, J. 2007. Using results from field surveys to predict the effect of open windows on thermal comfort and energy use in buildings. Energy and buildings, 39, 823-836. RIJAL, H. B., TUOHY, P., NICOL, F., HUMPHREYS, M. A., SAMUEL, A. & CLARKE, J. 2008. Development of an adaptive window-opening algorithm to predict the thermal comfort, energy use and overheating in buildings. Journal of Building Performance Simulation, 1, 17-30. ROETZEL & CHEN 2016a. Understanding architectural and social-psychological influences. ROETZEL, A. Occupant behavior simulation for cellular offices in early design stages—Architectural and modelling considerations. Building Simulation, 2015. Springer, 211-224. ROETZEL, A. & CHEN, C.-F. Understanding architectural and social-psychological influences on occupant behavior in commercial buildings. ASA 2016: Revisiting the role of architectural science in design and practice: Proceedings of the 50th International Conference of the Architectural Science Association, 2016b. University of Adelaide, 567-576. ROETZEL, A., TSANGRASSOULIS, A., DIETRICH, U. & BUSCHING, S. Occupant’s comfort expectations-a thermal lifestyle? PALENC 2010: Proceedings of the 3rd Passive & Low Energy Cooling for the Built Environment conference 2010, 2010. PALENC. RUFF, L. E. 1972. The Limits to Growth: A Report of the Club of Rome's Project on the Predicament of Mankind. JSTOR. RYGHAUG, M. & TOFTAKER, M. 2014. A transformative practice? Meaning, competence, and material aspects of driving electric cars in Norway. Nature and Culture, 9, 146-163. SAMUELSON, H. W., GHORAYSHI, A. & REINHART, C. F. 2016. Analysis of a simplified calibration procedure for 18 design-phase building energy models. Journal of Building Performance Simulation, 9, 1729.
139
SANGOGBOYE, F. C. & KJæRGAARD, M. B. 2018. PROMT: predicting occupancy presence in multiple resolution with time-shift agnostic classification. Computer Science-Research and Development, 33, 105115. SCHAKIB-EKBATAN, K., CAKıCı, F. Z., SCHWEIKER, M. & WAGNER, A. 2015. Does the occupant behavior match the energy concept of the building?–Analysis of a German naturally ventilated office building. Building and Environment, 84, 142-150. SCHWEIKER, M., HALDI, F., SHUKUYA, M. & ROBINSON, D. 2012. Verification of stochastic models of window opening behavior for residential buildings. Journal of Building Performance Simulation, 5, 55-74. SCHWEIKER, M., HAWIGHORST, M. & WAGNER, A. 2016. The influence of personality traits on occupant behavioral patterns. Energy and Buildings, 131, 63-75. SCHWEIKER, M. & WAGNER, A. 2016a. The effect of occupancy on perceived control, neutral temperature, and behavioral patterns. Energy and Buildings, 117, 246-259. SCHWEIKER, M. & WAGNER, A. Exploring potentials and limitations of the adaptive thermal heat balance framework. Proceedings of 9th Windsor Conference: Making Comfort Relevant Cumberland Lodge, Windsor, UK, 2016b. SEL, T. & CSTB, T. 2004. Multizone Building modeling with Type56 and TRNBuild. TRNSYS. SHELLER, M. & URRY, J. 2016. Mobilizing the new mobilities paradigm. Applied Mobilities, 1, 10-25. SHIPWORTH, D., HUEBNER, G., SCHWEIKER, M. & KINGMA, B. Diversity in Thermal Sensation: drivers of variance and methodological artefacts. Proceedings of 9th Windsor conference: Making comfort relevant, 2016. Network for Comfort and Energy Use in Buildings (NCEUB), 56-72. SHOVE, E. & WALKER, G. 2014. What is energy for? Social practice and energy demand. Theory, Culture & Society, 31, 41-58. SILVA, A. S. & GHISI, E. 2014. Uncertainty analysis of user behavior and physical parameters in residential building performance simulation. Energy and Buildings, 76, 381-391. SIMULATION, A. E. 2017. Highlights in version 4.6. http://www.equa.se/en/ida-ice/, accessed September 3. SOCOLOW R H. The Twin Rivers program on energy conservation in housing: Highlights and conclusions. Energy and Buildings, 1978, 1(3): 207-242. SOVACOOL, B. K. 2017. Experts, theories, and electric mobility transitions: Toward an integrated conceptual framework for the adoption of electric vehicles. Energy Research & Social Science, 27, 78-95. STEPHENSON, J. 2017. What does energy mean? An interdisciplinary conversation. Energy Research & Social Science, 26, 103-106. STOKES, M., RYLATT, M. & LOMAS, K. 2004. A simple model of domestic lighting demand. Energy and Buildings, 36, 103-116. SUN, K. & HONG, T. 2017a. A framework for quantifying the impact of occupant behavior on energy savings of energy conservation measures. Energy and Buildings, 146, 383-396. SUN, K. & HONG, T. 2017b. A simulation approach to estimate energy savings potential of occupant behavior measures. Energy and Buildings, 136, 43-62. SWAN, L. G. & UGURSAL, V. I. 2009. Modeling of end-use energy consumption in the residential sector: A review of modeling techniques. Renewable and sustainable energy reviews, 13, 1819-1835. TAHMASEBI, F. & MAHDAVI, A. 2012. Optimization-based simulation model calibration using sensitivity analysis. Simulace Budov a Techniky Prostredi, O. Sikula, J. Hirs (ed.). TAHMASEBI, F. & MAHDAVI, A. 2016. An inquiry into the reliability of window operation models in building performance simulation. Building and Environment, 105, 343-357. TAHMASEBI, F. & MAHDAVI, A. 2017. The sensitivity of building performance simulation results to the choice of occupants’ presence models: a case study. Journal of Building Performance Simulation, 10, 625635. TAHMASEBI, F., MOSTOFI, S. & MAHDAVI, A. 2015. Exploring the implications of different occupancy modelling approaches for building performance simulation results. Energy Procedia, 78, 567-572. TANIMOTO, J. & HAGISHIMA, A. 2010. Total utility demand prediction system for dwellings based on stochastic processes of actual inhabitants. Journal of Building Performance Simulation, 3, 155-167. TANIMOTO, J., HAGISHIMA, A. & SAGARA, H. 2008. A methodology for peak energy requirement considering actual variation of occupants’ behavior schedules. Building and Environment, 43, 610-619. USEIA 2014. Energy Information Administration, International Energy Outlook, Buildings sector energy consumption, Analysis of world buildings sector delivered energy consumption 2010 to 2040. www.eia.gov. VINE, E. L. 1986. Saving energy the easy way: An analysis of thermostat management. Energy, 11, 811-820.
140
VON GRABE, J. 2016a. How do occupants decide their interactions with the building? From qualitative data to a psychological framework of human-building-interaction. Energy Research & Social Science, 14, 4660. VON GRABE, J. 2016b. The systematic identification and organization of the context of energy-relevant human interaction with buildings—a pilot study in Germany. Energy Research & Social Science, 12, 7595. Wagner, A., O’Brien, W. and Dong, B. eds., 2017. Exploring Occupant Behavior in Buildings: Methods and Challenges. Springer. WAGNER, A., SCHAKIB-EKBATAN, K. & SCHWEIZER-RIES, P. 2012. The Influence of Building Energy Performance Standards on User Satisfaction in Office Buildings in Germany. WANG, C., YAN, D. & JIANG, Y. A novel approach for building occupancy simulation. Building simulation, 2011. Springer, 149-167. WANG, C., YAN, D. & REN, X. 2016a. Modeling Individual's Light Switching Behavior to Understand Lighting Energy Use of Office Building. Energy Procedia, 88, 781-787. WANG, C., YAN, D., SUN, H. & JIANG, Y. 2016b. A generalized probabilistic formula relating occupant behavior to environmental conditions. Building and Environment, 95, 53-62. WANG, D., FEDERSPIEL, C. C. & RUBINSTEIN, F. 2005. Modeling occupancy in single person offices. Energy and buildings, 37, 121-126. WIDéN, J., NILSSON, A. M. & WäCKELGåRD, E. 2009. A combined Markov-chain and bottom-up approach to modelling of domestic lighting demand. Energy and Buildings, 41, 1001-1012. WIDéN, J. & WäCKELGåRD, E. 2010. A high-resolution stochastic model of domestic activity patterns and electricity demand. Applied Energy, 87, 1880-1892. WILBER, K. 2001. A theory of everything: An integral vision for business, politics, science and spirituality, Shambhala publications. WILKE, U., HALDI, F., SCARTEZZINI, J.-L. & ROBINSON, D. 2013. A bottom-up stochastic model to predict building occupants' time-dependent activities. Building and Environment, 60, 254-264. WOLF, S., WöLKI, D., ROBINSON, D. & TREECK, C. V. 2017. Evaluation and re-training of two window opening models using an independent dataset. Healthy Buildings Europe Conference 2017, Lublin, Poland. WOLSKE, K. S., STERN, P. C. & DIETZ, T. 2017. Explaining interest in adopting residential solar photovoltaic systems in the United States: Toward an integration of behavioral theories. Energy Research & Social Science, 25, 134-151. WYON, D. P. Enhancing productivity while reducing energy use in buildings. Proceedings of the E-Vision 2000 Conference, 2000. 11-13. XU, X., ARPAN, L. M. & CHEN, C.-F. 2015. The moderating role of individual differences in responses to benefit and temporal framing of messages promoting residential energy saving. Journal of Environmental Psychology, 44, 95-108. XU, X., MAKI, A., CHEN, C.-F., DONG, B. & DAY, J. K. 2017. Investigating willingness to save energy and communication about energy use in the American workplace with the attitude-behavior-context model. Energy Research & Social Science. YAMAGUCHI, Y., FUJIMOTO, T. & SHIMODA, Y. 2011. Occupant behavior model for households to estimate high-temporal resolution residential electricity demand profile. Proceedings of BS2011, 15481555. YAMAGUCHI, Y., SHIMODA, Y. & MIZUNO, M. Development of district energy system simulation model based on detailed energy demand model. Proceeding of Eighth International IBPSA Conference, 2003. 1443-1450. YAMAGUCHI, Y., TANAKA, M. & SHIMODA, Y. Comparison of occupant behavior models applied to a household. The 1st Asia Conference on International Building (ASIM’12), 2012. YAN, D., HONG, T., DONG, B., MAHDAVI, A., D’OCA, S., GAETANI, I. & FENG, X. 2017. IEA EBC Annex 66: Definition and simulation of occupant behavior in buildings. Energy and Buildings, 156, 258270. YAN, D., JIANG, Y. & SHI, X. 2016. Influence of asynchronous demand behavior on overcooling in multiple zone AC systems. Building and Environment, 110, 65-75. YAN, D., O’BRIEN, W., HONG, T., FENG, X., GUNAY, H. B., TAHMASEBI, F. & MAHDAVI, A. 2015. Occupant behavior modeling for building performance simulation: Current state and future challenges. Energy and Buildings, 107, 264-278.
141
YAN, D., XIA, J., TANG, W., SONG, F., ZHANG, X. & JIANG, Y. DeST—An integrated building simulation toolkit Part I: Fundamentals. Building Simulation, 2008. Springer, 95-110. YILMAZ, S., FIRTH, S. K. & ALLINSON, D. 2017. Occupant behavior modelling in domestic buildings: the case of household electrical appliances. Journal of Building Performance Simulation, 1-19. YOUNG, W., DAVIS, M., MCNEILL, I. M., MALHOTRA, B., RUSSELL, S., UNSWORTH, K. & CLEGG, C. W. 2015. Changing behavior: successful environmental programmes in the workplace. Business Strategy and the Environment, 24, 689-703. YUN, G. Y. & STEEMERS, K. 2008. Time-dependent occupant behavior models of window control in summer. Building and Environment, 43, 1471-1482. ZEIGLER, B. P. & OREN, T. I. 1979. Theory of modelling and simulation. IEEE Transactions on Systems, Man, and Cybernetics, 9, 69-69. ZHOU, X. 2013. Final-Term Report: Development of a Standard Building Model for Energy Consumption Simulation. Tsinghua University. ZHOU, X., HONG, T. & YAN, D. Comparison of HVAC system modeling in EnergyPlus, DeST and DOE2.1 E. Building Simulation, 2014. Springer Berlin Heidelberg, 21-33. ZHOU, X., YAN, D., FENG, X., DENG, G., JIAN, Y. & JIANG, Y. Influence of household air-conditioning use modes on the energy performance of residential district cooling systems. Building Simulation, 2016. Springer, 429-441. ZHOU, X., YAN, D., HONG, T. & REN, X. 2015. Data analysis and stochastic modeling of lighting energy use in large office buildings in China. Energy and Buildings, 86, 275-287. ZHU, D., HONG, T., YAN, D. & WANG, C. A detailed loads comparison of three building energy modeling programs: EnergyPlus, DeST and DOE-2.1 E. Building Simulation, 2013. Springer, 323-335. ZHU, P., GILBRIDE, M., YAN, D., SUN, H. & MEEK, C. Lighting energy consumption in ultra-low energy buildings: Using a simulation and measurement methodology to model occupant behavior and lighting controls. Building Simulation, 2017. Springer, 799-810. ZUCCHINI, W., MACDONALD, I. L. & LANGROCK, R. 2016. Hidden Markov models for time series: an introduction using R, CRC press. ZUO, J., DANIEL, L. & SOEBARTO, V. 2016. Revisiting the role of architectural science in design & practice: 50th International Conference of the Architectural Science Association, 7-9 December 2016, Adelaide, Australia: proceedings.
142
Appendices Appendix A: Publicity A.1 Newsletters Five newsletters (Figure A-1) that were produced for Annex 66 are available at Annex 66 website. Each newsletter describes Annex 66 progress, highlights achievements, and summarizes meetings held during those periods of the project. Some newsletters were translated into German and French.
Figure A-1: Five newsletters of Annex 66
143
A.2 Website A website, https://annex66.org/, was created for Annex 66 to serve as a key communication and information portal for Annex 66 participants and interested parties. The website contains information about the project, subtasks, meeting announcements, list of participants, list of publications, a database of occupant behavior literature, events, and news. The website is regularly maintained and updated. The participants list is divided into active contributors and interested parties, and is updated weekly as requested. The publications and events pages are updated quarterly. The news page has related events and announcements. The next meeting page is updated with information about forthcoming Experts meetings. The website also contains a database of occupant behavior literature, which is updated once a year. Annex 66 participants can sign into the member page to download Experts meeting materials and slides.
A.3 List of symposia, workshops, and seminars Twenty-seven symposia, workshops, and seminars on occupant behavior were organized by Annex 66 participants. Table A-1 contains a complete list; the demographics are shown in Figure A-2. Table A-1: List of 27 symposia, workshops, and seminars No. 1 2 3 4 5 6 7 8 9 10
11 12 13 14
Name Seminar at ASHRAE Conference Workshop on human behavior Forum on occupant behavior simulation, ASIM conference Seminar at ASHRAE Conference Workshop on understanding Comfort, Attitudes and Behaviors CLIMA 2016 International Building Physics Conference Seminar at ASHRAE Conference ISHVAC-COBEE ACEEE Summer Study on Energy Efficiency in Buildings International Symposium on Sustainable Human-Building Ecosystems Cold Climate Conference International Conference on Industrial Ventilation Seminar at ASHRAE
Year
Month
Date
City
Country
2014
6
30
Seattle
USA
2014
8
28
Berkeley
USA
2014
11
28
Nagoya
Japan
2015
1
24-28
Chicago
USA
2015
4
7-10
Windsor
UK
2015
5
22-25
Aalborg
Denmark
2015
6
14-17
Torino
Italy
2015
6
27-30
Atlanta
USA
2015
7
14
Tianjin
China
2015
8
17-22
Pacific Grove
USA
2015
10
5-6
CMU
USA
2015
10
20-23
Dalian
China
2015
10
26-28
Shanghai
China
2016
1
27
Orlando
USA
144
Conference 15 16 17 18 19 20 21 22 23 24 25 26 27
Occupant Behavior Modeling Tools Webinar BEHAVE 2016 ASHRAE Building Performance Simulation Conference ASIM 2016 (IBPSA-Asia Conference) Seminar at ASHRAE Conference Cold Climate HVAC 2018 Symposium on Occupant Behavior and Adaptive Thermal Comfort Modeling and Simulation of Building Occupants World Sustainable Built Environment Conference Seminar at ASHRAE Conference IBPSA Building Simulation Conference The second International Symposium on Sustainable Human-Building Ecosystems ISHVAC International Symposium on HVAC
2016
3
15
Berkeley
USA
2016
9
8-9
Coimbra
Portugal
2016
9
27-29
Atlanta
USA
2016
11
27-29
Jeju Island
South Korea
2017
1
31
Las Vegas
USA
2017
3
12-15
Kiruna
Sweden
2017
5
17
Lyngby
Denmark
2017
5
1
Ottawa
Canada
2017
6
5-7
Hong Kong
China
2017
6
25
Long Beach
USA
2017
8
7-9
San Francisco
USA
2017
9
28-30
Beijing
China
2017
10
19-22
Jinan
China
Figure A-2: Cities where Annex 66 symposia, workshops, and seminars have been held
145
A.4 List of topical journal issues Four topical issues (Table A-2) were organized by subtask leaders of Annex 66, publishing 64 articles on occupant behavior research and applications, mostly contributed by participants of Annex 66. Table A-2: Four topical issues No.
Journal
1
Energy and Buildings
2
Energy and Buildings
Topic Advances in building energy modeling and simulation Occupancy behavior in buildings: modeling, simulation, and application
3
Building Performance Simulation
Fundamentals of occupant behavior research
4
Building Simulation
Applications of occupant behavior modeling
Guest Editor
Number of articles
URL
Tianzhen Hong
15
http://www.sciencedirect.com/science/jou rnal/03787788/vsi/10K0F4HG0ND?sdc= 1
Andreas Wagner and Bing Dong
17
http://www.sciencedirect.com/science/jou rnal/03787788/vsi/10R14N5DN35?sdc=1
15
http://www.tandfonline.com/action/doSea rch?AllField=Fundamentals+of+occupan t+behavior+research&SeriesKey=tbps20
17
https://link.springer.com/journal/12273/1 0/6?wt_mc=alerts.TOCjournals
Liam O’Brien, Ardeshir Mahdavi, Burak Gunay, Farhang Tahmasebi Clinton Andrews and Bing Dong
A.5 List of publications With a large group of participants in Annex 66, many journal articles have been published on occupant behavior research and applications. The following list shows articles published from 2014–2017. [1] S. D’Oca, V. Fabi, S. P. Corgnati, and R. K. Andersen, “Effect of thermostat and window opening occupant behavior models on energy use in homes,” Building Simulation, vol. 7, no. 6, pp. 683-694, 2014. [2] P. De Wilde, “The gap between predicted and measured energy performance of buildings: A framework for investigation,” Automation in Construction, vol. 41, pp. 40-49, 2014. [3] S. D’Oca and T. Hong, “A data-mining approach to discover patterns of window opening and closing behavior in offices,” Building and Environment, vol. 82, pp. 726-739, 2014. [4] B. Dong and K. P. Lam, “A real-time model predictive control for building heating and cooling systems based on the occupancy behavior pattern detection and local weather forecasting,” Building Simulation, vol. 7, no. 1, pp. 89-106, 2014. [5] R. Gulbinas and J. E. Taylor, “Effects of real-time eco-feedback and organizational network dynamics on energy efficient behavior in commercial buildings,” Energy and buildings, vol. 84, pp. 493-500, 2014. [6] H. B. Gunay, W. O’Brien, I. Beausoleil-Morrison, R. Goldstein, S. Breslav, and A. Khan, “Coupling stochastic occupant models to building performance simulation using the discrete event system specification formalism,” Journal of Building Performance Simulation, vol. 7, no. 6, pp. 457-478, 2014. [7] H. B. Gunay, W. O’Brien, I. Beausoleil-Morrison, and B. Huchuk, “On adaptive occupant-learning window blind and lighting controls,” Building Research & Information, vol. 42, no. 6, pp. 739-756, 2014. [8] S. H. Jeong, R. Gulbinas, R. K. Jain, and J. E. Taylor, “The impact of combined water and energy consumption eco-feedback on conservation,” Energy and Buildings, vol. 80, pp. 114-119, 2014. [9] M. B. Kjærgaard and H. Blunck, “Tool support for detection and analysis of following and leadership behavior of pedestrians from mobile sensing data,” Pervasive and Mobile Computing, vol. 10, pp. 104-117, 2014.
146
[10] C. Li, T. Hong, and D. Yan, “An insight into actual energy use and its drivers in high-performance buildings,” Applied Energy, vol. 131, pp. 394-410, 2014. [11] W. O’Brien and H. B. Gunay, “The contextual factors contributing to occupants’ adaptive comfort behaviors in offices–A review and proposed modeling framework,” Building and Environment, vol. 77, pp. 77-87, 2014. [12] X. Ren, D. Yan, and C. Wang, “Air-conditioning usage conditional probability model for residential buildings,” Building and Environment, vol. 81, pp. 172-182, 2014. [13] A. Roetzel, A. Tsangrassoulis, and U. Dietrich, “Impact of building design and occupancy on office comfort and energy performance in different climates,” Building and environment, vol. 71, pp. 165-175, 2014. [14] K. Sun, D. Yan, T. Hong, and S. Guo, “Stochastic modeling of overtime occupancy and its application in building energy simulation and calibration,” Building and Environment, vol. 79, pp. 1-12, 2014. [15] Q. Wang and J. E. Taylor, “Energy saving practice diffusion in online networks,” Energy and Buildings, vol. 76, pp. 622-630, 2014. [16] S. Wei, R. Jones, and P. de Wilde, “Driving factors for occupant-controlled space heating in residential buildings,” Energy and Buildings, vol. 70, pp. 36-44, 2014. [17] X. Xu, J. E. Taylor, and A. L. Pisello, “Network synergy effect: Establishing a synergy between building network and peer network energy conservation effects,” Energy and Buildings, vol. 68, pp. 312-320, 2014. [18] J. Zhao, B. Lasternas, K. P. Lam, R. Yun, and V. Loftness, “Occupant behavior and schedule modeling for building energy simulation through office appliance power consumption data mining,” Energy and Buildings, vol. 82, pp. 341-355, 2014. [19] E. Azar and C. C. Menassa, “Evaluating the impact of extreme energy use behavior on occupancy interventions in commercial buildings,” Energy and Buildings, vol. 97, pp. 205-218, 2015. [20] H. Chandra-Putra, J. Chen, and C. J. Andrews, “Eco-Evolutionary Pathways Toward Industrial Cities,” Journal of Industrial Ecology, vol. 19, no. 2, pp. 274-284, 2015. [21] T. Cholewa and A. Siuta-Olcha, “Long term experimental evaluation of the influence of heat cost allocators on energy consumption in a multifamily building,” Energy and Buildings, vol. 104, pp. 122-130, 2015. [22] S. D’Oca and T. Hong, “Occupancy schedules learning process through a data mining framework,” Energy and Buildings, vol. 88, pp. 395-408, 2015. [23] X. Feng, D. Yan, and T. Hong, “Simulation of occupancy in buildings,” Energy and Buildings, vol. 87, pp. 348-359, 2015. [24] S. Guo, D. Yan, C. Peng, Y. Cui, X. Zhou, and S. Hu, “Investigation and analyses of residential heating in the HSCW climate zone of China: Status quo and key features,” Building and Environment, vol. 94, pp. 532-542, 2015. [25] J. Hetherington, A. Roetzel, and R. Fuller, “The impact of occupant behavior on residential greenhouse gas emissions reduction,” Journal of Green Building, vol. 10, no. 4, pp. 127-140, 2015. [26] T. Hong, S. D’Oca, S. C. Taylor-Lange, W. J. Turner, Y. Chen, and S. P. Corgnati, “An ontology to represent energy-related occupant behavior in buildings. Part II: Implementation of the DNAS framework using an XML schema,” Building and Environment, vol. 94, pp. 196-205, 2015. [27] T. Hong, S. D’Oca, W. J. Turner, and S. C. Taylor-Lange, “An ontology to represent energy-related occupant behavior in buildings. Part I: Introduction to the DNAs framework,” Building and Environment, vol. 92, pp. 764-777, 2015. [28] B. K. and K. H., “Influence of stochastic internal heat gains in multifamily buildings on yearly energy demand “ INSTAL (in Polish), vol. 12, pp. 55-61, 2015. [29] B. Kingma and W. van Marken Lichtenbelt, “Energy consumption in buildings and female thermal demand,” Nature climate change, vol. 5, no. 12, pp. 1054-1056, 2015. [30] X. Ren, D. Yan, and T. Hong, “Data mining of space heating system performance in affordable housing,” Building and Environment, vol. 89, pp. 1-13, 2015. [31] A. Roetzel, “Occupant behavior simulation for cellular offices in early design stages—Architectural and modelling considerations,” Building Simulation, vol. 8, no. 2, pp. 211-224, 2015. [32] Y. Xiong, U. Krogmann, G. Mainelis, L. A. Rodenburg, and C. J. Andrews, “Indoor air quality in green buildings: A case-study in a residential high-rise building in the northeastern United States,” Journal of Environmental Science and Health, Part A, vol. 50, no. 3, pp. 225-242, 2015/02/23 2015. [33] D. Yan, W. O’Brien, T. Hong, et al., “Occupant behavior modeling for building performance simulation: Current state and future challenges,” Energy and Buildings, vol. 107, pp. 264-278, 2015. [34] X. Zhou, D. Yan, T. Hong, and X. Ren, “Data analysis and stochastic modeling of lighting energy use in large office buildings in China,” Energy and Buildings, vol. 86, pp. 275-287, 2015. [35] K.-U. Ahn and C.-S. Park, “Correlation between occupants and energy consumption,” Energy and Buildings, vol. 116, pp. 420-433, 2016.
147
[36] J. An, D. Yan, G. Deng, and R. Yu, “Survey and performance analysis of centralized domestic hot water system in China,” Energy and Buildings, vol. 133, pp. 321-334, 2016. [37] C. J. Andrews, “The Changing Socioeconomic Context of Buildings,” Journal of Solar Energy Engineering, vol. 139, no. 1, pp. 011001-011001-10, 2016. [38] C. J. Andrews, M. S. Allacci, J. Senick, H. C. Putra, and I. Tsoulou, “Using synthetic population data for prospective modeling of occupant behavior during design,” Energy and Buildings, vol. 126, pp. 415-423, 2016/08/15/ 2016. [39] C. J. Andrews, D. Hattis, D. Listokin, J. A. Senick, G. B. Sherman, and J. Souder, “Energy-Efficient Reuse of Existing Commercial Buildings,” Journal of the American Planning Association, vol. 82, no. 2, pp. 113-133, 2016/04/02 2016. [40] E. Azar and C. C. Menassa, “Optimizing the performance of energy-intensive commercial buildings: Occupancy-focused data collection and analysis approach,” Journal of Computing in Civil Engineering, vol. 30, no. 5, p. C4015002, 2016. [41] V. M. Barthelmes, C. Becchio, and S. P. Corgnati, “Occupant behavior lifestyles in a residential nearly zero energy building: Effect on energy use and thermal comfort,” Science and Technology for the Built Environment, vol. 22, no. 7, pp. 960-975, 2016. [42] S. Carlucci, G. Lobaccaro, Y. Li, E. C. Lucchino, and R. Ramaci, “The effect of spatial and temporal randomness of stochastically generated occupancy schedules on the energy performance of a multiresidential building,” Energy and Buildings, vol. 127, pp. 279-300, 2016. [43] X. Feng, D. Yan, and C. Wang, “On the simulation repetition and temporal discretization of stochastic occupant behavior models in building performance simulation,” Journal of Building Performance Simulation, pp. 1-13, 2016. [44] X. Feng, D. Yan, C. Wang, and H. Sun, “A preliminary research on the derivation of typical occupant behavior based on large-scale questionnaire surveys,” Energy and Buildings, vol. 117, pp. 332-340, 2016. [45] I. Gaetani, P.-J. Hoes, and J. L. Hensen, “On the sensitivity to different aspects of occupant behavior for selecting the appropriate modelling complexity in building performance predictions,” Journal of Building Performance Simulation, pp. 1-11, 2016. [46] I. Gaetani, P.-J. Hoes, and J. L. Hensen, “Occupant behavior in building energy simulation: towards a fit-forpurpose modeling strategy,” Energy and Buildings, vol. 121, pp. 188-204, 2016. [47] E. L. Hewitt, C. J. Andrews, J. A. Senick, R. E. Wener, U. Krogmann, and M. Sorensen Allacci, “Distinguishing between green building occupants’ reasoned and unplanned behaviors,” Building Research & Information, vol. 44, no. 2, pp. 119-134, 2016/02/17 2016. [48] T. Hong, H. Sun, Y. Chen, S. C. Taylor-Lange, and D. Yan, “An occupant behavior modeling tool for cosimulation,” Energy and Buildings, vol. 117, pp. 272-281, 2016. [49] T. Hong, S. C. Taylor-Lange, S. D’Oca, D. Yan, and S. P. Corgnati, “Advances in research and applications of energy-related occupant behavior in buildings,” Energy and Buildings, vol. 116, pp. 694-702, 2016. [50] S. Hu, D. Yan, Y. Cui, and S. Guo, “Urban residential heating in hot summer and cold winter zones of China— Status, modeling, and scenarios to 2030,” Energy Policy, vol. 92, pp. 158-170, 2016. [51] B. R. Kingma, “The link between autonomic and behavioral thermoregulation,” Temperature: Multidisciplinary Biomedical Journal, vol. 3, no. 2, p. 195, 2016. [52] X. Liang, T. Hong, and G. Q. Shen, “Improving the accuracy of energy baseline models for commercial buildings with occupancy data,” Applied Energy, vol. 179, pp. 247-260, 2016. [53] X. Liang, T. Hong, and G. Q. Shen, “Occupancy data analytics and prediction: a case study,” Building and Environment, vol. 102, pp. 179-192, 2016. [54] W. O’Brien, I. Gaetani, S. Gilani, S. Carlucci, P.-J. Hoes, and J. Hensen, “International survey on current occupant modelling approaches in building performance simulation,” Journal of Building Performance Simulation, pp. 1-19, 2016. [55] W. O’Brien, H. B. Gunay, F. Tahmasebi, and A. Mahdavi, “A preliminary study of representing the interoccupant diversity in occupant modelling,” Journal of Building Performance Simulation, pp. 1-18, 2016. [56] A.P, Patton et al., “Airborne Particulate Matter in Two Multi-Family Green Buildings: Concentrations and Effect of Ventilation and Occupant Behavior,” International Journal of Environmental Research and Public Health, vol. 13, no. 1, p. 144, 2016. [57] A. Roetzel, “Variability of building simulation results depending on selected weather files and conditioning set points–a case study for a residential building in Victoria, Australia,” Journal of Green Building, vol. 11, no. 4, pp. 91-108, 2016. [58] W. Tian et al., “Relative importance of factors influencing building energy in urban environment,” Energy, vol. 111, pp. 237-250, 2016.
148
[59] C. Wang, D. Yan, H. Sun, and Y. Jiang, “A generalized probabilistic formula relating occupant behavior to environmental conditions,” Building and Environment, vol. 95, pp. 53-62, 2016. [60] D. Yan, Y. Jiang, and X. Shi, “Influence of asynchronous demand behavior on overcooling in multiple zone AC systems,” Building and Environment, vol. 110, pp. 65-75, 2016. [61] X. Yu, D. Yan, K. Sun, T. Hong, and D. Zhu, “Comparative study of the cooling energy performance of variable refrigerant flow systems and variable air volume systems in office buildings,” Applied Energy, vol. 183, pp. 725-736, 2016. [62] X. Zhou, D. Yan, X. Feng, G. Deng, Y. Jian, and Y. Jiang, “Influence of household air-conditioning use modes on the energy performance of residential district cooling systems,” Building Simulation, vol. 9, no. 4, pp. 429441, 2016. [63] K.U. Ahn, D.W. Kim, C.-S. Park, and P. de Wilde, “Predictability of occupant presence and performance gap in building energy simulation,” Applied Energy, 2017. [64] J. An, D. Yan, T. Hong, and K. Sun, “A novel stochastic modeling method to simulate cooling loads in residential districts,” Applied Energy, vol. 206, pp. 134-149, 2017. [65] Z. Belafi, T. Hong, and A. Reith, “Smart building management vs. intuitive human control—Lessons learnt from an office building in Hungary,” Building Simulation, pp. 1-18, 2017. [66] H. Chandra Putra, C. J. Andrews, and J. A. Senick, “An agent-based model of building occupant behavior during load shedding,” Building Simulation, journal article June 23 2017. [67] Y. Chen, T. Hong, and X. Luo, “An agent-based stochastic Occupancy Simulator,” Building Simulation, pp. 113, 2017. [68] Y. Chen, X. Liang, T. Hong, and X. Luo, “Simulation and visualization of energy-related occupant behavior in office buildings,” Building Simulation, pp. 1-14, 2017. [69] S. D’Oca, C.-F. Chen, T. Hong, and Z. Belafi, “Synthesizing building physics with social psychology: An interdisciplinary framework for context and occupant behavior in office buildings,” Energy Research & Social Science, vol. 34, pp. 240-251, 2017. [70] X. Feng, D. Yan, R. Yu, and Y. Gao, “Investigation and modelling of the centralized solar domestic hot water system in residential buildings,” Building Simulation, vol. 10, no. 1, pp. 87-96, 2017. [71] N. Ghiassi, F. Tahmasebi, and A. Mahdavi, “Harnessing buildings’ operational diversity in a computational framework for high-resolution urban energy modeling,” Building Simulation, pp. 1-17, 2017. [72] T. Hong, Y. Chen, Z. Belafi, and S. D’Oca, “Occupant behavior models: A critical review of implementation and representation approaches in building performance simulation programs,” Building Simulation, pp. 1-14, 2017. [73] T. Hong, D. Yan, S. D’Oca, and C.-f. Chen, “Ten questions concerning occupant behavior in buildings: the big picture,” Building and Environment, vol. 114, pp. 518-530, 2017. [74] Y. Cui, D. Yan, C.F. Chen. 2017. Exploring the factors and motivations influencing heating behavioral patterns and future energy use intentions in the hot summer and cold winter climate zone of China. Energy and Buildings, 153, 99-110. [75] S. Hu, D. Yan, S. Guo, Y. Cui, and B. Dong, “A survey on energy consumption and energy usage behavior of households and residential building in urban China,” Energy and Buildings, vol. 148, pp. 366-378, 2017. [76] K. Katić, R. Li, B. Kingma, and W. Zeiler, “Modelling hand skin temperature in relation to body composition,” Journal of Thermal Biology, vol. 69, pp. 139-148, 2017. [77] J. Kim, R. de Dear, T. Parkinson, and C. Candido, “Understanding patterns of adaptive comfort behavior in the Sydney mixed-mode residential context,” Energy and Buildings, vol. 141, pp. 274-283, 2017. [78] B. Kingma, M. Schweiker, A. Wagner, and W. van Marken Lichtenbelt, “Exploring internal body heat balance to understand thermal sensation,” Building Research & Information, pp. 1-11, 2017. [79] R. Kramer, L. Schellen, H. Schellen, and B. Kingma, “Improving rational thermal comfort prediction by using subpopulation characteristics: a case study at Hermitage Amsterdam,” Temperature, pp. 1-11, 2017. [80] J. G. C. Laurent, H. W. Samuelson, and Y. Chen, “The impact of window opening and other occupant behavior on simulated energy performance in residence halls,” Building Simulation, pp. 1-14, 2017. [81] J. Lindner, S. Park, and M. Mitterhofer, “Determination of requirements on occupant behavior models for the use in building performance simulations,” Building Simulation, pp. 1-14, 2017. [82] X. Luo, K. P. Lam, Y. Chen, and T. Hong, “Performance evaluation of an agent-based occupancy simulation model,” Building and Environment, vol. 115, pp. 42-53, 2017. [83] W. T. O’Brien, I. Gaetani, S. Carlucci, P.-J. Hoes, and J. Hensen, “On occupant-centric building performance metrics,” Building and Environment, 2017. [84] H. Pallubinsky, B. R. Kingma, L. Schellen, B. Dautzenberg, M. A. van Baak, and W. D. van Marken Lichtenbelt, “The effect of warmth acclimation on behavior, thermophysiology and perception,” Building Research & Information, pp. 1-8, 2017.
149
[85] H. Pallubinsky, L. Schellen, B. Kingma, B. Dautzenberg, M. van Baak, and W. van Marken Lichtenbelt, “Thermophysiological adaptations to passive mild heat acclimation,” Temperature, pp. 1-11, 2017. [86] S. Pan et al., “Cluster analysis for occupant-behavior based electricity load patterns in buildings: A case study in Shanghai residences,” Building Simulation, pp. 1-10, 2017. [87] D. Yan, T. Hong, B.Dong, A. Mahdavi, S. D’Oca, I. Gaetani, X. Feng. 2017. IEA EBC Annex 66: Definition and simulation of occupant behavior in buildings. Energy and Buildings, 156, 258-270. [88] M. Schweiker, B. Kingma, and A. Wagner, “Evaluating the performance of thermal sensation prediction with a biophysical model,” Indoor Air, 2017. [89] K. Sun and T. Hong, “A framework for quantifying the impact of occupant behavior on energy savings of energy conservation measures,” Energy and Buildings, vol. 146, pp. 383-396, 2017. [90] K. Sun and T. Hong, “A simulation approach to estimate energy savings potential of occupant behavior measures,” Energy and Buildings, vol. 136, pp. 43-62, 2017. [91] W. van Marken Lichtenbelt, M. Hanssen, H. Pallubinsky, B. Kingma, and L. Schellen, “Healthy excursions outside the thermal comfort zone,” Building Research & Information, pp. 1-9, 2017. [92] S. Veselá, B. Kingma, and A. Frijns, “Local thermal sensation modeling—a review on the necessity and availability of local clothing properties and local metabolic heat production,” Indoor air, vol. 27, no. 2, pp. 261272, 2017. [93] P. Zhu, M. Gilbride, D. Yan, H. Sun, C. Meek. Lighting energy consumption in ultra-low energy buildings: Using a simulation and measurement methodology to model occupant behavior and lighting controls. Building Simulation, 2017. Springer, 799-810. [94] P. Xue, T. Hong, B. Dong, and C. Mak, “A preliminary investigation of water usage behavior in single-family homes,” Building Simulation, pp. 1-14, 2017. [95] D. Yan, T. Hong, C. Li, Q. Zhang, J. An, and S. Hu, “A thorough assessment of China’s standard for energy consumption of buildings,” Energy and Buildings, vol. 143, pp. 114-128, 2017. [96] S. Yilmaz, S. K. Firth, and D. Allinson, “Occupant behavior modelling in domestic buildings: the case of household electrical appliances,” Journal of Building Performance Simulation, pp. 1-19, 2017. [97] Q. Zhang, D. Yan, J. An, T. Hong, W. Tian, and K. Sun, “Spatial distribution of internal heat gains: A probabilistic representation and evaluation of its influence on cooling equipment sizing in large office buildings,” Energy and Buildings, vol. 139, pp. 407-416, 2017. [98] S. Pan, X. Wang, Y. Wei, X. ZHANG, et al. Cluster analysis for occupant-behavior based electricity load patterns in buildings: A case study in Shanghai residences. Building Simulation, 2017. Springer, 889-898. [99] X. Zhou and D. Yan, “Influence of load feature on the water distribution system in a centralized airconditioning system,” Science and Technology for the Built Environment, vol. 23, no. 2, pp. 277-284, 2017. [100] X. Zhou, D. Yan, and X. Shi, “Comparative research on different air conditioning systems for residential buildings,” Frontiers of Architectural Research, vol. 6, no. 1, pp. 42-52, 2017. [101] P. Zhu, M. Gilbride, D. Yan, H. Sun, and C. Meek, “Lighting energy consumption in ultra-low energy buildings: Using a simulation and measurement methodology to model occupant behavior and lighting controls,” Building Simulation, pp. 1-12, 2017. [102] S. D’Oca, T. Hong, and J. Langevin, “The human dimensions of energy use in buildings: A review,” Renewable and Sustainable Energy Reviews, vol. 81, pp. 731-742, 2018. [103] I. Gaetani, P.J. Hoes, J.L.M. Hensen. Estimating the influence of occupant behavior on building heating and cooling energy in one simulation run. Applied Energy, 2018, 223: 159-171.
150
Appendix B: Participants B.1 Participating countries There were 17 official participating countries in Annex 66. Tables B-1 and B-2 list the 123 contributors and 54 interested parties of Annex 66. Table B-1: List of contributors ID 1 2 3 4 5 6 7 8 9 10 11 12 13 14 15 16 17 18 19 20 21 22 23 24 25 26 27 28 29 30 31 32 33 34 35 36 37 38 39 40 41 42 43 44
Name Astrid Roetzel Jungsoo Kim Richard de Dear Ardeshir Mahdavi Farhang Tahmasebi Roberto Lamberts Burak Gunay Liam O'Brien Sara Gilani Brian Mak Cary Chan Chuang Wang Cui Li Da Yan Dongnan Hu Francis Yik Hongsan Sun Jean Qin Jimmy Tong Martha Hao Panyu Zhu Qun Zhao Ronghui Qi Sam CM Hui Shuqin Chen Tong Yang Vincent Cheng Wei Tian Xiaohang Feng Xiaoxin Ren Xinqiao Yu Yang Geng Yiwen Jian Yu Huang Yuan Jin Zhengrong Li Bjarne W. Olesen Henrik Madsen Mikkel Kjærgaard Rune Korsholm Andersen Sebastian Wolf Eric Vorger Quentin Darakdjian Shahzad Muhammad
Country Australia Australia Australia Austria Austria Brazil Canada Canada Canada China China China China China China China China China China China China China China China China China China China China China China China China China China China Denmark Denmark Denmark Denmark Denmark France France France
Affiliation Deakin University The University of Sidney The University of Sidney TU Wien TU Wien Universidade Federal de Santa Catarina Carleton University Carleton University Carleton University CLP Power Hong Kong Limited Hong Kong Green Building Council Tsinghua University Tongji University Tsinghua University The University of Hong Kong Analogue Group of Companies Tsinghua University Swire Properties Arup Hong Kong Office Defond Holdings Ltd, Hong Kong Tsinghua University Tongji University The Hong Kong Polytechnic University The University of Hong Kong Zhejiang University University of Nottingham Ningbo Ove Arup & Partners HK Limited Tianjin University of Science and Technology Tsinghua University Tsinghua University Tsinghua University Tsinghua University Beijing University of Technology The Hong Kong Polytechnic University Tsinghua University Tongji University Technical University of Denmark Technical University of Denmark University of Southern Denmark Technical University of Denmark Technical University of Denmark MINES ParisTech, France AI Environment G-SCOP, France
151
45 46 47 48 49 50 51 52 53 54 55 56 57 58 59 60 61 62 63 64 65 66 67 68 69 70 71 72 73 74 75 76 77 78 79 80 81 82 83 84 85 86 87 88 89 90 91 92 93 94 95 96 97 98 99 100
Andreas Wagner Christoph van Treeck Davide Cali Dirk Mueller Gunnar Grun Marcel Schweiker Romana Markovic Sumee Park Andras Reith Zsofia Belafi Anna Laura Pisello Cristina Piselli Jessica Romanelli Marilena De Simone Mora Guerra Dafni Piero Bevilacqua Simona D'Oca Valentina Fabi Verena Marie Barthelmes Yohei Yamaguchi Ad van der Aa Boris Kingma Isabella Gaetani Jan Hensen Peter Op't Veld Pieter-Jan Hoes Manfred Plagmann Jakub Władysław Dziedzic Laurent Georges Salvatore Carlucci Vojislav Novakovic Karol Bandurski Łukasz Przybylski Maciej Ławrynowicz Armando Pinto Junjing Yang Majid Sapar Yujie LU Jung Hyun Yoo Stoyan Danov Bin Yang Gülsu Ulukavak Harputlugil Andrew Cowie Andy Tindale Darren Robinson David Shipworth Gesche Huebner Lai Jiang Pieter de Wilde Runming Yao Selin Yilmaz Shen Wei Stephanie Gauthier Yao Meng Bing Dong Bruce Nordman
Germany Germany Germany Germany Germany Germany Germany Germany Hungary Hungary Italy Italy Italy Italy Italy Italy Italy Italy Italy Japan Netherlands Netherlands Netherlands Netherlands Netherlands Netherlands New Zealand Norway Norway Norway Norway Poland Poland Poland Portugal Singapore Singapore Singapore South Korea Spain Sweden Turkey UK UK UK UK UK UK UK UK UK UK UK UK USA USA
Karlsruhe Institute of Technology RWTH Aachen University RWTH Aachen University RWTH Aachen University Fraunhofer Institute for Building Physics Karlsruhe Institute of Technology RWTH Aachen University Fraunhofer Institute for Building Physics ABUD Ltd. ABUD Ltd. University of Perugia University of Perugia University of Perugia University of Calabria University of Calabria University of Calabria Politecnico di Torino Politecnico di Torino Politecnico di Torino Osaka University ABT bv Maastricht University Eindhoven University of Technology Eindhoven University of Technology Huygen Engineers and Consultants Eindhoven University of Technology BRANZ Ltd., New Zealand Norwegian University of Science and Technology Norwegian University of Science and Technology Norwegian University of Science and Technology Norwegian University of Science and Technology Poznan University of Technology Adam Mickiewicz University Poznan University of Technology National Laboratory for Civil Engineering National University of Singapore Building and Construction Authority Singapore National University of Singapore Hanbat National University CIMNE Umeå University Çankaya University University of Strathclyde DesignBuilder University of Nottingham UCL Energy Institute UCL Energy Institute Reading University Plymouth University Reading University London-Loughborough Research Centre for Energy Demand Northumbria University University of Southampton Loughborough University University of Texas at San Antonio Lawrence Berkeley National Laboratory
152
101 102 103 104 105 106 107 108 109 110 111 112 113 115 116 117 118 119 120 121 122 123 124
Carol Menassa Chien-fei Chen Chris Hammer Clinton Andrews Drury Crawley Jared Langevin Ji-Hyun Kim Jie (Jay) Zhao Joana Abreu Joon-Ho Choi Julia Day Khee Poh Lam Kaiyu Sun Michael Brambley Qinran Hu Sang Hoon Lee Sarah Taylor-Lange Shalini Ramesh Tianzhen Hong Xiaojing Xu Yimin Zhu Yixing Chen Yong X. Tao
USA USA USA USA USA USA USA USA USA USA USA USA USA USA USA USA USA USA USA USA USA USA USA
University of Michigan University of Tennessee Sustainable Design + Behavior Rutgers University Bentley Systems Lawrence Berkeley National Laboratory Georgia Institute of Technology Delos Living LLC Fraunhofer CSE, USA University of Southern California Washington State University Carnegie Mellon University; NUS, Singapore Lawrence Berkeley National Laboratory Pacific Northwest National Laboratory University of Tennessee Knoxville Lawrence Berkeley National Laboratory Lawrence Berkeley National Laboratory Carnegie Mellon University Lawrence Berkeley National Laboratory University of Tennessee Louisiana State University Lawrence Berkeley National Laboratory University of North Texas
153
Table B-2: List of interested parties ID 1 2 3 4 5 6 7 8 9 10 11 12 13 14 15 16 17 18 19 20 21 22 23 24 25 26 27 28 29 30 31 32 33 34 35 36 37 38 39 40 41 42 43 44 45 46 47 48 49 50 51 52 53 54
Name Dong Chen Shady Attia Joseph Lai Ming-yin Chan Qingshan Jia Song Pan Yiqun Pan Zhun Yu Katerina Sojkova Kim B. Wittchen Per Heiselberg Philip Delff Benjamin Haas Bruno Duplessis Francois-Pascal Neirac Julie Dugdale Stephane Ploix Natale Arcuri Katashi Matsunawa Rui Hu Shin-ichi Tanabe Natasa Nord Anna Bogdan Malgorzata Basinska Mariusz Adamski Tomasz Cholewa Honjun Moon Majid Bin Haji Sapar Mike Barker Bin Yang Thomas Olofsson Joakim Widen Per Sahlin Claire Das Bhaumik Hu Du John Allison Luis Sousa Mahroo Eftekhari Nigel Gilbert Oliver Pengelly Yangang Xing Afshin Afshari Elie Azar Burcin Becerik Carol C. Menassa Jim Lutz John E. Taylor Mirsad Hadzikadic Murilo W Bonilha Wangda Zuo Zheng O'Neill Zheng Yang Karumuna Kaijage Pamela Flattau
Country Australia Belgium China China China China China China Czech Republic Denmark Denmark Denmark France France France France France Italy Japan Japan Japan Norway Poland Poland Poland Poland Republic of Korea Singapore South Africa Sweden Sweden Sweden Sweden UK UK UK UK UK UK UK UK United Arab Emirates United Arab Emirates USA USA USA USA USA USA USA USA USA USA USA
Affiliation CSIRO University of Liège The Hong Kong Polytechnic University The Hong Kong Polytechnic University Tsinghua University Beijing University of Technology Tongji University Hunan University Czech Technical University in Prague Aalborg University Aalborg University Technical University of Denmark CSTB MINES Paris Tech MINES Paris Tech University of Grenoble Grenoble Institute of Technology University of Calabria Nekken Sekkei Limited Nekken Sekkei Limited Waseda University Norwegian University of Science & Technology Warsaw University of Technology Poznan University of Technology Bialystok University of Technology Lublin University of Technology Dankook University Nanyang Technological University BuildingPhysics ZA Umeå University, Umeå University Uppsala University IDA-ICE Inkling LLP Building Physics Consultancy Cardiff University University of Strathclyde DesignBuilder Loughborough University University of Surrey Arup AECOM Masdar Institute of Science and Technology Masdar Institute of Science and Technology University of Southern California University of Michigan - Ann Arbor Hot Water Research Virginia Tech UNC Charlotte UTRC University of Miami University of Alabama Stanford University The PsySiP Project The PsySiP Project
154
B.2 Communication and meetings There were nine in-person Experts meetings (Table B-3), including one international workshop to develop the concept of Annex 66 in 2013, two meetings during the preparation phase in 2014, and six meetings during the working phase from 2014–2017. The first Experts meeting in the working phase was held at LBNL, Berkeley, USA, to officially kick off the research activities. The final Experts meeting, held at Tsinghua University, Beijing, China, summarized the key research activities and outcomes of Annex 66. Several conference calls were organized among the operating agents and subtask leaders to discuss project progress and coordinate research activities. Table B-3: Nine meetings of Annex 66 No.
Date
City
Number of participating countries
Number of participants
Note
1
August 23, 2013
Paris
15
23
International Workshop
2
March 13-14, 2014
Hong Kong
13
40
3
August 5-6, 2014
Nottingham
13
35
4
March 30 - April 1, 2015
Berkeley
16
71
5
August 4-5, 2015
Karlsruhe
14
60
6
March 31 - April 1, 2016
Vienna
22
61
7
August 4-5, 2016
Ottawa
14
41
8
May 18-19, 2017
Copenhagen
15
54
9
September 8-9, 2017
Beijing
17
70
1st Experts meeting preparation phase 2nd Experts meeting preparation phase 1st Experts meeting working phase 2nd Experts meeting working phase 3rd Experts meeting working phase 4th Experts meeting working phase 5th Experts meeting working phase 6th Experts meeting working phase
155