OFFICE APPLIANCE ENERGY CONSUMPTION DATA MINING ... In this study, electricity meter data of office appliances are used to predict occupant ..... (Subtask 6.4) and National Science Foundation-Emerging Frontiers in Research and.
OCCUPANT BEHAVIOR AND SCHEDULE PREDICTION BASED ON OFFICE APPLIANCE ENERGY CONSUMPTION DATA MINING J. Zhao; R. Yun; B. Lasternas; H. Wang; K.P. Lam; A. Aziz; V. Loftness Center for Building Performance and Diagnostics, School of Architecture Carnegie Mellon University, Pittsburgh, Pennsylvania, USA 15213 ABSTRACT Plug load and Heating Ventilation and Air Conditioning (HVAC) systems are the two largest energy consumers in commercial buildings. The use of the 2 systems is closely related to occupant behavior and schedule. It is significant to learn the occupant behavior pattern and predict occupancy schedule for controlling the systems to save energy. A data mining study is performed on the office appliance energy consumption data to predict the individual occupant behavior and the occupancy schedule in an open office space. An experiment is conducted for 2 weeks by using wireless electric outlet meters. The 5minute interval electricity consumption data of computers, computer monitors, task lights, and other office appliances are monitored for 6 office workers. Occupant behavior is categorized as “Occupied computer-based work”, “Occupied non-computer-based work”, “Unoccupied remote work”, and “Unoccupied”. C4.5 algorithm is used for pattern recognition over the appliance electricity consumption data individually. The average percentage of correct of the 6 individuals is 92.39% using 10-fold cross validation. The occupancy schedule for the space is predicted by using total energy consumption of each subject with Linear Regression algorithm. The correlation coefficient is 0.92 using 10-fold cross validation. The results suggest the models are feasible and can be applied to the plug load and HVAC control systems to reduce energy consumptions. Keywords: occupant behavior, occupancy schedule, office appliance, electricity data mining INTRODUCTION In the U.S., More than 80% of the total site energy in commercial buildings is consumed by office appliance, service equipment and HVAC systems [1]. The use of appliance and HVAC is highly dependent on occupant behavior and schedule, which are difficult to directly control by traditional means. Besides, the standby power of office appliances, known as “phantom load”, is often neglected and uncontrollable by occupants. Thus, the need for understanding occupant behavior is essential for reducing plug load. Several studies have explored methods to predict the occupant behavior and schedule in commercial and residential buildings. Environmental sensors were often used to detect and predict occupant behavior and schedule. Infrared motion, temperature, CO2, acoustics, and/or light sensor data were used in the studies of [2-7]. Stochastic modeling method was used to predict occupant behavior in [8-11]. The research above has demonstrated the data mining method is capable of predicting occupant behavior and/or schedule for both plug load and HVAC energy saving purpose. However, on the one hand, due to the diversity of human behavior, stochastic modeling may only valid for the tested subjects in the tested location, and on-site sensor data seems to be essential for generalizing the learning method. On the other hand, environmental sensor networks can be costly for installing and maintenance in office buildings. And the robustness of environmental sensors can also influence the prediction result.
CISBAT 2013 - September 4-6, 2013 - Lausanne, Switzerland
549
In this study, electricity meter data of office appliances are used to predict occupant behavior and schedule, respectively. The presented results show the feasibility of the method in the tested open office. METHOD Experiment Setup and Data Processing The experiment set up in an open office space in the Intelligent Workplace (IW) on the Carnegie Mellon University campus in Pittsburgh, Pennsylvania USA was designed to collect individual office appliance electricity consumption data and record occupant behavior concurrently for 2 weeks. 6 voluntary office workers (4 males and 2 females) age from 24 to 28 years old participated in the experiment. The metered office appliances include desktop computer, computer monitor(s), task light, speaker, laptop computer, hard drive and personal heater. Plugwise meter/switch devices are used to collect individual office appliance electricity data for each participant [12]. A webbased data collection system is developed by [13] and is modified to collect power consumption data in 5-minute interval for this study. A Matlab program is developed to extract the data from a web-based SQL server and generate a “clean” CSV-format file. Occupant behavior is classified into 4 categories, (1) “Occupied computer-based work” indicates the occupant is working with the computer actively at his/her bay. (2) “Occupied non-computer-based work” indicates the occupant is at his/her bay, but does not use the computer. The possible activities include paper-based tasks, discussing with colleagues, having lunch, having phone calls and so on. (3) “Unoccupied remote work” suggests the occupant is not at his/her office bay, but is using the desktop computer by remote connection. (4) “Unoccupied” means the occupant is not in his/her office bay and is not working remotely either. Occupant behavior is recorded for “ground truthing”, which should be the “true” result of the prediction that will only be used for training and testing the model for the model building period. The implementation of the trained model would not need this part of experiment. First, a Java program is developed to detect mouse and keyboard activities and record the time that both devices are not used within 5 minutes. Second, a Fitbit ZipTM pedometer is used to indicate whether the occupant is at his/her office bay [14]. Subjects are required to wear the device on his/her wrist for the period of the study. The device contacts the desktop Bluetooth dongle every 9 seconds when it is within a 20 feet (6.09 meter) range from the computer. By reading the 2 pieces of information, the occupant behavior can be recorded and categorized, as shown in Table 1. “Occupied computer-based work” “Occupied non-computer-based work” “Unoccupied remote work” “Unoccupied”
Computer in active mode 1 0 1 0
Subject is in the bay 1 1 0 0
Table 1: Occupant behavior ground truth labeling. Individual Occupant Behavior Recognition Method 6 datasets of 4332 instances with 4-6 attributes are trained and tested individually using 10fold cross validation in Weka program [15]. 3 nominal classification data mining algorithms are considered, including Support Vector Machine (SVM), C4.5, and Locally Weighted
550
CISBAT 2013 - September 4-6, 2013 - Lausanne, Switzerland
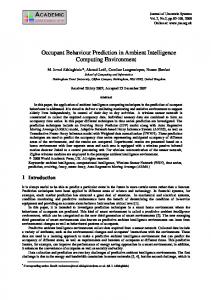
Learning (LWL) [15-17]. 2-tailed paired-T test with the confidence of 0.05 is used for result comparison [15]. Occupancy Schedule Prediction Method For economic and technical reasons, 2 datasets are compared for occupancy schedule learning. One is sub-metered raw dataset from individual appliances, which has 33 attributes. The other is the aggregated energy consumption data of all the appliances for each subject, which has 6 attributes. The reason for comparing the two datasets is that the less data a method requires the more practical the method will be. In most office spaces, appliance-byappliance sub-metering data may not be available but subject-by-subject meters are much more economical. 3 numeric regression data mining algorithms –Support Vector Regression (SVR), LWL, and Linear Regression (LR) - are tested by 10-fold cross validation in Weka program. The results are compared by using 2 tailed paired-T test with the confidence of 0.05. RESULTS Individual Occupant Behavior Recognition Result Figure 1 illustrates the ground truth value of all the subjects’ behavior schedule in a typical work day. The figure indicates the subjects have diversified working schedules. Sub1 has an earlier and regular office work schedule. Sub 2 works either remotely or without computer. Subs 3, 4, and 5 have similar computer-based work schedules and lunch break schedules. Sub 6 is absence during the tested day.
Occupied computerbased work
Sub1 Sub2
Occupied noncomputer-based work
Sub3 Sub4
Unoccupied remote work
Sub5 Sub6 7:00:00 AM 7:25:00 AM 7:50:00 AM 8:15:00 AM 8:40:00 AM 9:05:00 AM 9:30:00 AM 9:55:00 AM 10:20:00 AM 10:45:00 AM 11:10:00 AM 11:35:00 AM 12:00:00 PM 12:25:00 PM 12:50:00 PM 1:15:00 PM 1:40:00 PM 2:05:00 PM 2:30:00 PM 2:55:00 PM 3:20:00 PM 3:45:00 PM 4:10:00 PM 4:35:00 PM 5:00:00 PM 5:25:00 PM 5:50:00 PM 6:15:00 PM 6:40:00 PM 7:05:00 PM 7:30:00 PM 7:55:00 PM
Unoccupied
Figure 1: True value of all the subjects’ behavior schedule in a typical work day. Table 2 shows the result of the “percentage of correct” and “kappa statistic” for the 6 datasets using the 3 algorithms [15]. No statistically significant difference among the 3 algorithms is found. Therefore, from the practical point of view, C4.5 can be a suitable candidate to be used in practice. By comparing the 6 subjects, one can see Sub 1 and Sub 6 have highest percentage of correct, but the kappa statistic value for Sub 1 is the highest among all the subjects, while the kappa statistic value for Sub 6 is the lowest among all. The possible explanation is that nominal value of Sub 6 is highly skewed to “unoccupied”, which is 89.93% of the entire class value. While other subjects’ “unoccupied” class value percentage are 74.51%, 63.73%, 72.46%, 80.77%, and 72.25% for Sub 1 to Sub 5, respectively. Despite the diversity of the subject behaviors, by using C4.5 algorithm, the average percentage of correct is 92.39%, and the average kappa statistic is 0.68. The overall learning result is satisfactory, although the patterns of each subject are dissimilar.
CISBAT 2013 - September 4-6, 2013 - Lausanne, Switzerland
551
SVM 95.96 / 0.87 82.06 / 0.61 94.92 / 0.85 90.65 / 0.62 89.26 / 0.71 96.69 / 0.04
Subject 1 Subject 2 Subject 3 Subject 4 Subject 5 Subject 6
LWL 96.00 / 0.87 82.05 / 0.61 94.94 / 0.85 90.61 / 0.62 88.85 / 0.70 97.02 / 0.29
C4.5 96.02 / 0.87 84.43 / 0.66 94.95 / 0.85 92.12 / 0.66 89.56 / 0.71 97.26 / 0.37
Table 2: Occupant behavior recognition result (percentage of correct / kappa statistic). Occupied computerbased work Occupied noncomputer-based work
Ground truth value
Unoccupied remote work
Predicted value 7:00:01 AM 7:25:01 AM 7:50:01 AM 8:15:01 AM 8:40:01 AM 9:05:01 AM 9:30:01 AM 9:55:01 AM 10:20:01 AM 10:45:01 AM 11:10:01 AM 11:35:01 AM 12:00:01 PM 12:25:02 PM 12:50:01 PM 1:15:01 PM 1:40:01 PM 2:05:02 PM 2:30:01 PM 2:55:01 PM 3:20:01 PM 3:45:01 PM 4:10:01 PM 4:35:01 PM 5:00:02 PM 5:25:01 PM 5:50:01 PM 6:15:01 PM 6:40:02 PM 7:05:01 PM 7:30:02 PM 7:55:02 PM
Unoccupied
Figure 2: True value and predicted value of Sub 1 in a typical work day. Figure 2 illustrates the comparison between the ground truth value and predicted value of Sub 1 in a typical work day. The model can predict fairly accurately for occupied computer-based work. However, the model fails to distinguish “occupied non-computer-based work” and “unoccupied” instances in 2 cases, as highlighted in Figure 2. First, from 11:00am to 11:20am, there are several “non-computer-based work” instances, but the model categorized the instances as “unoccupied”. When looking at the raw dataset of these instances, the 2 computer monitors were off, due to the “sleep mode” setting of the computer. Given the fact that “computer” and “computer monitor” have high weights on the model, it is expectable the model may make mistakes in this situation. Second, at 12:35pm, the ground truth value is “unoccupied”, while the predicted value is “occupied non-computer-based work”. Comparing the raw data of electricity meters from 12:20pm to 12:35pm, no significant difference between the first 3 instances and the last one can be found. Thus the authors believe the ground truth value of 12:35pm may be a random error, which may occur when no movement is detected by the Fitbit device for 5 minutes. This error case should rarely happen during the experiment, since the device has an accurate acceleration sensor and the subject is required to wear it on the wrist during the experiment period. Occupancy Schedule Prediction Result
Dataset by appliances Dataset by subjects
SVR 0.93 / 0.27 0.92 / 0.32
LWL 0.85 / 0.48 0.83 / 0.52
LR 0.93 / 0.28 0.92 / 0.33
Table 3: Occupancy schedule prediction result (correlation coefficient / relative absolute error). 2 datasets are trained and tested by using SVR, LWL, and LR algorithms. The correlation coefficient and relative absolute error are shown in Table 3 [16]. No statistically significant
552
CISBAT 2013 - September 4-6, 2013 - Lausanne, Switzerland
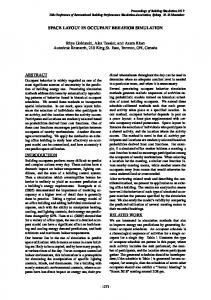
6 5 4 3 2 1 0 -1
Ground truth value Predicted value 7:00:01 AM 7:25:01 AM 7:50:01 AM 8:15:01 AM 8:40:01 AM 9:05:01 AM 9:30:01 AM 9:55:01 AM 10:20:01 AM 10:45:01 AM 11:10:01 AM 11:35:01 AM 12:00:01 PM 12:25:02 PM 12:50:01 PM 1:15:01 PM 1:40:01 PM 2:05:02 PM 2:30:01 PM 2:55:01 PM 3:20:01 PM 3:45:01 PM 4:10:01 PM 4:35:01 PM 5:00:02 PM 5:25:01 PM 5:50:01 PM 6:15:01 PM 6:40:02 PM 7:05:01 PM 7:30:02 PM 7:55:02 PM 8:20:01 PM 8:45:01 PM
# of occupants
difference is found among the 3 different algorithms and among the 2 datasets. Hence, for predicting occupancy schedule, using LR algorithm over the subject-by-subject electricity meter data can be applicable. Figure 1 shows the comparison between the ground truth value and predicted value of occupancy schedule in a typical work day by using LR algorithm over the dataset by subjects. The relative absolute error is 0.33 for the tested period.
Figure 3 True value and predicted value of occupancy schedule in a typical work day DISCUSSION Although the 2 models suffer a similar problem that the information of energy use may not be sufficient for distinguish “non-computer-based work” and “unoccupied” as mentioned in the “RESULT” section. It may not be a problem for HVAC system control in a multi-person zone, but could be a problem for single-person individually controlled HVAC system, in which case, alternative solutions have been tested and implemented to predict single person’s schedule [18]. To avoid the error disturbance for appliance control, time step can be increased from 5 minutes to longer time, and the control algorithm should check for status change consistency as well. For instance, only actuate the appliance when the behavior change continues for more than 2 time steps. Future work will be focused on implementing the two models into the HVAC and plug load control systems and testing the energy saving results and recording the possible occupant behavior change. For predicting occupancy schedules, the model may be applied directly to the offices with similar appliance configuration without conducting ground truthing experiment. Dissimilarly, for individual occupant behavior prediction, more subjects should be tested and compared by using ground truthing method to draw a statistically significant conclusion. Then a more generalized model may be applicable for control purpose. CONCLUSION The study proposed a solution to learn and predict occupant behavior and schedule in open office spaces using office appliance electricity meter data. The average percentage of correct of individual behavior recognition is 92.39%. The correlation coefficient of occupancy schedule prediction is 0.92. The results suggest that despite the variation of individual occupant behaviors and schedules, the method is feasible to be used for HVAC and plug load systems control. ACKNOWLEDGEMENTS The authors would like to acknowledge DOE Energy Efficient Building Hub (EEB-HUB) (Subtask 6.4) and National Science Foundation-Emerging Frontiers in Research and Innovation (NSF-EFRI) (Subtask 2.2) for funding the study. The authors would also like to acknowledge the 6 volunteers for participating the experiment.
CISBAT 2013 - September 4-6, 2013 - Lausanne, Switzerland
553
REFERENCES 1.
2.
3.
4.
5. 6. 7. 8. 9.
10. 11.
12. 13.
14. 15. 16.
17.
18.
554
DOE. Commercial Sector Energy Consumption. Building Energy Data Book 2012 March; Available from: http://buildingsdatabook.eren.doe.gov/TableView.aspx?table=3.1.4. Dong, B. and K.P. Lam, Building energy and comfort management through occupant behaviour pattern detection based on a large-scale environmental sensor network. Journal of Building Performance Simulation, 2011. 4(4): p. 359-369. Goldstein, R., et al. Real Time Sensor Based Occupancy Prediction for Model Predictive Control in Buildings. Model predictive control in buildings workshop. 2011. Montreal: IBPSA. Glicksman, L.R. and S. Taub, Thermal and behavioral modeling of occupantcontrolled heating, ventilating and air conditioning systems. Energy and Buildings, 1997. 25: p. 243-249. Agarwal, Y., et al. Occupancy-Driven Energy Management for Smart Building Automation. BuildSys 2010. 2010. Zurich, Switzerland: ACM. Wang, C., D. Yan, and Y. Jiang, A novel approach for building occupancy simulation. Building Simulation, 2011. 4: p. 149-167. Zhang, R., et al., Information-theoretic environment features selection for occupancy detection in open office spaces. Building Simulation, 2012. 5: p. 179-189. Page, J., et al., A generalised stochastic model for the simulation of occupant presence. Energy and Buildings, 2008. 40: p. 83-98. Parys, W., D. Saelens, and H. Hens, Coupling of dynamic building simulation with stochastic modelling of occupant behaviour in offices – a review-based integrated methodology. Journal of Building Performance Simulation, 2011. 4(4): p. 339-358. Tabak, V. and B.d. Vries, Methods for the prediction of intermediate activities by office occupants. Building and Environment, 2010. 45: p. 1366-1372. Tanimoto, J., A. Hagishima, and H. Sagara, A methodology for peak energy requirement considering actual variation of occupants’ behavior schedules. Building and Environment, 2008. 43: p. 610-619. Plugwise. Circle. 2013; Available from: http://www.plugwise.com/idplugtype-b/circle. Yun, R., et al. Toward the Design of a Dashboard to Promote Environmentally Sustainable Behavior among Office Workers. 8th International Conference, PERSUASIVE 2013. 2013. Sydney, Australia: Springer Berlin Heidelberg. Fitbit. Fitbit Zip. Fitbit 2013; Available from: http://www.fitbit.com/zip/specs. Ian H. Witten, E.F., Mark A. Hall, Data Mining Practical Machine Learning Tools and Techniques - 3rd ed. 2011, Amsterdam: Morgan Kaufmann. Zhao, J. and K.P. Lam, Influential factors analysis on LEED building markets in U.S. East Coast cities by using Support Vector Regression. Sustainable Cities and Society, 2012. 5(0): p. 37-43. Dong, B., C. Chen, and S.E. Lee, Applying support vector machines to predict building energy consumption in the tropics. Energy and Buildings, 2005. 37(5): p. 545-553. Dong, B., Integrated Building Heating, Cooling and Ventilation Control (PhD Dissertation), 2010, Carnegie Mellon University: Pittsburgh.
CISBAT 2013 - September 4-6, 2013 - Lausanne, Switzerland