Deleted Interpolation Using a Hierarchical Bayesian Grammar Network for Recognizing Human Activity Kris M. Kitani, Yoichi Sato Institute of Industrial Science The University of Tokyo Tokyo 158-8505, Japan {kitani, ysato}@iis.u-tokyo.ac.jp
Akihiro Sugimoto National Institute of Informatics Tokyo 101-8430, Japan
[email protected]
Abstract
The characteristics of human activities can be learned from perceptual psychology [1]. Activities are hierarchical. That is, they are taxonomically organized, existing at various levels of abstraction. For example, walking and running are a type of moving. Activities are also partonomical meaning that primitive actions are temporally constrained. For example, the activity of leaving an object in a room might consist of a sequence of primitive actions: (1) enter the room, (2) put down the object and (3) exit the room. Activities can also be temporally overlapped. For example, the transition of a person walking through a room might overlap with the activity of the person departing from the room. From our perspective, it is difficult to identify the exact time at which the activity walking through has ceased and when the activity departing has started. Thus there is an inherent ambiguity at transitions between human activities which should be represented by a cognitive system. To address the latter half of the problem, namely the computational recognition of human activities from a sequence of video images, we need an efficient method of incorporating the characteristics of activity mentioned above. The recognition system must encode hierarchical information, capture temporally constrained activities and accurately represent temporally overlapped activities. Our contribution lies in the novel application of deleted interpolation (DI) - a smoothing technique used in natural language processing - for recognizing temporally overlapped activities. This paper addresses the issue of hierarchical structure by implementing a stochastic context-free grammar (SCFG). We convert the SCFG into a Bayesian network (BN) to create a hierarchical Bayesian network (HBN) which enables us to execute more complex probability queries across the grammar. We then apply the HBN via DI to a string of observed primitive action symbols to recognize various activities, especially those that are overlapped. It is noted here that we are not directly addressing the issue of extracting symbols from a video sequence. Instead, we assume that a set of reliable low-level observations (e.g.
From the viewpoint of an intelligent video surveillance system, the high-level recognition of human activity requires a priori hierarchical domain knowledge as well as a means of reasoning based on that knowledge. We approach the problem of human activity recognition based on the understanding that activities are hierarchical, temporally constrained and temporally overlapped. While stochastic grammars and graphical models have been widely used for the recognition of human activity, methods combining hierarchy and complex queries have been limited. We propose a new method of merging and implementing the advantages of both approaches to recognize activities in real-time. To address the hierarchical nature of human activity recognition, we implement a hierarchical Bayesian network (HBN) based on a stochastic context-free grammar (SCFG) . The HBN is applied to digressive substrings of the current string of evidence via deleted interpolation (DI) to calculate the probability distribution of overlapped activities in the current string. Preliminary results from the analysis of activity sequences from a video surveillance camera show the validity of our approach.
1
Introduction
The automated real-time understanding of human activities from a video sequence is a topic of growing interest in recent times. In the field of video surveillance, detecting suspicious activity in real-time would mean stopping crimes while they are happening or even before they happen. In application to human-computer interfaces, computers could adjust according to the activity context of the user. An intelligent system that recognizes high-level human activities offers a wide range of applications to aid people in everyday activities. To implement a system that recognizes human activities, our task then becomes two-fold. First, we need a psychological framework for characterizing human activity and secondly, we need a computational method of analyzing those activities. 1
appearance and movement attributes) are available to us, allowing us to focus on building up a scheme for activity recognition. Furthermore, the method of grammar creation is not the focus of this paper and therefore the grammar been created heuristically.
2
Our justification in using a SCFG to model human activity is based on the idea that it models hierarchical structure that closely resembles the inherent hierarchy in human activity. Just as series of words can be represented at a higher level of abstraction, a series of primitive actions can also be represented at a higher level of abstraction. By recognizing the close analogy between strings of words and series of actions, we reason that SCFGs are well suited for representing grammatical structure. Despite the expressive power of the SCFG, they were created to characterize formal language and thus in general, parsers are not well-suited for handling uncertainty. Bayesian networks give us the robustness needed to deal with faulty sensor data, especially when dealing with human actions. In contrast to standard parsing algorithms, the merit of using an BN is found in the wide range of queries that can be executed over the network, as explained in [12]. In addition, BNs can deal with negative evidence, partial observations (likelihood evidence) and even missing evidence, making it a favorable framework for vision applications.
Related Research
Contributions from computer vision and pattern recognition started with Brand in [2] and [3], when he utilized a deterministic action grammar to interpret a video sequence of a person opening a computer housing unit. Multiple parses over a stream of outputs from the low-level event detector were ranked and stored, giving priority to the highest ranking parse. Ivanov [4] first used a SCFG for action recognition, using the Earley-Stolcke parser to analyze a video sequence of cars and pedestrians in a parking lot. Moore [5] also used a SCFG to recognize actions in a video sequence of people playing Blackjack. They extend the work of Ivanov by adding error correction, recovery schema and role analysis. Minnen [6] built on the modifications made by Moore by adding event parameters, state checks and internal states. They applied the SCFG to recognize and make predictions about actions seen in a video sequence of a person performing the Towers of Hanoi task. From a background in plan recognition, Bui [7] used a hierarchy of abstract policies using Abstract Hidden Markov Models (AHMM) implementing a probabilistic state-dependent grammar to recognize action. The system recognizes people going to the library and using the printer across multiple rooms. AHMMs closely resemble the Hierarchical Hidden Markov Models (HHMM) [8] but with an addition of an extra state node. Nguyen [9] used an abstract Hidden Memory Markov Model (AHMEM), a modified version of the AHMM, for the same scenario as Bui. The aforementioned works use domains with high-level activities delineated by clear starting points and clear ending points, where the observed low-level action primitives are assumed to describe a series of temporally constrained activities (with the exception of Ivanov [4]). However, in our research we focus on a subset of human actions that have the possibility of being temporally overlapped. We show that these types of actions can be recognized efficiently using our new framework.
3
4
Recognition System Overview
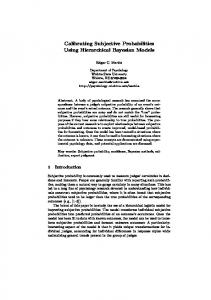
Our recognition system consists of three major parts (Figure 1). The first is the action grammar (a SCFG) that describes the hierarchical structure for all the activities to be recognized. Second is the hierarchical Bayesian network that is generated from the action grammar. Third is the final module that takes a stream of input symbols (level 1 action symbols) and uses deleted interpolation to determine the current probability distribution across each possible output symbol (level 2 action symbol). We give the details of our system based on the use of the CAVIAR data set [13], which is a collection of video sequences of people in a lobby environment. The ground truth for each agent in each frame is labeled in XML with information about position, appearance, movement, situation, roles, and context. For practical reasons, we make direct use of the ground truth data as low-level input into our system and in the next subsection we explain how this ground truth data was used to create an input stream for our system. Input symbols (Level 1 actions)
Deleted Interpolation
Stochastic Context-Free Grammar
Hierarchical Bayesian Network
Output symbols (Level 2 actions)
Modeling Human Action
Most human actions are ordered hierarchically much like sentences in a natural language. Thus an understanding of hierarchy about human actions should be leveraged to reason about those actions, just like one might guess at the meaning of a word from its context. We assert that the SCFG [10] and the BN [11] lay the proper groundwork for hierarchical analysis of human activity recognition using a vision system.
Figure 1: System Flow Chart. Dashed lines indicate off-line components and bold lines indicate online components. Level 1 actions symbols and the HBN are merged via the deleted interpolation step to produce level 2 actions.
2
Table 1: Definition of the grammar symbols (a) Grammar for producing level 1 symbols (b) Definition of the level 1 actions (terminal symbols) (c) Definition of the level 2 actions and intermediate actions (nonterminal symbols). Level 1 Actions en ex ne br in mp wa pu pd
Appearance appear disappear visible visible visible visible visible
AI MV MT MF
4.1
S S S S S S S
㸢 㸢 㸢 㸢 㸢 㸢 㸢
BI BR TK LB PT AR DP
BI BI BI BI BI BI BI BI BI
㸢 㸢 㸢 㸢 㸢 㸢 㸢 㸢 㸢
AI MV AI mp mp MF MF MV AI
TK TK TK TK TK
㸢 㸢 㸢 㸢 㸢
pu MV pu pu MV
PT PT
Position
Meaning enter : appears in the scene exit: disappears from the scene near exit/ entrance : moving near an exit / entrance browse : standing near landmark inactive: standing still move in place : standing but moving walk : moving within a certain velocity range put down : release object pick up : contact with object (b)
Level 2 Actions AR BI BR TK LB PT DP Intermediate Actions
Production Rule
active/walking near exit/entrance active/inactive near a landmark inactive active walking referenced to object properties referenced to object properties (a)
Level 1 Actions en ex ne br in mp wa pd pu
Movement
Table 2: Level 2 action grammar. Probability 0.20 0.10 0.05 0.05 0.30 0.15 0.15
ne MV wa ne
0.10 0.10 0.10 0.10 0.20 0.10 0.10 0.10 0.10
pu mp wa pu MV
0.50 0.20 0.20 0.10 0.10
㸢 en wa ex 㸢 ne wa ne
0.70 0.30
AI MV AI MV mp
Meaning
AR 㸢 en AR 㸢 en MV
Arriving : Arriving into the scene Being Idle : Spending extra time in the scene Browsing : Showing interest in an object in the scene Taking away : Taking an object away Leaving behind : Leaving an object behind Passing Through : Passing through the scene Departing : Leaving the scene
0.50 0.50
Production Rule
Probability
BR BR BR BR
㸢 㸢 㸢 㸢
br MV br br mp MV br mp
0.20 0.20 0.30 0.30
LB LB LB LB LB LB
㸢 㸢 㸢 㸢 㸢 㸢
pd MV pd pd mp pd wa pd mp wa mp pd mp
0.50 0.20 0.05 0.05 0.10 0.10
DP DP DP DP
㸢 㸢 㸢 㸢
ex wa ne ex ne ex wa ne
0.40 0.30 0.20 0.10
MV MV MV MV
㸢 㸢 㸢 㸢
MF MT wa mp
0.20 0.20 0.30 0.30
MF 㸢 mp wa MT 㸢 wa mp
1.00 1.00
㸢 in 㸢 br 㸢 pu 㸢 pd
0.60 0.20 0.10 0.10
AI AI AI AI
N is defined as N = I ∪ A. The set of production rules Σ and their corresponding probabilities p are given in Table 2.
Meaning Action in Place: Taking action while in place Moving : Moving with a minimum velocity Move to : Moving in place after walking Move from : Walking after moving in place (c)
4.2
Hierarchical Bayesian Network
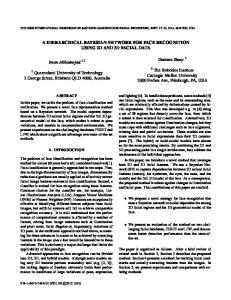
We use the methods presented in [12] to transform the action grammar (level 2 grammar) into a hierarchical Bayesian network (HBN). We use the term HBN because information about hierarchy from the SCFG is embedded in the BN. By converting the action grammar to a HBN, evidence nodes E contain terminal symbols, query nodes Q contain level 2 actions A and hidden nodes H contain production rules Σ or intermediate action I. Results of transforming the grammar in Table 2 into a HBN is depicted in Figure 2. We denote the probability density function (PDF) for level 2 actions2 to be P(A|e) where A = {A1 , A2 , . . . , An } is the set of all level 2 actions (states). e = {e1 , e2 , . . . , el } is a string of evidence at the evidence nodes of the HBN where l is the maximum length of the HBN. The probability of a specific level 2 action is defined as the sum of the probabilities from each of the query nodes,
Action Grammar
The set of terminals (level 1 action symbols) is defined as T= {en, ne, ex, mp, wa, in, br, pu, pd } (see Figure 1b). The level 1 action symbols were generated directly from the CAVIAR XML ground truth data using the appearance, movement and position information for each frame (Figure 1a) . 1 The set of action symbols (called level 2 actions) A = {BI, BR, T K, LB, PT, AR, DP}, along with a set of intermediate action symbols I = {AI, MV, MT, MF} were created manually to be a set of high-level actions to be used by the system (see Figure 1c). Level 2 actions are a special subset of nonterminal symbols in the level 2 grammar because they are direct abstraction productions of S (start symbol), i.e. they are directly caused by S. The set of nonterminals
P(A|e) = P(Q1 = A|e) + · · · + P(Qm = A|e).
1 Again,
we note here that neither grammar creation nor the extraction of low-level symbols is the focus of our work. Instead, we assume a set of reliable input symbols and present a hand-given grammar to validate our system.
2 P will be used when dealing with probabilities of multi-valued discrete variables. It denotes a set of equations with one equation for each value of the variable.
3
Q1 H1 Q2 N_i1j3k1 none BI BR TK LB PT AR DP nil
0 7.80 2.70 0.60 1.45 31.1 0 4.67 51.7
H2
Q3 H3 Q4
Query Node
H4
Q5
H5 H7
H6 Q6
Current State
P_i1j3k1 none BI MVj2k2 ST... BI STj1k2 MV... BI mpj1k1 STj... BI MFj2k1 mpj... BI MVj1k2 nej... BI STj1k2 w a... BR MVj2k2 b... BR MVj1k2 b... TK MVj2k2 p... TK MVj1k2 p... LB MVj2k2 p... LB pdj1k1 mp... LB mpj1k1 pd... PT enj1k1 nej... PT nej1k1 w ... DP w aj1k1 n... nil Sj2k3 nil nil
0 0.83 0.83 1.24 2.07 0.75 2.07 0.83 1.87 0.41 0.19 0.41 0.52 0.52 21.8 9.34 4.67 1.99 49.7
Evidence
none mp pd en ne wa br pu in MF MT ST ex
16.8 12.3 2.84 31.6 11.6 9.79 4.31 2.70 2.51 0 0 1.90 3.67
m2
m2
m2
m1
m1
m1
et −2
et −1
et
Figure 3: System depicted as a dynamic Bayesian network where the memory elements store past evidence.
H 11
Q8
H 12 Q9
H 13 H 16
H 15
E1
E2
length because a long sequence takes into consideration more information. However, when analysis over a long (more precise) input sequence fails we would like to fall back on analysis based on a shorter (more reliable) subsequence. To implement this we calculate the current probability distribution S across level 2 actions, at each time instance, as a weighted sum of models,
H 14 H 17
E3
Figure 2: Hierarchical Bayesian Network (maximum length l = 3). The content of each node type is depicted by a bar chart.
When there are n different level 2 actions, P(A|e) represents a set of n equations
S = ∑li=1 λi P(A|Oi ), where Oi is the string of full evidence when i = 1 and represents digressive subsequences of the evidence as the index i increases. The weights are constrained by ∑li=1 λi = 1. At present the weights are hand-given but for future works, weights will be estimated using expected maximization or some other numerical algorithm. Representing our system as a dynamic Bayesian network yields the network in Figure 3. Memory nodes are added to the network to store past evidence and the maximum number of memory nodes is l − 1, where l is the length of the analysis window. When l = 3 the current probability distribution of the level 2 actions over a temporal window of 3 is given by the equation
P(A1 |e) = P(Q1 = A1 |e) + · · · + P(Qm = A1 |e), P(A2 |e) = P(Q1 = A2 |e) + · · · + P(Qm = A2 |e), ··· P(An |e) = P(Q1 = An |e) + · · · + P(Qm = An |e). The probabilities of the level 2 actions A = {A1 , A2 , . . . , An } always sum to one when the evidence can be explained by the grammar because A is the set of all possible productions of S (start symbol). Thus, ∑ni=1 P(Ai |e) = 1.
4.3
St
H 10
H9 Q7
Evidence Node N_i1j1k1
S t −1
Memory
Hidden Node
H8
St −2
Deleted Interpolation
S = λ1 P(A|O1 ) + λ2 P(A|O2 ) + λ3 P(A|O3 ),
The concept of deleted interpolation (DI) involves combining two (or more) models of which one provides a more precise explanation of the observations but is not always reliable and the another which is more reliable but not as precise. A precise model requires that the input data be a close fit to the model and will reject anything does not match. A reliable model exhibits greater tolerance in fitting the data and is more likely to find a match. Combining models allows us to fall back on the more reliable model when the more precise model fails to explain the observations. It is called deleted interpolation because the models which are being interpolated use a subset of the conditioning information of the most discriminating function [10]. In our system we assume that the analysis of a long sequence of evidence is more precise than that of a shorter
where
3
O1
t−2 = {et1 , et−1 2 , e3 }
O2 O3
none = {et1 , et−2 } 2 , e3 t none none = {e1 , e2 , e3 }.
In the special case of using DI for activity recognition, each term in the DI equation represents the probability distribution for a new activity (level 2 action) beginning at a previous time instance. The resulting current probability distribution S is a mixture of probability distributions of various overlapping activities. This is the mechanism that effectively allows the system to represent overlapped activities. 3 enone
4
is a terminal symbol that represents an end of the sequence.
Table 3: Definitions for ground truth labeling.
300
644
428
741
504
884
Arriving
A period of time where the agent has just entered the scene. It must occur near a known exit or entrance.
Passing Through
Agent appears to be simply walking through the lobby. Pattern should look like: Enter + passing through + exit. Agent is not looking around.
Being Idle
The agent appears to be walking around aimlessly. Usually characterized by walking slowly and stoping in place. Sometimes includes browsing.
Browsing
Period of time where the agent is near a landmark (counter, magazine rack, information booth). The agent appears to be looking at a landmark.
Taking Away
Leaving Behind 970
1057
1025
Figure 4: Key frames for the ”Leave Behind and Pick Up” (Leave1) sequence.
5
Departing
Agent appears to be picking something up or preparing to pick something up. Includes movement just before and after picking up the object. The agent appears to be putting something down or preparing to put something down. Includes movement just before and after putting down the object. Period of time where it seems that the agent is about to exit the scene. Ceases once the agent exits the scene.
Table 4: Definitions (a) Definition of the data types (b) Formulas for the different rates.
Experimental Results
The following experiment shows that our method for singleagent activity recognition is well-suited for recognizing temporally constrained and temporally overlapped activities. The ground truth was compiled as a normalized sum of the interpretations of multiple people. Each labeler was given a definition (shown in Table 3) for each level 2 action and asked to label each action separately. They were also given the option of labeling each frame with a yes, maybe or no (10 points for yes, 5 points for maybe and 0 points for no ). No restrictions were placed on the number of times they could re-label the video sequences. Analysis was run on six video sequences (Walk1, Walk2, Browse1, Browse2, Leave1 and Leave2) to test the detection rate of the system. The results for each of the six video sequences are shown as normalized stacked area charts. Temporal overlap between level 2 actions are depicted as a decreasing or increasing stair case. All of the seven level 2 actions contained in the six sequences were successfully detected using the proposed system. Figure 5 shows an example of a temporally overlapped activity in the Walk1 sequence. The upper chart depicts the results of the ground truth labeling showing a transition from Arriving to Passing Through to Departing. Although the system was not able to reproduce the transition from Arriving (light blue) to Passing Through (purple), the overlap of Passing Through (purple) to Departing (dark blue) is depicted from about frame 480 to the end. Similar results were acquired for the remaining 5 sequences (Figure 6, Figure 7, Figure 8, Figure 9 and Figure 10). A summary of the
A
Number of RELEVENT data RETRIEVED
B
Number of RELEVENT data NOT RETRIEVED
C
Number of IRRELEVENT data RETRIEVED
D
Number of IRRELEVENT data NOT RETRIEVED (a)
RECALL
:A/(A+B)
Relevant data retrieved from all relevant data
PRECISION
:A/(A+C)
Relevent data retrieved from all retrieved data
MISS
:B/(A+B)
Relevant data missed (1 - Recall)
FALSE ALARM : C / ( C + D )
Irrelevant data retrieved from all irrelevant data (b)
quantitative results for each sequence is given in Table 5. The precision rate was 88% after filtering out a common problem (explained later). Including all the data, the overall precision rate was 72% which means that the detection of level 2 actions happened within the duration of the true action 72% of the time. Arriving and Departing had the highest precision rate (∼95%) because the activities were highly dependent location (i.e. near a known exit or entrance). Conversely, Taking Away had the lowest precision rate because while the ground truth data indicated an early starting point for the activity, the system was only able to detect the activity once the item was actually detected visually. The frequent misinterpretation of Being Idle as Passing Through had a negative effect on four out of the six sequences, contributing to a 16% drop in the precision rate (Browse1, Browse2, Leave1 and Leave2). Filtering out the misinterpretations of Passing Through (which is justified since a labeler without foreknowledge would have given similar results) would increase the overall precision rate to 88%. The recall (capture) rate was 59% (equivalently, a miss 5
ical state. However, in light of future modifications to improve the recall rate and precision rate, the introduction of likelihood probabilities might have an adverse effect on the false alarm rate. A simulation of the effects of a faulty vision sensor can be seen in the Walk2 sequence (Figure 6). While the ground truth data shows that Departing is continuously detected between frames 800 and 1000, the analysis results show a big gap in the sequence. This can be explained by the fact that from about frame 784 to frame 1016, the agent is moving around in a dark area near the back of the room. Although the agent is still perceived by the human eye, the location of the agent is unknown to the low-level vision system (i.e. simulates a lack of detection by a vision system). Thus, the system assumes that the agent has completely departed in frame 771. However, at frame 1096 the system encounters a enter symbol and recognizes the agent to be Arriving to the scene.
Table 5: Summary (a) Counts for the different rates (b) Rates for recall, precision, miss and false alarm.
Arriving
Passing Through
Being Idle
Browsing
Taking Away
Leaving Behind
Departing
Arriving
Passing Through
Being Idle
Browsing
Taking Away
Leaving Behind
Departing
Data Type A B C D A B C D A B C D A B C D A B C D A B C D A B C D
WALK1 52 3 8 218 215 32 0 34 0 0 0 281 0 0 0 281 0 0 0 281 0 0 0 281 26 94 0 161
WALK2 144 129 0 904 569 63 48 497 0 0 0 1177 0 0 0 1177 0 0 0 1177 0 0 0 1177 158 522 0 497
BROWSE1 BROWSE2 87 90 42 50 0 7 553 443 0 0 0 0 202 320 480 270 360 63 211 346 0 29 111 152 189 21 65 112 5 0 423 457 0 0 0 0 0 0 682 590 0 0 0 0 0 0 682 590 20 48 31 9 16 0 615 533 (a)
LEAVE1 116 49 2 719 0 0 263 623 229 208 151 298 0 0 0 886 82 32 76 696 62 27 8 789 151 76 1 658
LEAVE2 38 3 13 836 0 0 143 747 645 158 43 44 209 155 42 484 12 56 0 822 16 47 27 800 45 27 0 818
Total 527 276 30 3673 784 95 976 2651 1297 923 223 2063 419 332 47 3708 94 88 76 4248 78 74 35 4319 448 759 17 3282
Rate Recall Precision Miss False Alarm Recall Precision Miss False Alarm Recall Precision Miss False Alarm Recall Precision Miss False Alarm Recall Precision Miss False Alarm Recall Precision Miss False Alarm Recall Precision Miss False Alarm
WALK1 94.5% 86.7% 5.5% 3.5% 87.0% 100.0% 13.0% 0.0%
WALK2 52.7% 100.0% 47.3% 0.0% 90.0% 92.2% 10.0% 8.8%
BROWSE1 BROWSE2 67.4% 64.3% 100.0% 92.8% 32.6% 35.7% 0.0% 1.6%
LEAVE1 70.3% 98.3% 29.7% 0.3%
LEAVE2 92.7% 74.5% 7.3% 1.5%
0.0%
0.0%
0.0%
29.7% 52.4% 60.3% 47.6% 33.6% 0.0% 0.0% 0.0% 0.0% 71.9% 51.9% 28.1% 9.8% 69.7% 88.6% 30.3% 1.0% 66.5% 99.3% 33.5% 0.2%
16.1% 80.3% 93.8% 19.7% 49.4% 57.4% 83.3% 42.6% 8.0% 17.6% 100.0% 82.4% 0.0% 25.4% 37.2% 74.6% 3.3% 62.5% 100.0% 37.5% 0.0%
Average 65.6% 94.6% 34.4% 0.8% 89.2% 44.5% 10.8% 26.9% 58.4% 85.3% 41.6% 9.8% 55.8% 89.9% 44.2% 1.3% 51.6% 55.3% 48.4% 1.8% 51.3% 69.0% 48.7% 0.8% 37.1% 96.3% 62.9% 0.5%
0.0%
29.6% 63.0% 100.0% 37.0% 0.0% 74.4% 97.4% 25.6% 1.2%
54.2% 15.4% 68.5% 84.6% 16.0% 15.8% 100.0% 84.2% 0.0%
0.0%
0.0%
0.0%
0.0%
0.0% 21.7% 100.0% 78.3% 0.0%
0.0% 23.2% 100.0% 76.8% 0.0%
0.0% 39.2% 55.6% 60.8% 2.5% (b)
0.0% 84.2% 100.0% 15.8% 0.0%
6
Summary and Conclusion
We have addressed the issue of hierarchical representation of human activity by basing our system on a SCFG. We then converted the SCFG to a HBN to allow the system to make complex probabilistic queries needed for vision applications. We then applied the HBN using DI to discover overlapped activities in the input string of primitive action symbols. Through a set of preliminary experiments, it was shown that our methodology is well-suited for detecting the overlap of simple single-agent activities. In regards to the entire system, there are two challenges that will need to be addressed in future research, namely: the method of grammar creation and a framework for activity prediction. Manual grammar creation is not practical for large grammars and inversely, it is very difficult for a system to learn high-level activities without any supervision. Future work will need to create an interface and computational framework to find the right balance between user defined grammars and grammars discovered by the system. While the current framework also allows for activity prediction by marginalizing probabilities for future time steps, the conditions for activity prediction must still be evaluated. If a robust framework for activity prediction is found, predictive information could be used in many ways. Prediction about future activities using high-level reasoning would lead to a whole new realm of applications.
rate of 41%) which indicates that the system was not able to detect the activity for the complete duration of the level 2 action as described by the ground truth data. This can be explained by the nature of the input data which only changes states when there is a significant change in the movement and appearance of the agent (i.e. when a new terminal symbol is encountered) whereas the labeler uses a wider set of knowledge to reason about the actual duration of the activity. The gradual transitions between level 2 actions could be better characterized by utilizing likelihood probabilities (probabilities associated with each terminal symbol) for each piece of evidence. The false alarm rate was 6% but drops to 3% when the effects of Passing Through are removed. The low false alarm rate is expected because the input symbols (level 1 actions) only change when there is a true change in an agents phys-
Acknowledgments A part of this work was supported by Grants-in-Aid for Scientific Research from the Ministry of Education, Culture, Sports, Science and Technology of Japan (No. 13224051). 6
References
100% 90%
[1] Jeffrey M. Zacks and Barbara Tversky. Event Structure in Perception and Conception. Psychological Bulletin, 127:3– 21, 2001.
80% Departing
70% Probability
Leav ing Behind
[2] Matthew Brand. Understanding Manipulation in Video. In Proceedings of the 2nd International Conference on Automatic Face and Gesture Recognition, page 94. IEEE Computer Society, 1996.
60%
Taking Away
50%
Browsing
40%
Being Idle Passing Through
30%
Arriv ing
20% 10% 0%
[3] Matthew Brand. The ”Inverse Hollywood Problem”: From Video to Scripts and Storyboards via Causal Analysis. In Proceedings of the Fourteenth National Conference on Artificial Intelligence, pages 132–137, 1997.
230
280
330
380
430
480
Frame Number
100%
[4] Yuri A. Ivanov and Aaron F. Bobick. Recognition of visual activities and interactions by stochastic parsing. IEEE Transactions on Pattern Analysis and Machine Intelligence, 22(8):852–872, 2000.
90% 80% Departing
70% Probability
Leav ing Behind
[5] Darnell J. Moore and Irfan A. Essa. Recognizing Multitasked Activities from Video Using Stochastic Context-Free Grammar. In Eighteenth national conference on Artificial intelligence, pages 770–776, Menlo Park, CA, USA, 2002. American Association for Artificial Intelligence.
60%
Taking Away
50%
Browsing
40%
Being Idle Passing Through
30%
Arriv ing
20% 10% 0% 230
[6] David Minnen, Irfan A. Essa, and Thad Starner. Expectation Grammars: Leveraging High-Level Expectations for Activity Recognition. In Proceedings of the IEEE Computer Society Conference on Computer Vision and Pattern Recognition, pages II: 626–632. IEEE Computer Society, 2003.
280
330
380
430
480
Frame Number
Figure 5: Walk1 : Ground truth (top) and analysis results (bottom).
[7] Hung Hai Bui, Svetha Venkatesh, and Geoff A. W. West. Tracking and Surveillance in Wide-Area Spatial Environments Using the Abstract Hidden Markov Model. International Journal of Pattern Recognition and Artificial Intelligence, 15(1):177–195, 2001.
100% 90% 80% Departing
70% Probability
Leav ing Behind
[8] Shai Fine, Yoram Singer, and Naftali Tishby. The Hierarchical Hidden Markov Model: Analysis and Applications. Machine Learning, 32(1):41–62, 1998.
60%
Taking Away
50%
Browsing
40%
Being Idle Passing Through
30%
Arriv ing
20% 10%
[9] Nam T. Nguyen, Hung Hai Bui, Svetha Venkatesh, and Geoff A. W. West. Recognising and Monitoring High-Level Behaviours in Complex Spatial Environments. In Proceedings of the IEEE Computer Society Conference on Computer Vision and Pattern Recognition, pages II: 620–625. IEEE Computer Society, 2003.
0% 200
400
600
800
1000
1200
Frame Number
100% 90% 80%
[10] Christopher D. Manning and Hinrich Schutze. Foundations of Statistical Natural Language Processing. The MIT Press, 2003.
Departing
70% Probability
Leav ing Behind
[11] Stuart Russell and Peter Norvig. Artificial Intelligence: A Modern Approach. Prentice Hall, 2003.
60%
Taking Away
50%
Browsing
40%
Being Idle Passing Through
30%
Arriv ing
20%
[12] David V. Pynadath and Michael P. Wellman. Generalized queries on probabilistic context-free grammars. IEEE Transactions on Pattern Analysis and Machine Intelligence, 20(1):65–77, 1998.
10% 0% 200
400
600
800
1000
1200
Frame Number
[13] EC funded CAVIAR project under the IST Fifth Framework Programme (IST-2001-37540). Found at http://homepages.inf.ed.ac.uk/rbf/CAVIAR/.
Figure 6: Walk2 : Ground truth (top) and analysis results (bottom). Simulates the effect of a faulty vision system.
7
100%
100%
90%
90%
80%
80% Departing
70%
Departing
70%
Leav ing Behind Probability
Probability
Leav ing Behind 60%
Taking Away
50%
Browsing
40%
Being Idle
60%
Browsing
40%
Being Idle
Passing Through
30%
Passing Through
30%
Arriv ing
20%
20%
10%
10%
0% 300
Taking Away
50%
Arriv ing
0% 400
500
600
700
800
900
220
320
420
520
Frame Number
620
720
820
920
1020
Frame Number
100%
100%
90%
90%
80%
80% Departing
70%
Departing
70%
60%
Leav ing Behind Probability
Probability
Leav ing Behind Taking Away
50%
Browsing
40%
Being Idle
60%
Browsing
40%
Being Idle
Passing Through
30%
Passing Through
30%
Arriv ing
20%
20%
10%
10%
0% 300
Taking Away
50%
Arriv ing
0% 400
500
600
700
800
900
220
320
420
520
Frame Number
Figure 7: Browse1 : Ground truth (top) and analysis results (bottom).
720
820
920
1020
Figure 9: Leave1 : Ground truth (top) and analysis results (bottom).
100%
100%
90%
90%
80%
80% Departing
70% 60%
Leav ing Behind
Browsing
40%
Being Idle
Probability
Taking Away
50%
Departing
70%
Leav ing Behind Probability
620
Frame Number
60%
Taking Away
50%
Browsing
40%
Being Idle
Passing Through
30%
Passing Through
30%
Arriv ing
20%
20%
10%
10%
0%
0%
100 150 200 250 300 350 400 450 500 550 600 650
260
Arriv ing
360
460
560
Frame Number
660
760
860
960
1060
Frame Number
100%
100%
90%
90% 80%
80% Departing
70%
Departing
70%
Leav ing Behind
60%
Probability
Probability
Leav ing Behind Taking Away
50%
Browsing
40%
Being Idle Passing Through
30%
60%
Taking Away
50%
Browsing
40%
Being Idle Passing Through
30%
Arriv ing
Arriv ing
20%
20%
10%
10%
0%
0% 260
100 150 200 250 300 350 400 450 500 550 600 650
360
460
560
660
760
860
960
1060
Frame Number
Frame Number
Figure 10: Leave2 : Ground truth (top) and analysis results (bottom).
Figure 8: Browse2 : Ground truth (top) and analysis results (bottom).
8