dardized protocol that provides abstract network topology and cost maps in ad- ... Internet applications like file sharing, real-time communications and those ...
Delivering Application-Layer Traffic Optimization Services based on Public Routing Data at Internet eXchange Points Danny Alex Lachos Perez1 , Samuel Henrique Bucke Brito1 , Ramon dos Reis Fontes1 , Christian Esteve Rothenberg1 1
Universidade Estadual de Campinas (UNICAMP) Faculdade de Engenharia El´etrica e de Computac¸a˜ o (FEEC) Information & Networking Technologies Research & Innovation Group (INTRIG) Av Albert Einstein, 400, Cidade Universit´aria Zeferino Vaz, Campinas, SP, Brasil {dlachosp,shbbrito,ramonrf,chesteve}@dca.fee.unicamp.br
Abstract. Application-Layer Traffic Optimization (ALTO) is a recently standardized protocol that provides abstract network topology and cost maps in addition to endpoint information services that can be consumed by applications in order to become network-aware and take optimized decisions regarding traffic flows. In this paper, we propose a public service based on the ALTO specification using public routing information available at the Brazilian Internet eXchange Points (IXPs). Our ALTO server prototype takes the acronym of AaaS (ALTO-as-a-Service) and is based on over 2.5GB of real BGP data from the 25 Brazilian IX.br public IXPs. We evaluate our proposal in terms of functional behaviour and performance via proof of concept experiments which point to the potential benefits of applications being able to take smart endpoint selection decisions when consuming the developer-friendly ALTO APIs.
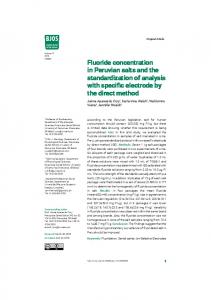
1. Introduction Internet applications like file sharing, real-time communications and those served from Content Delivery Networks (CDNs) rely on some sort of network topology and cost/performance information to select the best nodes in order to optimize the data transfer. Each application, however, uses different means to build such overlay maps without taking into account underlying network topology considerations or network operator insights. Thus, the application endpoint selection is commonly performed based on partial and inaccurate network views or even randomly in some cases, impacting both the application performance and efficient use of the networking infrastructure [Seedorf and Burger 2009]. Aiming to fill this gap, the Application-Layer Traffic Optimization (ALTO) protocol [Alimi et al. 2014] was designed to allow network operators to provide abstract network information to Internet applications, which can consume this useful information to optimize their connectivity decisions in alignment with the network operators’ cost interests and traffic engineering practices. The network information is conveyed in the form of abstract Map Services (Network Map and Cost Map) by an ALTO server (see Fig. 1). A Network Map divides all endpoints (e.g., IPv4/IPv6 addresses or prefixes) in ProviderDefined Identifiers (PIDs) and a Cost Map provides the cost between each pair of PIDs so that it is possible to have a ranking of priority or preference among any pair of endpoints.
Figure 1. Concept of ALTO and two main services: Network Map and Cost Map.
Most of ALTO implementations today are created by Internet Service Providers (ISPs) based on their individual knowledge of their network dynamics and the costs associated with peering and transit links [Gurbani et al. 2014]. However, recent efforts [Gurbani et al. 2014] show that third parties (not associated with ISPs) can also create valuable Network and Cost Maps from public information. In this work, we propose a public service called ALTO-as-a-Service (AaaS) that leverages the routing information openly available at Internet eXchange Points (IXPs). Different from related work such as [Madhukar and Williamson 2006] that provides ALTO services through the use of ISP’s policies (not available to outside parties), AaaS creates an operator-neutral and public ALTO services based on the BGP routing data from public IXPs operating in Brazil by the IX.br project [Brito et al. 2015]. The raw BGP data is converted into ALTO information, and then stored in a Graph Database (GDB) to be then delivered to ALTO clients through an ALTO server via RESTFul APIs. In order to define the Network Map, each Autonomous System Number (ASN) represents a PID and every prefix (IPv4/IPv6) advertised by an AS correspond to an endpoint. Based on this Network Map, we create different Cost Maps based on the physical or the AS-level topological distance between each pair of ASes. We evaluate AaaS regarding its functional behaviour (i.e. compliance to the ALTO protocol specifications) and performance profile of our proof of concept prototype implementation based on the OpenDaylight network controller.In addition, we run a series of experiments using a Mininet topology that reflects the BGP-based AS-level connectivity in order to validate the concept and show the potential benefits of applications using the abstract network information from the IXP routing views easily consumable through developers-friendly ALTO APIs. The remainder of this paper is structured as follows. Section 2 provides an overview of ALTO and includes a primer on IXPs. Section 3 presents the proposed architecture (AaaS) along the basic workflow. Then, the prototype implementation based on BGP data from IX.br is described in Section 4. Section 5 validates the proof of concept with three different experiments (functional, performance, and use case scenario). Section 6 and 7 describe, respectively, current limitations and related work of our research. Finally, we conclude the paper in Section 8 and point to our future work.
2. Background 2.1. ALTO Protocol Application-Layer Traffic Optimization (ALTO) [Alimi et al. 2014] is a recently Internet Engineering Task Force (IETF) standardized protocol (RFC 7285) with the main goal of exposing network information so that the applications can optimize their endpoint selec-
tions and make informed decisions on questions such as: provided a source IPsrc , which IPdst endpoints are the best1 among n candidate destinations. At a high level, ALTO is an information-publishing interface that fills the gap between networks and applications by allowing network operators to publicly expose abstract network information. This network-to-application information flow benefits both the network providers (i.e. ALTO information providers), who obtain better utilization of their networking infrastructure –provided applications base their endpoint decisions following the ALTO cost maps– and the applications (ALTO information consumers), which do not need to reverse engineer the network and each of them build their own topology maps and endpoint performance rankings. As shown in the ALTO architecture illustrated in Figure 2(a), an ALTO server gathers network information from multiple sources, such as routing protocols, dynamic and static network information, external interfaces, and so on. These input information is then used to generate an abstract and unified view of the network in the ALTO server, that, in turn, responds to ALTO client requests. The ALTO protocol is based on existing HTTP implementations such as RESTful interfaces for client-server interaction and JSON for request/reply encoding. ALTO Information Services (Fig. 2(b)) include two main services (Map Service: Network Map and Cost Map) and three additional ones: Network Map: represents a grouping of endpoints into PIDs (Provider-defined Identifier) that may be handled similarly based on its type, topological, physical proximity, or any other criteria. It is responsibility of the ALTO server provider to decide on the grouping of endpoints and the definition and semantics of PIDs. Cost Map: represents an abstract cost metric (absolute or relative) between any pair of PIDs in the form of path costs. The path cost is a custom-made cost defined and internally computed by the ALTO server implementation. Map-filtering Service: responsible to filter the result of queries on the Network Map and/or Cost Map to narrow the reply to a subset of PIDs specified by the ALTO client. Endpoint Property Service (EPS): provides ALTO clients with information about endpoint properties (e.g. which PID belongs a particular endpoint). Endpoint Cost Service (ECS): unlike the Cost Map (costs between PIDs), it provides information about costs between individual endpoints. 2.2. Internet eXchange Point An IXP is a shared physical network infrastructure regionally installed with the purpose to facilitate the exchange of Internet traffic between ASes With the traffic exchange as local as possible between different networks that belong to the same region, the number of hops between ASes and dependency on transit providers is reduced. Brazilian IXPs [Brito et al. 2015] are part of the IX.br project2 , which was created to promote the infrastructure and operational means to increase the connectivity between AS networks of Brazilian metropolitan regions interesting in fostering local Internet traffic exchange. Currently, featuring 25 IXPs in operation, IX.br is the largest IXP ecosystem in 1 2
The “best” according to some cost metric defined by the ALTO server provider http://ix.br
(a)
(b)
Figure 2. ALTO (a) Architecture (b) Information Service. Adapted from RFC 7285.
Latin America and it is among the world’s top ten both in number of members (1300+)3 and maximum throughput rate (above 1 Tbps)4 . The business model —in most cases, including Brazil— adopted by an IXP is open (multilateral peering), commonly allowing anyone to access a large amount of BGP public information through telnet connections to Looking Glass (LG) servers. IP control plane information such as the BGP routing tables, the list of BGP AS-PATH, the community codes, etc., can be retrieved, and by accessing the LGs. This open access to the public routing information is the main input to build the ALTO maps proposed in our work.
3. Design of ALTO-as-a-Service We propose to deliver ALTO as a public service useful to any application interested in information about AS-level network maps for IP endpoints. The main goal is to generate ALTO PIDs (Network Map) along a ranking of candidate PIDs (Cost Map) using the publicly available BGP routing information at IXPs. To this end, we collect BGP tables (IPv4 and IPv6) and parse the BGP AS-PATH attributes to create the ALTO Network Map and Cost Map respectively. The resulting data structures are stored in a graph-based database (Neo4j) and finally delivered as ALTO services through HTTP Rest APIs. Figure 3 illustrates the AaaS workflow: (a) Acquiring Input Data, (b) Building Graph Data Models, (c) Creating ALTO Information, and (d) Delivering ALTO Services to serve ALTO client requests. Examples of ALTO clients include, but are not limited to, (1) host running a peer-to-peer file sharing application, (2) tracker in peer-to-peer filesharing applications, or (3) Software Defined Networking (SDN) controllers. a) Acquiring Input Data. This first step is to collect BGP routing data publicly available through telnet access to LG servers, using the same methodology proposed in our IX.br ecosystem anatomy [Brito et al. 2015]. The BGP raw data is then pre-processed (formatting, filtering, and assembling) to facilitate its transformation into ALTO data structures. b) Building Graph Data Models. This process consists of building a suitable connected graph of nodes and relationships to model the ALTO information according to the protocol specification [RFC 7285]. We opt for a property graph5 since it provides a natural modeling approach to inherent native graph problem at hand. In addition, this approach 3
http://ix.br/particip, Accessed: September, 2015 http://ix.br/trafego, Accessed: September, 2015 5 A graph where (i) vertices and edges can have any number of key/value properties, (ii) there can be many types of relationships between vertices and (iii) edges have a directionality. 4
Table 1. Nodes and its properties in our graph data model.
Name PID EndPointAddress AddressType VersionTag
Properties Name Prefix Type ResourceID Tag
Description Name of a PID IP address and the length of the mask “ipv4” or “ipv6” ID unique for a resource (e.g. a Network Map) Version for a resource
Table 2. Relationships and pairs of nodes that connect them.
Name Has PID Has EndPoint Type EndPoint Cost
Start Node VersionTag PID AddressType PID
End Node PID EndPointAddress EndPointAddress PID
Description Version to which a PID belongs For grouping Endpoints to a PID To know the Endpoint type (IPv4/IPv6) Path cost between two PIDs
eases the implementation of this model using a Graph DB (Neo4j) as we detail in the following section. Figure 4 provides an overview of the components used in the graph, where nodes are entities that are connected by describing their interactions, i.e. the relationships. Table 1 provides more detailed information about the graph nodes and their properties. Information about the relationships can be found in Table 2. Noteworthy is the relationship labeled as Cost, where properties can be included to create different path costs between PIDs resulting in different Cost Maps. c) Creating ALTO Information. After having the input dataset and the data model ready, the next step is to create the ALTO information and populate the graph DB. In this step, the ALTO server administrator uses the BGP routing information retrieved to create (i) grouping of prefixes into PID (Network Map) by ASes, IXPs, BGP communities, points or presence, just to cite a few examples; and (ii) defining the preferences / costs between the groups PID (Cost Map) expressed on a path cost such as physical distance between IXPs, topological distances between ASes, etc. d) Delivering ALTO Services. The last step is deploying an ALTO web server implementing the client-server protocol delivering the REST/JSON APIs to ALTO clients as defined by RFC7285. Internal interfaces to retrieve ALTO information from the GDB are also necessary and we opt to converge on REST/JSON for convenience.
Figure 3. AaaS PoC Workflow
Figure 4. Neo4j Graph Data Model based on RFC 7285 [Alimi et al. 2014]
4. Prototype We now turn our attention to the implementation choices and prototype details of the AaaS proof of concept. In this section, we provide further details on the BGP data set from the Brazilian IXPs, the Neo4j6 graph-based database used as the back-end for the ALTO information, and the OpenDaylight7 (ODL) controller used as ALTO server. 4.1. Input: IX.br BGP Data Set The data collection methods based on LG remote access to each public IXP in Brazil are those described in [Brito et al. 2015]. More specifically, the dataset (approx. 2.5GB) retrieved during December 2014 was used for our prototype implementation. For data sharing and reproducibility purposes, the raw dataset (including all our 2015 snapshots) and all supporting code are publicly available in our research group repositories.8 For the pre-processing job of the raw data, we use a number of Java and R9 based algorithms. For example, with R we convert the files of IPv4 and IPv6 BGP table into a readable format and exclude prefixes that are advertised by more than 2 ASes.10 Using Java-based algorithms, we discard the AS-Paths (from the files of the summary list of BGP AS-PATH) which contain the ASN 20121 and ASN 26121 because they are reserved for the IX.br’s LG and RS respectively and, therefore, do not participate in Internet routing. Table 3 shows the number of ASes and the number of IPv4 and IPv6 prefixes before and after the pre-processing. As we can see, the amount of discarded data is not significant. 4.2. ALTO Server Backend: Neo4j As anticipated during the design discussion on the graph modeling approach, using a Graph Database (GDB) is a natural choice to realize the model and embody the ALTO information as a property graph. Furthermore, the ALTO protocol uses a key-value store abstraction for JSON object coding that is very amenable for the Neo4j implementation choice. Neo4j is an open-source non-relational GDB implemented in Java, highly scalable and flexible. It supports true ACID transactions, high availability, and scales to billions 6
http://neo4j.com/ https://www.opendaylight.org/ 8 https://github.com/intrig-unicamp/ixp-ptt-br/ https://github.com/intrig-unicamp/ALTO-as-a-Service/ 9 http://www.r-project.org 10 ALTO protocol uses the longest-prefix matching algorithm to compute the mapping from Endpoints to PIDs, therefore a Network Map must not define two or more PIDs that contain an identical Endpoint. 7
Table 3. Number of ASes and Prefixes (IPv4/IPv6) before and after the dataset pre-processing task at Brazilian IXPs.
ASes IPv4 Prefixes IPv6 Prefixes
Raw Data 49,586 563,164 21,666
After Proc. 48,962 556,628 21,427
% Out 1.26% 1.16% 1.10%
99% CL ±1 MOE 12,460 16,163 9,412
of nodes and relationships [Neo4j 2015]. In addition, application development is highly facilitated through using high-speed traversal query languages such as Cypher. As shown in Figure 5, to populate the Neo4j GDB, Java-based programs were developed to (i) read the input dataset, (ii) create the Network and Cost Map, and (iii) store the final property graphs into Neo4j using REST interfaces. Next we detail (a) how the endpoints are grouped into PIDs to create the Network Map, and (b) how the path cost between PIDs is computed to create the Cost Map: a) Network Map. For each pre-processed IPv4 and IPv6 BGP table, the developed algorithm reads each route announcement entry and extracts the ASN (Autonomous System Number) that originated/advertised a prefix. The ASN serves as the PID (location) grouping resulting in a total of 48,962 PIDs (consistent with the current global amount Internet AS). Next, each prefix (be it IPv4 or IPv6) is associated with a particular PID (i.e., AS) considering the origin of the prefix announcement. b) Cost Map. The path cost between PIDs is calculated as the AS-level topological distance corresponding to the amount of traversing ASes, i.e. path cost equals the number of AS hops between a source and destination AS. A lower cost between PIDs indicates a higher preference for traffic. Two Cost Maps variations are proposed: one which represents the absolute topological distance, and a second one which represents the relative distance. In the latter case, hops between ASes present in the same IXPs are zeroed to favor intra-IXP traffic. The AS-Path summary files are used to create these maps (see Fig. 5, Cost Map). First, we build the AS-level connectivity graph using an auxiliary GDB. Then, we compute the path cost between each pair of ASes using Cypher queries. Whenever more than one path between two ASes is found, the path with the least number of traversing ASes is chosen. Finally, the path cost is updated in the main ALTO GDB instance. The Cost Map is a square matrix of order N where N corresponds to the number of PIDs resulting in over 2.3 billion (109 ) relationships labeled as cost (two properties are used to distinguish between the absolute and relative distance). Hence, the process of Cost Map creation is partially completed in a proactive manner, while the remainder of the map is created on the fly (or reactively) based on ALTO client requests asking for path cost between specific PIDs. 4.3. ALTO Server Front-End: OpenDaylight In order to deliver ALTO services, we opt to reuse the OpenDaylight (ODL) controller that features an ALTO project11 since the Lithium software release. ODL is an open 11
https://wiki.opendaylight.org/view/ALTO:Main
source SDN controller architecture with production quality code and proven scalable and reliability. The initial release of ALTO in ODL includes, among other modules, ALTO Northbound providing basic ALTO services as RESTful web services (Northbound APIs) for ALTO client/server communications. ALTO Northbound APIs generate ALTO services from data stored in the MD-SAL data store (an ODL core component). For our AaaS implementation, it was necessary to modify the Northbound APIs to generate ALTO services from the data stored in the Neo4j GDB (instead of the MD-SAL topology). We checkout the stable/lithium branch in the ALTO project GitHub repository,12 which implements the following ALTO services: (i) full Map Service, (ii) Map-Filtering Service, (iii) Endpoint Property Service, and (iv) Endpoint Cost Service. To accomplish our proof of concept evaluations, our initial ALTO server delivers the Map-Filtering Service, i.e. the filtered Network Map and the filtered Cost Map, which allow ALTO clients to specify filtering criteria to return only a subset of the full Map Service. Hence, those two Northbound APIs were modified so that the ALTO server retrieves information from the Neo4j backend and converts into the ALTO format specification. All RESTFul API modifications are available in our public repository.
5. Experimental Evaluation We evaluate our proposal by carrying three different types of experiments using the proof of concept AaaS implementation:13 (1) functional behaviour (i.e. conformance to ALTO spec.), (2) system performance profiling, (3) emulated IXP use case scenario. Despite using real BGP data, the use case experiments are arguably simplified and mainly serve as a strawman to illustrate the potential of ALTO to deliver useful services to IXP members (and/or third-party applications) to perform better-than-random peer selection. 5.1. Functional Evaluation We evaluated whether the ALTO server delivers ALTO services in compliance to RFC 7285. For that, we used a REST client tool14 to retrieve ALTO information in JSON format by communicating with the ALTO server via HTTP request. As discussed in 12
https://github.com/opendaylight/alto R CoreTM I7-4790 @ 3.60GHz x 8 with 16GB RAM, running Ubuntu Single server configuration: Intel 14.04LTS (Linux) 64-bit. 14 https://www.getpostman.com/ 13
Figure 5. Map Service grouped by AS
the previous section, two RESTful web services are available. An example of the URI, HTTP Method, Content Type, Input Parameters and JSON Response for both the filtered Network Map and the filtered Cost Map (absolute distance) can be seen in Figure 6. To obtain the relative distance, HopsNumberPTT instead of HopsNumber is used as the input Cost-metric parameter. As expected, our AaaS prototype delivers the ALTO services in accordance with the ALTO specifications and fully reflects the ALTO information stored in Neo4j.
(a) Filtered Network Map
(b) Filtered Cost Map (absolute distance)
Figure 6. HTTP request and JSON response messages to the filtered Network and Cost Map services.
5.2. System Performance Profiling In order to assess the performance of our AaaS prototype, we calculate the response time for the filtered Network and Cost Map (absolute distance) services. For both services, between 1 to 100 PIDs15 are randomly selected, totaling 100 requests where each request is executed 10 times. The average transaction time is shown in Figure 7. For the Network Map service, we can observe that the response time increases in proportion to the number of PIDs (See Fig. 7(a), Network Map). For example, when the number of PIDs is 5 and 50, the average time was 0.19 Sec and 1.45 Sec, respectively. Regarding the Cost Map service, we have two PID input parameters (see Fig. 6(b)). A single PID is used as source PID (srcs parameter) and the amount of destination PIDs (dsts parameter) varies from 1 to 100. Another relevant factor in the response time is whether a proactive or reactive mode is evaluated. In order to evaluate the proactive approach, we select a source PID with all possible path costs already created (about 49K path costs). As shown in Figure 7(a), on average, the processing time is 19.73% (or 0.24 Sec) slower compared to the Network Map service. We have a higher query cost, as there are two access operations to the database: one to retrieve the source PID and one to retrieve the path cost with destination 15
With 50 being the default number of candidate peers in the BitTorrent P2P application.
3.5
3
25
Network Map Cost Map (Proactive) Cost Map (Reactive)
Cost Map−Extra time (Proact) Cost Map−Extra time (React)
20
Response time (sec)
Response time (sec)
2.5
2
1.5
15
10
1 5 0.5
0
0 10
20
30
40
50
60
Number of PIDs
(a)
70
80
90
100
10
20
30
40
50
60
70
80
90
100
Number of PIDs
(b)
Figure 7. (a) Response processing time for the Network and Cost Map (Absolute Distance) services and (b) processing time used to compute two additional steps (the number of hops and insert it into database).
PIDs. It is also necessary to point out that this mode does not have to spend time, i.e. 0 Sec (see Fig. 7(b), Proact) to compute two additional steps (the number of hops and insert them into the database), as they were previously processed. In the reactive mode, although it also has two access operations, the average processing time is just 0.07 Sec (see Fig. 7(a), React). This behavior can be explained by the fact that the path costs are only created for destinations PIDs of the HTTP request, namely, up to a maximum of 100 path costs. However, for the first request, the time it takes to execute the two additional steps must be considered; for instance, when we send 10 destination PIDs, the processing time is around 2.3 Sec (see Fig. 7(b), React). A particular case is when 62 and 92 destination PIDs are sent, we can see that it takes almost 0 Sec. This is because the selected destination PIDs already had the path cost created with the source PID, so no additional steps were needed. Eventually, when all possible path costs for a particular PID are already created, the response, the time should be in proportional to the number of destination PIDs, as shown in a proactive manner. Finally, the latency for obtained a response from AaaS can be eased either re-using cached Maps (at the risks of being out-of-date) or running servers in multiple domains through delegation of some ALTO information (e.g. Filtered Network and Cost Maps) to other subdomains. 5.3. Use Case Scenario We now try to assess the potential effectiveness of AaaS in delivers useful network information be so that an originating peer can make better decisions (in terms of network performance) regarding the candidate destination peers. Experimental Setup. The network model used is based on a small IXP ecosystem (see Fig. 8) consisting of 22 ASes, each represented by a switch abstraction in the Mininet emulator. A sample AS-Path summary file based on real BGP data was used to create the AS-level connectivity in our experiment topology.16 The large AS switch represents the 16
Another noteworthy contribution of our work is the Python-based code developed to generate ASlevel topologies for Mininet based on BGP data. The topologies can be used to emulate IXP ecosystems
Figure 8. The IXP-based testing network model and the Cost Map rankings based on the absolute and relative distance between ASes.
IXP and then 10 communicating peers are represented as Mininet hosts attached to the (AS abstraction) switches. Links between ASes follow the sample AS-Path attributes and were set with larger bandwidth and lower delay when closer to the IXP. In the case of ALTO information, the same AS-Path Summary file is used in order to build two Cost Maps based on the topological distance (absolute and relative) expressed as the number of hops between ASes (Fig. 8, Cost Map Rankings). Hosts that belong to ASes present at the IXP (ie., h1, h2, h3) were defined as ALTO clients, since the BGP data (and topology) is mostly meaningful from the IXP vantage point. Workload and Metrics. For each ALTO client (h1, h2, h3), we run end-to-end round-trip time measurements and available bandwidth with the remaining nine hosts using ping17 and iperf 18 tools, respectively. The main idea behind this workload is to emulate a client application (each host) trying to connect with candidate (one of nine possible) peer applications / content servers based on a random selection, and then, compare the obtained bandwidth and latency if the client had use the ALTO information to perform better-thanrandom peer selection through the use of the ALTO Cost Map ranking. We consider both an ideal scenario without traffic as well as another with a background traffic using the D-ITG traffic generator with randomly selected source and destination pairs send TCP traffic (512 byte packet size, 1,000 pps rate). Results Analysis. Overall, the results are encouraging as one may expect from applications being able to choose destination peers using ALTO information instead of a random peer selection. Applications with built-in module to evaluate the network performance from/to each candidate peer would correspond to the optimal choice from the application point of view. However, this may not be the best one regarding the network operator policies (e.g., avoid transit costs) and certainly not the simplest (extra code needed per based on AS-Path Summary files extracted from a LGs. Source code available at: https://github.com/intrigunicamp/IXP-Brazil-Mininet-Code 17 Average Round-trip time (ms) of 30 pings is computed. 18 Average TCP throughput (Kbps) in 20 Sec is computed.
HopsNumber HopsNumberPTT
30 20 10
7.40
7.40
6.10
6.10
6.90
7.12
0 −10 h1
h2
Hosts
(a) Latency using ping
h3
Normalized Network Bandwidth (%)
Normalized Network Latency (%)
40
40
HopsNumber HopsNumberPTT
30 19.89 19.89
20
11.79
10
6.88
6.88
5.97
0 −10 h1
h2
h3
Hosts
(b) Throughput using iperf
Figure 9. Latency and throughput gains (scenario with background traffic) of h1, h2 and h3 using AaaS Cost Map ranking based on an absolute distance (HopsNumber) and relative distance (HopsNumberPTT) metrics compared to random peer selection.
application) nor the quickest method (the application needs to assess all candidate destination IPs prior to connection setup). Figure 9 shows the normalized latency and bandwidth (as box plots with mean, quartiles, and max/min values) that an ALTO client would obtain when using the Cost Map ranking compared to a random selection approach (average values of 8 samples is used as baseline) in a scenario with background traffic. Without traffic, results are also positive, more expressive in terms of latency gains (see Table 4) compared to throughput improvements. Results show an improvement in latency (Fig. 9(a)) and throughput (Fig. 9(b)) of up to 29% could be achieved. In some cases, peers selected through AaaS may end up with slower bandwidth or higher latency (between 1% and 11%). This means that while reducing the total number of AS hops could result in significant performance improvements, shortest paths in the Internet are not always the best (e.g., due to congestion). However, this under-performance represents, on average, less than 25 percent of all cases. A comparison of performance between two proposed maps (Fig. 8, Cost Map Rankings) is also considered. For example, the Cost Map based on absolute distance (HopsNumber) suggests h3 (AS3) to seek out h5 (AS5), while the Cost Map based on relative distance (HopsNumberPTT) informs h3 (AS3) to connect to h1 (AS1). In both cases, performance improvements above 20% (latency and throughput) are obtained, yet when h3 uses the IXP infrastructure to select a peer (h1), as HopsNumberPTT suggests, further throughput improvements (up to 26%) and lower latency (up to 24%) can be obtained.
6. Related Work The work in [Khan et al. 2013] shows that it is possible to build the current view of the Internet AS-level topology from the BGP route announcement of AS by using the LG servers. The authors collected raw data from 245 LG servers across 110 countries and build the AS topology. The main lesson learned is that LG-based methods are less error prone than traditional traceroute-based ones, allowing raw data collection and building the AS topology more reliable.
Table 4. Network Latency (ms) in a scenario with no traffic expressed as RTT AVG and ±RTT MDEV.
h1 h1 h2 h3
— 120.5 (±0.3)
h2 120.5
h3 120.6
h4 160.6
h5 160.6
h6 180.5
h7 240.8
h8 300.7
h9 360.9
h10 401.0
(±0.4)
(±0.3)
(±0.5)
(±0.5)
(±0.7)
(±0.5)
(±0.8)
(±0.8)
(±1.0)
120.4
160.6
160.6
200.7
240.9
320.9
360.9
401.1
(±0.2)
(±0.4)
(±0.4)
(±0.3)
(±0.6)
(±0.7)
(±0.8)
(±0.6)
160.5
140.5
200.6
220.6
320.8
340.8
380.8
(±0.6)
(±0.4)
(±0.5)
(±0.4)
(±0.5)
(±0.4)
(±0.8)
—
120.5
120.5
(±0.4)
(±0.5)
—
As shown in Fig. 2(a), the ALTO architecture allows for external interfaces, so that third-parties may feed an ALTO server. The work in [Gurbani et al. 2014] demonstrates how outside parties can create network topology and cost maps for ALTO from public sources of information, specifically using the United States Federal Communications Commission (FCC) public database from the Measuring Broadband America (MBA) program. Similar efforts, e.g., [Pinthong and Lilakiatsakun 2013, Guanxiu et al. 2013] explore the ALTO protocol when mapping IP addresses to an AS to create a network map and BGP route announcements to create a cost. In the context of P2P, n-Tracker [Shibuya et al. 2011] has been proposed as an ISP-friendly approach based on an ALTO-like server to determine the ranking of candidate peers. Others P2P solutions ([Choffnes and Bustamante 2008, Xie et al. 2007]) provide a reliable network topology information to apply better-than-random peer selection, but not in the form of ALTO services.
7. Conclusions and Future Work To the best of our knowledge, this is the first work that explores the use of inter-domain routing data publicly available at IXPs to create abstract topology and cost maps following the recently standardized IETF ALTO protocol. Our proof-of-concept implementation is based on the popular Neo4j graph database and the OpenDaylight controller and validated the potential of applications (e.g., P2P clients or trackers, CDNs, SDN controllers) to leverage the network awareness provided by ALTO servers to optimize their decisionmaking regarding IP endpoint selection resulting better user experience. At the same time, ISPs and ALTO service providers (in our case IX.br operators) can benefit from increased, localized IXP traffic exchange. Our win-win proposal referred to as ALTO-as-a-Service is not free of limitations and there is a challenging amount of future work. Firstly, the AaaS workflow does not handle periodic updates (e.g. when a new dataset is retrieved) and, our Cost Map rankings are based only on relatively static AS-Path distance and do not consider more dynamic information such as actual bandwidth, latency, packet loss rate, etc. Thus, dynamic updates of cost maps based on public Internet quality measurements (e.g., SIMET Traffic Measurement System, RIPE TTM) are at the top of our research agenda. It is important to stress that while the ALTO protocol may provide dynamic network information, it is not intended to replace near-real-time congestion control protocols [Alimi et al. 2014]. In addition, solutions to potential resource saturation problems are being considered as future work activities, such as ALTO servers replying with round robin chosen versions
of the maps for equal cost paths to reduce the chances of multiple clients all choosing the same best destinations at once. The intersection of ALTO with SDN-controlled domains are also an avenue of ongoing investigation as a means to facilitate inter-domain traffic engineering and SDN east/west interfaces. Implementing the remaining ALTO services (e.g., full Map-Service, EPS and ECS) is another open task, which adds to a number of performance optimization opportunities of our prototype, most of them related to Neo4j query tuning techniques (e.g., DB indexes, heap size, garbage collection and Linux fs configuration).
References Alimi, R., Penno, R., Yang, Y., Kiesel, S., Previdi, S., Roome, W., Shalunov, S., and Woundy, R. (2014). Application-Layer Traffic Optimization (ALTO) Protocol. RFC 7285. Brito, S., Santos, M., Fontes, R., Lachos, D., and Rothenberg, C. (2015). Anatomia do Ecossistema de Pontos de Troca de Tr´afego Publicos na Internet do Brasil. In XXXIII Simp´osio Brasileiro de Redes de Computadores (SBRC). Vit´oria, ES, Brazil. Choffnes, D. R. and Bustamante, F. E. (2008). Taming the torrent: a practical approach to reducing cross-isp traffic in peer-to-peer systems. In ACM SIGCOMM Computer Communication Review, volume 38, pages 363–374. ACM. Guanxiu, L., Suqi, Y., and Xinli, H. (2013). A Novel ALTO Scheme for BitTorrent-Like P2P File Sharing Systems. In Proceedings of the 2013 Third International Conference on Intelligent System Design and Engineering Applications. Gurbani, V., Goergen, D., State, R., and Engel, T. (2014). Making historical connections: Building Application Layer Traffic Optimization (ALTO) network and cost maps from public broadband data. In Network and Service Management (CNSM), 2014 10th International Conference on. Khan, A., Kwon, T., Kim, H.-c., and Choi, Y. (2013). AS-level Topology Collection Through Looking Glass Servers. In Proceedings of the 2013 Conference on Internet Measurement Conference, IMC ’13, pages 235–242, New York, NY, USA. ACM. Madhukar, A. and Williamson, C. (2006). A longitudinal study of p2p traffic classification. In Modeling, Analysis, and Simulation of Computer and Telecommunication Systems (MASCOTS), pages 179–188. Neo4j (2015). The Neo4j Manual v2.3.0-M03. http://neo4j.com/docs/milestone/. Pinthong, N. and Lilakiatsakun, W. (2013). Performance of BitTorrent-like P2P file sharing systems inspired by ALTO. In TENCON IEEE Region 10 Conference (31194). Seedorf, J. and Burger, E. (2009). Application-Layer Traffic Optimization (ALTO) Problem Statement. RFC 5693. Shibuya, M., Hei, Y., and Ogishi, T. (2011). ISP-friendly peer selection mechanism with ALTO-like server. In Network Operations and Management Symposium (APNOMS). Xie, H., Krishnamurthy, A., Silberschatz, A., and Yang, Y. R. (2007). P4p: explicit communications for cooperative control between p2p and network providers. P4PWG Whitepaper, pages 1–7.