18
IEEE TRANSACTIONS ON MULTIMEDIA, VOL. 1, NO. 1, MARCH 1999
Dense Disparity Estimation with a Divide-and-Conquer Disparity Space Image Technique Chun-Jen Tsai and Aggelos K. Katsaggelos, Fellow, IEEE
Abstract— A new divide-and-conquer technique for disparity estimation is proposed in this paper. This technique performs feature matching following the high confidence first principle, starting with the strongest feature point in the stereo pair of scanlines. Once the first matching pair is established, the ordering constraint in disparity estimation allows the original intra-scanline matching problem to be divided into two smaller subproblems. Each subproblem can then be solved recursively until there is no reliable feature point within the subintervals. This technique is very efficient for dense disparity map estimation for stereo images with rich features. For general scenes, this technique can be paired up with the disparity-space image (DSI) technique to compute dense disparity maps with integrated occlusion detection. In this approach, the divide-and-conquer part of the algorithm handles the matching of stronger features and the DSI-based technique handles the matching of pixels in between feature points and the detection of occlusions. An extension to the standard disparity-space technique is also presented to compliment the divide-and-conquer algorithm. Experiments demonstrate the effectiveness of the proposed divide-and-conquer DSI algorithm. Index Terms—Depth map, disparity estimation, disparity-space image, divide-and-conquer stereo matching.
I. INTRODUCTION
D
ISPARITY estimation is one of the most fundamental problems in stereo image processing. It is also a crucial building block in many visual communication applications. For example, in multiocular video coding, disparity estimation is the key to spatial redundancy removal [1]–[3]. Disparity fields can be used to help image segmentation for object-based video processing and coding [4], [5]. As multiview video applications becoming popular, disparity estimation again plays an important role in virtual image synthesis [3], [6]. Given two images taken simultaneously with a pair of cameras, the goal of disparity estimation is to locate for each point in one image its corresponding point in the other image. and denote the left-channel and rightLet channel image functions. The solution to the correspondence and is a disparity field, , problem of Manuscript received September 3, 1998; revised November 19, 1998. This work was supported in part by a NATO grant. The associate editor coordinating the review of this paper and approving it for publication was Dr. Hong-Yuan Mark Liao. The authors are with the Department of Electrical and Computer Engineering, Northwestern University, Evanston, IL 60208 USA (e-mail:
[email protected];
[email protected]). Publisher Item Identifier S 1520-9210(99)01586-2.
such that (1) represents the pixel coordinate. The where defined in (1) is called the left-to-right disparity map disparity map. A right-to-left disparity map can be defined in a similar manner. The left-to-right disparity map is assumed throughout this paper without loss of generality. A lot of work has been done on the disparity estimation problem since the 1970’s [7]. The most often used criteria for matching are photometric similarity and spatial consistency. The photometric similarity criterion rises naturally from (1). The spatial consistency criterion confines the search space to piecewise smooth disparity fields. There are for many existing techniques for disparity estimation, including, block matching [8]–[11], regularization techniques [12]–[14], intrinsic curve transformation [15], and disparity-space image (DSI)-based techniques [3], [16]–[18]. To reduce the complexity of disparity estimation, the cameras are usually arranged in a parallel-axis configuration (or equivalently, the stereo image pair has been rectified using the camera geometry [16]). In this case, the stereo matching problem is simplified to an intra-scanline pixel matching problem. The DSI-based technique is of particular interest here because it incorporates occlusion models directly into the estimation process, while other techniques usually require an occlusion determination process after the estimation of the disparity field [11]. In addition, if a dense disparity field is desired, the DSI technique usually gives better performance. One problem with the DSI techniques is that it is sensitive to the occlusion penalty cost. To solve this problem, salient image features can be extracted to guide the matching process. For example, in [17], ground control points (GCP’s) are selected using several heuristic rules. However, in this approach, there is no specific order for the selection of GCP’s. Better performance can be expected if the stronger GCP’s in the two images are matched first so that some ambiguities in the matching of weaker GCP’s are eliminated. A divide-and-conquer technique for feature matching is proposed in this paper (some preliminary results are presented in [19]). This technique first establishes the matching of strong feature points. Because of the ordering constraint [17] in disparity estimation, these matching points divide the original intra-scanline matching problem into several smaller subproblems. These subproblems can be solved recursively,
1520–9210/99$10.00 1999 IEEE
TSAI AND KATSAGGELOS: DIVIDE-AND-CONQUER DISPARITY SPACE IMAGE TECHNIQUE
19
(a)
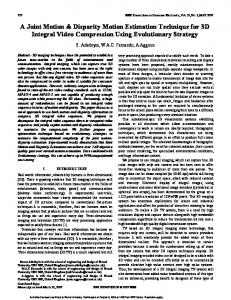
Fig. 2.
The ordering constraint.
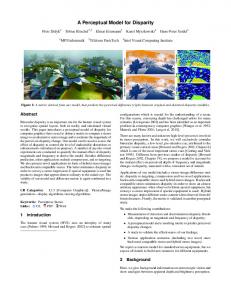
(b) Fig. 1. Scanline profiles from a pair of real stereo images. Cross marks in the profiles are some feature points with high confidence measure.
or via a DSI-based technique when there is no feature point in the subintervals. When used alone, the divide-and-conquer technique is very efficient for dense disparity estimation for stereo images with few occlusions, such as aerial images, as long as the images contain rich textures. For general purposes, we propose to combine this technique with an extended DSIbased technique to handle the subinterval matching problems, as well as occlusion detection. This paper is organized as follows. In Section II, the divideand-conquer matching algorithm is introduced. In this section, the ordering constraint that is used to formulate the intra-scanline pixel matching problem is first introduced. The algorithm for the proposed divide-and-conquer disparity estimation algorithm is then presented. Section III introduces the basic DSI technique and describes an extended-step DSI technique. The integration of the divide-and-conquer and DSI techniques is then proposed in this section. Experiments on both real and synthetic images are presented in Section IV, while conclusions are given in Section V. II. THE DIVIDE-AND-CONQUER MATCHING ALGORITHM A. Disparity Estimation and the Ordering Constraint Fig. 1 shows corresponding scanlines extracted from a pair of video conferencing stereo images. To create a dense disparity map, we have to perform pixel-wise matching between these two scanlines. Noise which results from image acquisition and sampling, differences in lighting, etc., inhibits perfect matching. Furthermore, some pixels in the left scanline have no match in the right scanline or vise versa due to occlusions. Even though disparity-space-based techniques handle these two problems (noise and occlusion) adequately, they usually produce many false occlusions in image areas with high intensity variance when the actual disparities are not uniform.
Fig. 3.
Violation of the ordering constraint.
Most of the stereo images obey the ordering constraint, which is illustrated in Figs. 2 and 3. In Fig. 2, if the projected is to the left of the projected image pixel in image pixel will be to the the left image, then the projected image pixel in the right image. Fig. 3 left of the projected image pixel shows an example when this constraint is violated. However, this case usually does not occur in practical situations, since is usually occluded in one of the images.
B. The Proposed Divide-and-Conquer Algorithm In the proposed algorithm, the ordering constraint is imposed explicitly. Referring to, for example, the scanline profiles in Fig. 1, the ordering constraint states that if is a matching pair, then any point to the right of can (see Fig. 4). only be matched to a point to the right of is a matching pair to the right of If, furthermore, , then the interval should be matched to the . Therefore, the establishment of matching pairs interval and divide the full intra-scanline matching problem into three subproblems: the intra-interval matching and and , and between intervals and , where is the last pixel in each scanline. The breakdown of a large problem into nonoverlapping subproblems fits the divide-and-conquer framework [20]. Assume that the problem is to perform intra-scanline matching between and . The algorithm is summarized as intervals follows.
20
IEEE TRANSACTIONS ON MULTIMEDIA, VOL. 1, NO. 1, MARCH 1999
Fig. 4. Breakdown of the scanline matching problem in Fig. 1 into two smaller subproblems using the ordering constraint.
Step 1: Compute the intensity variance at each pixel in . Pick the point with the largest intensity variance as the candidate feature point, denoted by . Step 2: Apply block matching to find the corresponding in the interval . Two feature point of measures are used to compute the reliability of the match. The first one is the signal-varianceto-matching-error ratio (SER) and the second one is the variance difference (VD) between the left feature point and the right feature point. They are defined, respectively, by SER and
(2) (3)
in (2) is the window used for matching where is the number of pixels in the window. and is too small or is too large, the If matching pair is considered unreliable. The pixel with the next highest variance is picked as the feature point and Step 2 is repeated at this new position. is Step 3: If a reliable matching feature pair and , the matching found, and is divided into between interval and two subproblems: the matching between and the matching between and . Each subproblem can be solved recursively, i.e., Step 1 is applied. Step 4: If there is no reliable matching feature pair between and , the disparity in can
be either obtained by linear interpolation of the disparity at and , or, it can be solved with a disparity-space-based technique. The application of linear interpolation produces a fast dense disparity estimation algorithm without occlusion detection, while the application of a disparity-based method enables the detection of occlusions. The above algorithm can be elegantly implemented in a recursive form. A critical issue regarding the performance of the divideand-conquer scheme is the establishment of reliable matching pairs, especially for the first few dividing iterations. If an erroneous matching pair is formed in the beginning, the error would affect the following feature matching process. Since this algorithm is based on greedy search, it suffers from the aperture problem when the target images have many repeating features (i.e., the one-dimensional (1-D) matching scanlines have a periodic structure). Therefore, larger thresholds should be used for reliability analysis during the matching stage. A global optimization algorithm like dynamic programming (DP) in DSI techniques can be incorporated into the divide-andconquer framework to resolve the matching of weaker features. As shown in the experiments, the combined algorithm works very well for natural scenes in general.
III. THE EXTENDED DISPARITY-SPACE TECHNIQUE A. Definitions The DSI is the intra-scanline matching error image [17]. There are two different types of DSI’s. The first type of DSI’s has the indices of the left image scanline on the -axis and the indices of the right image scanline on the -axis. The matching
TSAI AND KATSAGGELOS: DIVIDE-AND-CONQUER DISPARITY SPACE IMAGE TECHNIQUE
Fig. 7. Computation of the cost matrix entry at position Fig. 5. Example of disparity-space image using xL –xR axes.
21
p.
( is the width of the images). The intra-scanline matching problem is solved in this space by finding a path that starts at the first column and ends at the last column. B. The Extended Disparity-Space Algorithm
Fig. 6.
Example of disparity-space image using x-d axes.
error image is defined for scanline
as follows:
(4) is the matching window size. An example of this where type of DSI is shown in Fig. 5. The estimation of disparity between these two scanlines is equivalent to finding a path across a DSI starting at the lower-left corner and ending at the upper-right corner which has the smallest cost. In [16], a feature-based two-dimensional (2-D) search plane was coupled with DP for sparse depth map estimation. Later, this 2-D search space was directly used for intensity-based matching algorithm for dense disparity map estimation [18], [22]. They all used this type of DSI. The second type of DSI has been used for disparity estimation [17], [21]. In this type of DSI, the -axis contains the indices to the pixel positions on the left scanline and the -axis the disparity values. The matching error image is defined for scanline as follows:
(5) An example of this type of DSI is shown in Fig. 6. In this disparity-space image, the searching range for (horizontal) and . For row in the disparities is set to between are the valid pixel DSI, positions along the scanline that may have the disparity value
In this paper, the first type of DSI is used. Given a DSI, the matching path can be found using DP techniques. DP is similar to divide-and-conquer in that they both try to solve a large problem by attacking many smaller subproblems. However, divide-and-conquer starts from the top, breaks the large problem into many subproblems and solves these subproblems independently. On the other hand, DP starts with solving all the possible subproblems, and stores the answers away to be used later in solving larger problems. Two properties must be satisfied in any application of DP. The first property is that it is possible to combine the solutions of smaller problems to form the solution of a larger one, and the second is that the number of small problems to be solved has to be reasonably small. To reduce the search space, the solution path is usually confined so that it is composed of only three transition step types, namely, left occlusion step, match step, and right occlusion step. To find the minimal-cost path using DP, . The the first stage is to compute a cost matrix computation is performed from the lower-left corner of the DSI to the upper-right corner of the DSI. At each entry (node) in the cost matrix, the three above-mentioned steps that may lead to this node are considered. For example, if the computation reaches node (see Fig. 7), the cost at node is determined by first computing the costs for match step, right occlusion step, and left occlusion step using the following functions. • Match step. If there is no change in disparity in the left , a diagonal scanline from position to position match step occurs. The cost at node is equal to
where is the disparity-space image, i.e., the matching error image. • Right occlusion step. If an occlusion happens in the right scanline (the pixel in the left scanline is not visible in the right scanline), a horizontal occlusion step takes place . The cost is between column and column
where is a constant penalty cost for occlusion. This cost is usually determined empirically.
22
IEEE TRANSACTIONS ON MULTIMEDIA, VOL. 1, NO. 1, MARCH 1999
Fig. 8. Extended step model for disparity-space technique.
• Left occlusion step. If an occlusion happens in the left scanline, a vertical occlusion step happens at column . The cost at position is then computed via
The cost at is then chosen as the smallest one among , and , that is (6) The DP algorithm is composed of two stages. The first stage computes the cost matrix starting at the lower-left corner of the DSI and progressing toward the upper-right corner of the DSI using (6). While computing the cost matrix, the algorithm also records the step type that leads to the minimal cost at each node in an index matrix. The second stage then traces back the minimal cost path from the upper-right corner to the lower-left corner using this index matrix. The simple step model mentioned above tends to produce misdetected occlusions in an area with nonuniform disparity. More sophisticated step models have been proposed [21], [22] to resolve the conflict between occlusion and nonuniform disparity. However, these new models introduce more cost parameters that are determined empirically and are usually data sensitive. In this paper, we propose an extended step model which does not introduce extra cost parameters. In Fig. 8, five possible steps (instead of three) are considered during the cost , and are defined as before. evaluation. The steps and allows for The introduction of the two new steps the path to model nonuniform disparity properly. According to Fig. 8, the cost function is now defined by
(7)
is the fixed occlusion cost, and , where and are pixel coordinates. The definition of the cost terms for the new steps are based on the linear interpolation of the is assumed, the algorithm tries to matching error images. If
Fig. 9. Disparity-space image before the application of the divide-and-conquer algorithm. The intensity profile for the left scanline is shown below the image, while the profile for the right scanline is shown to the right-hand side of the image.
Fig. 10. Same image as in Fig. 9 after the divide-and-conquer algorithm. The estimated disparity path from the dynamic programming algorithm is also shown in the image.
match a two-pixel interval in the right scanline to a three-pixel interval in the left scanline. This means that the underlying three-dimensional (3-D) object is a slanted object with respect to the camera image plane. The disparity at pixel position (see Fig. 8) is filled in with the average of the disparities at and at . Therefore, this model produces a disparity map with subpixel accuracy without major modification to the DP algorithm and the extra computational cost is negligible.
TSAI AND KATSAGGELOS: DIVIDE-AND-CONQUER DISPARITY SPACE IMAGE TECHNIQUE
(a) Fig. 11.
23
(b) (a) Left and (b) right frames from the “man” stereo image sequence.
C. The Hybrid Divide-and-Conquer DSI Technique As mentioned before, the divide-and-conquer algorithm can be used to split the full intra-scanline matching problem into nonoverlapping smaller subproblems. In each subproblem, there is no reliable matching feature between the left and the right scanlines, possibly due to occlusions or lack of texture information. If the goal of the estimator is to obtain a fast estimate of the disparity map, where accuracy and occlusion detection are less important, linear interpolation can be used to establish the intra-scanline matching subproblem. If, however, occlusion detection is required, a disparity-space-based technique is a good choice for solving the subproblem. After the divide-and-conquer stage of the algorithm, the DSI search space is greatly reduced, which facilitates the use of the DP algorithm. A pair of disparity-space images before and after the divide-and-conquer algorithm is shown in Figs. 9 and 10. The major advantage of the combined divide-and-conquer DSI approach is that it is less sensitive to image data. The performance of the DSI technique depends heavily on the occlusion cost used. Without the divide-and-conquer stage of the proposed method, matching errors occurred in the earlier steps of the DP algorithm can corrupt the whole optimal path. With the landmark points set by the divide-and-conquer stage, the matching error will not propagate. In addition, since the optimal path is forced to pass through the landmark points, some ambiguous local minimal steps introduced by the simplified step model and the choice of the occlusion cost can be eliminated. The major difference between the proposed approach and the GCP approach in [17] is that the selection of the landmarks are done in an order according to the reliability of the match. The matching of highly reliable landmarks are established before the less reliable landmarks are processed. Another advantage of the divide-and-conquer algorithm is that it segments the scanlines into subintervals based on the intensity content. It separates the texture-less regions (e.g., background) from the texture-rich regions (e.g., foreground). This information could be coupled with different prior 3-D
models and adaptive occlusion costs to further improve the performance of the DSI algorithm. IV. EXPERIMENTS First, three stereo image pairs with different degree of texture contents are used to evaluate the performance of the proposed algorithm. These images include a video conferencing scene with low texture content, an aerial image pair with medium texture content, and an image pair of an aquarium full of textures. Experiments on these images show the insensitivity of the parameters in the proposed divide-and-conquer DSI algorithm to image data. There are four parameters in the proposed algorithm, namely, VARIANCE_THRESHOLD, SER_THRESHOLD, . These parameters are VD_THRESHOLD, and selected empirically. However, the same set of parameters , SER_THRESHOLD (VARIANCE_THRESHOLD , VD_THRESHOLD , and ) are used for all the experiments conducted in this section. In addition, the block matching window size for the divide-and13 and the window size conquer algorithm is fixed to 13 5. [ in (4)] for the DSI computations is 5 The first stereo image pair comes from the video conferencing sequence “man,” as shown in Fig. 11. The size of the 193 pixels. Comparisons of the estimated images is 193 disparity maps using the basic DSI algorithm (as described in Section III-B), the algorithm in [22], the extended step model DSI, and the proposed divide-and-conquer DSI algorithm are shown, respectively, in Figs. 12–15. In these disparity maps, a bright pixel represents an object point that is far away from the cameras, while a dark pixel represents an object point that is close to the camera. Histogram equalization is used to enhance the contrast of the disparity maps for visualization purposes. The brightest pixels in each image are occlusions detected by the programs. By comparing the results in Figs. 12–15, one can see that the basic DSI algorithm does not handle the background area
24
Fig. 12. Disparity map estimated with the basic DSI algorithm. Brightest pixels are detected occlusions.
Fig. 13. Disparity map estimated with the modified disparity-space algorithm in [22].
well. In Fig. 12, the uniform background area contains many misdetected occlusions. The reason for these misdetections is that the simplified model implicitly assumes that the scene is composed of areas with uniform disparity and occlusion areas (see [22] for details). For example, if the algorithm decides that a 100-pixel area in the left scanline is a match to a 70-pixel area in the right scanline, it will force 30 pixels of occlusion into the left-to-right disparity map for that scanline. If occlusion detection is not required, one may choose to fill these possibly false occlusion pixels with disparities using linear interpolation. In Fig. 13, a sophisticated step model and a cost function that takes into account both first-order and second-order smoothness are used. A total of eight parameters in the algorithm control the resolution, accuracy, and smoothness of the estimated disparity map. The problem of misdetection of occlusions is less severe here, but it still gives rough disparities in the uniform background. The disparity map estimated by
IEEE TRANSACTIONS ON MULTIMEDIA, VOL. 1, NO. 1, MARCH 1999
Fig. 14. Disparity map estimated with the extended-step disparity-space algorithm alone.
Fig. 15. Disparity map estimated with the divide-and-conquer disparity-space algorithm.
the proposed extended DSI algorithm (without the divideand-conquer stage) is shown in Fig. 14. The disparities in the background are very smooth from this algorithm, and the foreground disparities are very clean with proper detection of occlusions. However, in the lower part of the image (around the person’s chin), the matching error in the background is propagated into the foreground and undermines the estimation of disparity on the person’s face area. On the other hand, the proposed divide-and-conquer algorithm clearly separates the foreground from the background and does not suffer from the lack of texture in the background. Notice how the matching information introduced by the divide-and-conquer algorithm (Fig. 15) helps remove the mismatch from the DP matching algorithm (the bright horizontal line across the chin in Fig. 14). In the second experiment, the “pentagon” stereo aerial image 512 pair is used (Fig. 16). The size of the images is 512 pixels. The estimated disparity maps using the basic disparity-
TSAI AND KATSAGGELOS: DIVIDE-AND-CONQUER DISPARITY SPACE IMAGE TECHNIQUE
(a) Fig. 16.
25
(b) (a) Left and (b) right frames from the “pentagon” stereo image pair.
(a)
(b)
Fig. 17. (a) Disparity map from the basic DSI algorithm. (b) Disparity map from the proposed algorithm. Note that the basic DSI tends to give false detection at intensity boundaries.
space algorithm and the proposed divide-and-conquer DSI algorithm are shown in Fig. 17. From Fig. 17, one can easily see that the proposed algorithm provides considerably more details in the surrounding area of the building. A 3-D rendering of the disparity map using the proposed algorithm is shown in Fig. 18. The “aqua” image sequence (Fig. 19) is used for the third experiment. The size of the images is 352 288 pixels. The estimated disparity maps using the basic DSI algorithm and the proposed divide-and-conquer DSI algorithm are shown in
Fig. 20. From these figures, one can observe that the quality of the disparity map in the latter case is better in detail. One see more structure in the coral, the largest fish, and the background using the proposed algorithm. On the other hand, it seems that the basic algorithm does a better job in occlusion detection for this image pair in many regions while it gives false occlusions in some regions. The main differences between these two algorithms on occlusion detection are that the basic algorithm tends to declare occlusion in textureless areas, while the proposed
26
IEEE TRANSACTIONS ON MULTIMEDIA, VOL. 1, NO. 1, MARCH 1999
Fig. 18.
Three-dimensional model reconstructed using the disparity map from the proposed algorithm.
(a) Fig. 19.
(b) (a) Left and (b) right frames from the “aqua” stereo image sequence.
algorithm tends to treat textureless areas as regions projected from slanted 3-D objects, i.e., areas with smoothly varying disparities. For applications in visual communications, multiview image generation in particular, the proposed algorithm is preferred because the disparities in all occluded areas have to be interpolated based on neighboring disparities and some prior assumptions on the 3-D models. In addition to the problem with slanted objects, the basic algorithm usually detects false occlusions on intensity boundaries where the matching errors (i.e., DSI costs) are usually higher than what might give the occlusion step a chance to take over when there is actually no occlusion. To demonstrate these situations, a pair of simulated stereo images (Fig. 21) are used to test the algorithms. There are three objects in the images: a sphere in the center, a slanted plane in the lower-right corner, and a flat background parallel to the camera image plane. The
estimated disparity maps are shown in Fig. 22. This figure shows that the basic algorithm detects a large number of false occlusions, while the proposed algorithm has a considerably better performance. As a reference, the computation time for disparity estimation on the real stereo images on a Pentium 166 MMX machine running Linux operating system is listed in Table I. V. CONCLUSION We have presented a two-level dense disparity estimation algorithm. The top level uses a divide-and-conquer algorithm for salient feature matching, while the bottom level uses a disparity-space technique to perform local matching and occlusion detection. As the experiments show, the proposed technique works very well for both low-feature scenes from
TSAI AND KATSAGGELOS: DIVIDE-AND-CONQUER DISPARITY SPACE IMAGE TECHNIQUE
27
(a)
(b) Fig. 20.
(a) Disparity map from the basic disparity-space algorithm. (b) Disparity map from the proposed algorithm.
video conferencing sequences and complex scenes from natural scenic image sequences. Other disparity estimation algorithms usually require fine-tuning of parameters for different type of images to get good results. The proposed algorithm on
the other hand has low sensitivity to the control parameters. Another advantage of the divide-and-conquer DSI algorithm is that the divide-and-conquer stage of the algorithm segments the scanlines into subintervals based on the intensity contents
28
IEEE TRANSACTIONS ON MULTIMEDIA, VOL. 1, NO. 1, MARCH 1999
(a)
(b)
Fig. 21. (a) Left and (b) right frames from the synthesized stereo image pair.
(a)
(b)
Fig. 22. (a) Disparity map from the basic disparity-space algorithm. (b) Disparity map from the proposed algorithm. The parameters used here are the same as the parameters for all other experiments. TABLE I COMPUTATION TIME FOR DIFFERENT IMAGES
prior 3-D models for better estimation of the disparity fields. We are investigating the application of adaptive disparityspace matching algorithm, as well as the incorporation of inter-scanline matching into the proposed algorithm to further improve the performance. ACKNOWLEDGMENT
automatically. This information can be used to separate texture-less regions (e.g., background) from texture-rich regions (e.g., foreground) and can be used with different
The authors would like to thank A. Redert from the Delft Institute of Technology, Delft, The Netherlands, for many insightful discussions and generating the synthetic image pair.
TSAI AND KATSAGGELOS: DIVIDE-AND-CONQUER DISPARITY SPACE IMAGE TECHNIQUE
REFERENCES [1] S. N. Efstratiadis, D. Tull, A. K. Katsaggelos, and M. G. Strintzis, “Motion predictive disparity compensated analysis of stereoscopic video,” in Proc. Int. Workshop Stereoscopic and Three Dimensional Imaging, Santorini, Greece, Sept. 1995, pp. 140–148. [2] A. Tamtaoui and C. Labit, “Constrained disparity and motion estimators for 3DTV image sequence coding,” Signal Process.: Image Commun., vol. 4, no. 1, pp. 45–54, Nov. 1991. [3] N. Grammalidis and M. G. Strintzis, “Disparity and occlusion estimation in multiocular systems and their coding for the communication of multiview image sequences,” IEEE Trans. Circuits Syst. Video Technol., vol. 8, pp. 328–344, June 1998. [4] D. Tzovaras, N. Grammalidis, and M. G. Strintzis, “3-D motion/disparity segmentation for object-based image sequence coding,” Opt. Eng., special issue on Visual Communication and Image Processing, vol. 35, pp. 137–145, Jan. 1996. [5] T. Naemura, M. Kaneko, and H. Harashima, “3-D object based coding of multi-view images,” in Proc. Picture Coding Symp.’96, Mar. 1996, pp. 459–464. [6] J. S. McVeigh, M. W. Siegell, and A. G. Jordan, “Intermediate view synthesis considering occluded and ambiguously referenced image regions,” Signal Process.: Image Commun., pp. 21–28, 1996. [7] R. M. Haralick and L. G. Shapiro, “Image matching,” in Computer and Robot Vision Reading, MA: Addison-Wesley, 1993, vol. II, ch. 16. [8] M. J. Hannah, “Computer matching of areas in stereo images,” Ph.D. dissertation, Rep. STAN-CS-74-483, Stanford Univ., Stanford, CA, 1974. [9] M. Bierling, “Displacement estimation by hierarchical block-matching,” in Proc. SPIE Conf. Visual Communication and Image Processing, Nov. 1988, vol. 1001, pp. 942–951. [10] M. Accame, F. G. B. De Natale, and D. D. Giusto, “Hierarchical block matching for disparity estimation in stereo sequences,” in Proc. ICIP’95, Oct. 1995, vol. II, pp. 374–377. [11] E. Izquierdo, “Stereo matching for enhanced telepresence in 3Dvideocommunications,” IEEE Trans. Circuits Syst. Video Technol., Special Issue on Multimedia Technology, Systems and Applications, vol. 7, pp. 629–643, Aug. 1997. [12] D. Terzopoulos, “Regularization of inverse visual problems involving discontinuities,” IEEE Trans. Pattern Anal. Machine Intell., vol. PAMI8, pp. 413–423, July 1986. [13] R. Mar., “Computation of stereo disparity using regularization,” Pattern Recognit. Lett., vol. 8, pp. 181–187, 1988. [14] L. Robert and R. Deriche, “Dense depth map construction using a multiscale regularization approach which preserves discontinuities,” in Proc. Int. Workshop Stereoscopic and Three Dimensional Imaging (IWS3DI), Santorini, Greece, 1995, pp. 229–234. [15] C. Tomasi and R. Manduchi, “Stereo matching as a nearest-neighbor problem,” IEEE Trans. Pattern Anal. Machine Intell., vol. 20, Mar. 1998.
29
[16] Y. Ohta and T. Kanade, “Stereo by intra- and inter-scanline search using dynamic programming,” IEEE Trans. Pattern Anal. Machine Intell., vol. PAMI-7, Mar. 1985. [17] S. S. Intille and A. F. Bobick, “Disparity-space images and large occlusion stereo,” in Proc. ECCV’94, Stockholm, Sweden, 1994, pp. 179–186. [18] I. J. Cox, S. L. Hingorani, and S. B. Rao, “A maximum likelihood stereo algorithm,” Comput. Vis. Image Understand., vol. 63, no. 3, pp. 542–567, Apr. 1996. [19] C.-J. Tsai and A. K. Katsaggelos, “Dense disparity map estimation via global and local matching,” in Proc. Noblesse Workshop on Non-Linear Model Based Image Analysis, Glasgow, Scotland, July 1–3, 1998, pp. 289–294. [20] R. Sedgewick, Algorithms, 2nd ed. Reading, MA: Addison-Wesley, 1988. [21] L. Falkenhagen, “Disparity estimation from stereo image pairs assuming piecewise continuous surfaces,” in Image Processing for Broadcast and Video Production, Y. Paker and S. Wilbur, Eds. London, U.K.: Springer, 1994. [22] A. Redert, C.-J. Tsai, E. Hendriks, and A. K. Katsaggelos, “Disparity estimation with modeling of occlusion and object orientation,” in Proc. SPIE Visual Communication and Image Processing, San Jose, CA, Jan. 1998, pp. 798–808.
Chun-Jen Tsai received the B.S. degree in mathematics from Fu-Jen Catholic University, Taiwan, R.O.C., in 1989, and the M.S. degree in computer science and information engineering from National Taiwan University, Taipei, in 1992, and the Ph.D. degree in electrical engineering from Northwestern University, Evanston, IL, in 1998. In 1992, he became a Research Assistant at the Institute of Information Science, Academia Sinica, Taiwan. He was a Visiting Scientist in the Telecommunications Institute, University of Erlangen-Nuremberg, Erlangen, Germany, from November 1996 through January 1997. He is currently a Post-doctoral Research Fellow, Department of Electrical and Computer Engineering, Northwestern University. His major research interests are in motion and disparity estimation in video sequences, surface reconstruction with passive sensors, depth-from-defocus, target tracking, multi-view image generation, and compressed video restoration and enhancement.
Aggelos K. Katsaggelos (M’85–SM’92–F’98), for a photograph and biography, see this issue, p. 17.