Density Estimation and Visualization for Data containing Clusters of unknown Structure. Alfred Ultsch. Databionics Research Group,. University of Marburg,.
Density Estimation and Visualization for Data containing Clusters of unknown Structure Alfred Ultsch Databionics Research Group, University of Marburg, 35032 Marburg, Germany
Abstract. A method for measuring the density of data sets that contain an unknown number of clusters of unknown sizes is proposed. This method, called Pareto Density Estimation (PDE), uses hyper spheres to estimate data density. The radius of the hyper spheres is derived from information optimal sets. PDE leads to a tool for the visualization of probability density distributions of variables (PDEplot). For Gaussian mixture data this is an optimal empirical density estimation. A new kind of visualization of the density structure of high dimensional data set, the P-Matrix is defined. The P-Matrix for a 79- dimensional data set from DNA array analysis is shown. The P-Matrix reveals local concentrations of data points representing similar gene expressions. The P-Matrix is also a very effective tool in the detection of clusters and outliers in data sets.
1
Introduction
To identify clusters in a data set it is sometimes not enough to consider distances between the data points. Consider, for example, the TwoDiamonds data set depicted in Figure ??. The data consists of two clusters of two dimensional points. Inside each ”diamond” the values for each data point were drawn independently from uniform distributions. At the central region, marked with an arrow circle in Figure ??, the distances between the data 1 0.8 0.6 0.4 0.2 0 −0.2 −0.4 −0.6 −0.8 −1
0
0.5
1
1.5
2
2.5
3
Fig. 1. The TwoDiamonds data set
3.5
4
2
Ultsch
points are very small. For distance based cluster algorithms it is hard to detect correct boundaries for the clusters. Distance oriented clustering methods such as single linkage, complete linkage, Ward etc. produce classification errors. The picture changes, however, when the data’s density is regarded. The density at the touching point of the two diamonds is only half as big as the densities in the center regions of the clusters. This information may be used for a clustering of the data. Density based clustering algorithms have drawn much attention in the last years within the context of data mining, see for example (Xu et al (1998), Hinneburg (1998)). These algorithms call for methods to estimate the density of the data. In this paper we propose a method for density estimation that is optimal in an information theoretic sense. Furthermore we propose a one dimensional plot for empirical probability density and a method to visualize high dimensional density distributions.
2
Information optimal sets, Pareto Radius, PDE
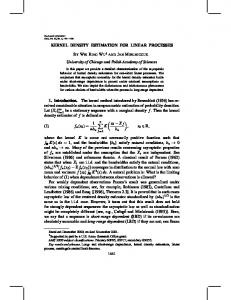
Let S be a subset of a set of points and p denote the probability that a point belongs to S. The information of the set S can be calculated using Shannon’s formula for information. Scaled to the range [0,1], the information of a set I(S) is calculated as I(S) = - e p ln (p). An information optimal set is minimal in size but contains as much information as possible. To find such an optimal set size, define the unrealized potential U RP (S) of a set S as the Euclidian distance from the ideal point to (p, I(S)) of a given set. The ideal point (0,1) corresponds to a minimal set size producing 100% of information. Minimizing the unrealized potential U RP results in an optimal set with pu =20.13%. This set size produces 88% information. Subsets of the relative size p u are called information optimal. The optimality of this set at about (20%, 80%) can serve as an explanation for the so called Pareto 80/20 law, which is empirically found in many domains. Let d(xi , xj ) be a dissimilarity measure defined on the set E = x1 , ..., xd of collected data. N (x, r) = |{xi ∈ E | d(x, xi ) ≤ r}| is the number of points inside a sphere of radius r around x. The Pareto Radius rp is a radius such that the median of the spheres around all data points is information optimal, i.e.: median(N (xi , rp )) = pu · d. This means the spheres contain in the average information optimal sets. If a data set contains cluster, the Pareto Radius should be information optimal for each cluster. Let v(k) denote the ratio of intra cluster distances to inter distances for k clusters in the data set. Then the optimal Pareto Radius is rp (k) = v(k) · rp . In Ultsch (2003) an estimation procedure for v(k) is described. The results of a large simulation study to find v(k) is shown in Figure ??. For a given number k of clusters the circles give the mean of v(k). The bordering lines indicate the interval in which v(k) could be found with 95% probability. If the number of clusters k is known, v(k) can be estimated as the mean in Figure ??. If k is unknown, v = 1/3 covers the 95% confidence interval for 3 up to 13 clusters. For only one or two clusters, v(2) = 0.7 is a
PDEplot
3
good estimate. If the minimum number of cluster in a data set can be estimated, the lower bound of the 95% confidence interval is a good choice for v. From Figure ?? it can also be seen that all v < 1/3 cover a broad range of possible cluster numbers. Thus a rough estimate of the cluster number k is sufficient for the calculation of a suitable Pareto Radius. The calculation of a Pareto Radius for large data sets can be optimized by concentrating on the percentiles of distances. The Pareto Percentile pcpar is then the percentile of all distances closest to the Pareto Radius. As cluster corrected Pareto Radius the distance percentile closest to v(k) · pcpar is used. An empirical density estimation at a point x for data sets containing clusters is the number of points inside the sphere around x with radius rp (k). This density estimation is called Pareto Density Estimation (PDE).
o = mean and 95% confidence interval for v(k)
1 0.9
v(k) = ratio inner/inter cluster distances
0.8 0.7 0.6 0.5 0.4 0.3 0.2 0.1 0
0
5
10
15 20 25 k = number of clusters
30
35
Fig. 2. Estimation of the ratio of intra/inter cluster distances
40
4
3
Ultsch
PDE in one dimension: PDEplot
For one dimensional data a probability density estimation can be calculated from PDE. NN(x, rp ) PPDE(x) = area
Z∞
where area is
NN(x, rp )dx
(1)
−∞
The denominator ’area’ is approximated using the trapezoidal method on (xi, NN(xi, rp)). The formula (??) assures that the integral on PPDEplot(x) is equal to 1 to get a valid probability density function. Plotting PPDE(x) against x is the PDEplot. PDEplots can be used for a closer look on distributions. In DNA microarray eyperiments using high density oligonucleotide arrays, such as the Affymetrics gene chip, it is important to visualize the distributions of gene exression rates (Parmigiani et al. (2003)). Gentleman and Carry implemented software, the so called ”Expression Density Diagnostics”, to compare empirical distributions to a given set of model distribution (Gentleman and Carry. (2003)). Their probability density visualization allows, however, hardly a distinction between the presumably different distributions (see Gentleman and Carry. (2003), p. 70, Figure 2.7). Figure ?? shows a PPDE plot of an Affymetrix data set of 124222 gene expressions for 7 liver and 7 brain cells of mice. The figure shows, that a decision for the origin of the cells (liver vs brain) can be based only on the different distributions. In histograms this is hardly seen. To find gene expression that differenciate brain vs. liver, the two different PDEplot of maus data
Pareto Density Estimation (PDE)
0.25
0.2
0.15
0.1
0.05
0
3
4
5
6
7 8 9 dashed = brain, solid = liver
10
11
12
13
Fig. 3. PDEplot of DNA microarray data of liver and brain
PDEplot
5
distributions have to be adapted carefully. PDEplots allow to judge the quality of such adaptations. In this way PDE contribute to a successful search for differential expressed genes in DNA microarray experiments.
4
Measuring and Visualization of density of high dimensional data
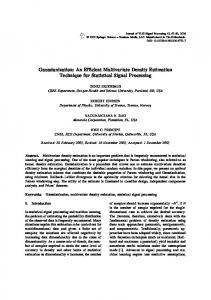
We used PDE on a data set of 1000 points with 120 variables. The variables describe molecules by the number of different atom types (Ghose and Crippen (1986)). It was known that there were at least five clusters in the data set. The Pareto Radius obtained for this data set was rp (k) = 3.6. Figure ?? shows the Pareto Radius compared to hypersphere density estimations using other radii. It can be seen that for a large radius the density estimation oversmoothes the true density distribution. No structural information can be gained from such a density estimation. For a small radus e.g. r = 2 many of the spheres are empty. The density estimation with the Pareto Radius shows the most structural features of the data set. A large number of points, presumably inside a cluster have a comparably large density (around 250 points in the sphere). Then the density estimation drops to below 100 points for thinner regions of the data set. For all density estimations with hyperspheres this structural feature can be seen best when the Pareto Radius is used. Emergent SOM (ESOM) construct a nonlinear, topology preserv-
600 r= 5
number of points in spere
500
400
r= 4.5
300
r= 4
r= 3.5 200 r= 3 100 r= 2.5 0
r= 2 0
100
200
300
400 500 600 data points, dashed = PDE
700
800
900
1000
Fig. 4. Hypershere density estimation with different radii
ing mapping from high dimensional spaces to two dimensional grids (the map space)(Kohonen (1989)). A U-Matrix can be constructed on the map
6
Ultsch
space (Ultsch (2003c)). A U-Matrix displays the local dissimilarity between data points or interpolating points. The same map space can also be used for the display of density relationships. The PDE can be measured for each weight vector of a neuron on the map space. This gives a local density estimation in the input space. The display of these PDE measures as height values on top of the map space is a visualization of the density relationshios in the high dimensional space. The properties of the SOM algorithm guarantee that local and global distance relationships between data points are appropriately represented on the map space. Such a display has been called a P-Matrix (Ultsch (2003c)). Figure ?? shows a P-matrix of Eisen’s Yeast
Fig. 5. P-Matrix of DNA microarray data
data (Eisen et al 1998). The data set contains 2465 data points of 2465 gene expressions of yeast of dimension 79. The data is available from the web site ”http://www-genome.stanford.edu”. On the P-Matrix it can be seen that a substantial subset of the data points are mapped to locations where there is a big concentration of points. Compare the dark regions in Figure ??. There, the neighborhood numbers are around 400. Other regions, distant from the first have also a local density maximum of more than 250. This points to possible cluster structures. Some regions on the ESOM are also very underpopulated. This is an indication for ”outliers”, i.e. singular special situations in the data set. P-Matrices can also be used to enhance the visibility of cluster borders in a U-Matrix and to detect clusters in data sets. Figure ?? b shows a so called U*-Matrix which is the combination of a U-Matrix and a P-matrix (Ultsch 2003b) in comparison to the display published by Kaski et al (1998) on the same data set. Centering a SOM mapping on the point with highest
PDEplot
7
(a) Kaski (1998)
(b) U*-Matrix Fig. 6. Displays of Yeast data
PDE results in a canonical view for SOM with borderless map space such as toroids (Ultsch (2003c)).
5
Summary
One of the goals of data mining is to discover clusters in empirical data. Distances are a prerequisite for the detection of clusters, but sometimes not enough for an automatic clustering. Data density is an alternative viewpoint on the data. Density considerations lead often to better cluster definition. The combination of both methods is hardly attempted. In this work a method for an efficient measurement of data density is presented. Pareto Density Estimation (PDE) is a method for the estimation of density functions using hyper spheres. The radius of the hyper spheres is derived from information optimal sets. The construction of the PDE from an empirical data set takes in particular into account that there might be an unknown number of clusters of
8
Ultsch
also unknown size in the set. Starting at an educated guess, the information on clusters discovered during the process of data mining can be employed in the method. A tool for the visualization of probability density distributions of variables, the PDEplot is defined. The usefulness of this tool is demonstrated on DNA array data. The visualization guides the search for better models for empirical distributions for this type of data. The usage of PDE to visualize the density relationships of high dimensional data sets leads to so called P-Matrices which are defined on the mapping space of emergent self-organizing maps (ESOM). A P-Matrix for a 79-dimensional DNA array data set is shown. The ESOM mapping preserves the data’s topology. The P-Matrix reveals local concentrations of data points. This is a very useful tool in the detection of clusters and outliers in unknown data sets. Pareto Density Estimation, PDEplots for one dimensional data and the construction of P-matrices for high dimensional data have been implemented as MATLAB routines. These routines may be obtained from the author (http://www.mathematik.uni-marburg.de/ databionics/).
References EISEN M, SPELLMAN,P., BROWN,P.O., BOTSTEIN,D. (1998): Cluster analysis and display of genome-wide expression patterns. Proceedings of the National Academy of Sciences of the United States of America, 95, 14863-14868. GENLEMAN,R. and CAREY,V.(2003): Visualization and Annotation of Genomic Experiments. In: PARMIGIANI, G., et al. (Eds): The Analysis of Gene Expression Data. Springer, New York, 46-72. GHOSE, A.K. and CRIPPEN,G. M.(1986): Atomic Physicochemical Parameters for Three-Dimensional Structure-Directed Quantitative Structure-Activity. J. Comput. Chem., 7, 565-577. HINNEBURG, A: KEIM,D.A.(1998): An Efficient Approach to Clustering in Large Multimedia Databases with Noise. Proc. 4rd Int. Conf. on Knowledge Discovery and Data Mining, AAAI Press. KASKI,S., NIKKILA,J., KOHONEN,T. (1998): Methods for interpreting a selforganized map in data analysis. In Proc. 6th European Symposium on Artificial Neural Networks, Brugges, Belgium. PARMIGIANI, G., et al.(2003): The Analysis of Gene Expression Data, Springer, New York. ULTSCH,A. (2003): Pareto Density Estimation: A Density Estimation for Knowledge Discovery. In: Proc. GfKLConf. Cottbus, Springer Berlin. ULTSCH,A.(2003b): U*Clustering: automatic clustering on Emergent Self Organizing Feature Maps, Technical Report Nr. 36, Department of Computer Science University of Marburg. ULTSCH,A.(2003c): Maps for the Visualization of high-dimensional Data Spaces, Proc. Workshop on Self Organizing Maps WSOM03, pp 225-230. XU,X. ,ESTER, M., KRIEGEL, H.-P., SANDER, J. (1998): A Distribution-Based Clustering Algorithm for Mining in Large Spatial Databases, Proceedings of the ICDE Conference.