ABSTRACT. Density estimation on the tangent plane (DETP) is a density estimation technique for global illumination. This technique is based on Photon Maps ...
Density estimation optimizations for global illumination R. Garcia, C. Ureña, J. Revelles, M. Lastra, R. Montes Dpto Lenguajes y Sistemas Informáticos University of Granada {ruben,curena,jrevelle,mlastral,rosana}@ugr.es ABSTRACT Density estimation on the tangent plane (DETP) is a density estimation technique for global illumination. This technique is based on Photon Maps and provides increased accuracy when the surfaces are not locally smooth or continuous. However, the performance of the technique is limited by the large number of ray-disc intersections needed. Some optimizations which increase the performance of DETP have been devised. The first optimization works by creating a set of candidate rays for each radiance calculation. The second optimization uses spatial indexing of the discs around the radiance calculation points. An analytical study of the order of complexity of the algorithms, as well as an heuristic study of the calculation time for the different values of the parameters involved, has been performed. Some rules are given in order to identify the most suitable optimization for a given radiance calculation.
Keywords: Global Illumination, Density Estimation, Range Searching.
1 INTRODUCTION Density estimation performance depends on the rapid calculation of which rays contribute to a zone in the scene. Current techniques use space partitioning schemes to achieve interactive speeds. Most techniques index the rays in order to calculate density estimation on each of the points in the scene. Our approach, which is based on Density Estimation on the Tangent Plane, uses advanced space partitioning techniques to index the zones which affect each point where density estimation is being calculated and obtains better performance than existing techniques when the zones are relatively small. In Density Estimation rays are usually included in a spatial indexing in order to provide a fast means to locate rays which affect a given position. Photon Maps [Jen01] indexes the ray impacts using a kd-tree. Sphere cache [LURM02] creates a list of spheres which contain rays. Havran et al. use a lazily constructed kd-tree to index the rays [HBHS05]. In Raytracing (from the eye), most applications create a spatial indexing for the objects in the scene. [AK89] and [Hav01] provide a compendium of techniques. Our approach consists in applying a spatial indexing of the discs used in Density Estimation on the Tangent Plane. Permission to make digital or hard copies of all or part of this work for personal or classroom use is granted without fee provided that copies are not made or distributed for profit or commercial advantage and that copies bear this notice and the full citation on the first page. To copy otherwise, or republish, to post on servers or to redistribute to lists, requires prior specific permission and/or a fee.
Short communications proceedings, ISBN 80-86943-05-4 WSCG’2006, January 30 – February 3, 2006 Plzen, Czech Republic. Copyright UNION Agency – Science Press
Some work has been done on applying statistical and analytical methods to calculate the efficiency of spatial indexing used in global illumination algorithms. [HPP00] uses statistical methods to study different spatial indexing techniques for ray tracing and [HP03] presents a framework which eases the comparison among different optimization techniques. The structure of the article is the following: Section 2 describes the most common density estimation techniques, beginning with simple techniques whose limitations are dealt with by more complex algorithms. Finally our algorithms are described in some detail. An optimization of DETP, disc indexing, is introduced. This technique provides increased performance when the distance between points in which the radiance is being calculated is in the order of magnitude of size of the kernel of the density estimation function. However, the main advantage of this technique is that all existing spatial indexing techniques can be trivially modified to support this approach. Section 3 contains an empirical comparison of time efficiency between different optimizations of Density Estimation on the Tangent Plane, using a test scene. Section 4 has a time efficiency study on the different algorithms. The probabilities of ray object intersection are used to calculate the expected time of the different algorithms, and an order of efficiency using the O() notation is derived for each algorithm. Finally the most important conclusions are summarized and our future work is outlined.
2 DENSITY ESTIMATION METHODS In order to obtain a radiosity value at a point, an approximation of the integral of the incident radiance for all the directions towards that point must be calculated. The most basic method is described by Arvo in [Arv86] and Patanaik in [PM92]. It computes the
impacts of the photons in the patches and calculates the energy density in those patches. Then vertexes are assigned a radiance which is the average of the patches to which they belong. One method which has proven useful to obtain an estimate of the integral is the Density Estimation Method, popularized by [WHSG97] and [Jen96]. This method consists of three phases. The first phase is based on the particle model of light, and traces a number of photons from the light sources. The second phase (Density Estimation proper) estimates the radiance. The third phase, decimation, simplifies the geometry after illumination has been calculated. This last phase is dropped often because it is considered to be outside the scope of density estimation. Jensen [Jen96], devised the well known Photon Maps method. It consists in finding the nearest n ray impacts (n is predefined) to the point where radiance is being estimated, adding their energy, and dividing it by the area of the greatest circle of the sphere which contains the n impacts. The most known limitation of Photon Maps, is that when radiance on a point is calculated, the surface in the neighbourhood should be relatively planar and large. [HP02] presents an algorithm which solves this limitation by using geometry information near the point. Another less known limitation of Photon Maps and [HP02], mentioned in [LURM02] and [HBHS05], is that if relatively very small surfaces exist in the scene, these zones have a comparatively high variance, and they tend to appear either too bright (in a few cases) or too dark (which is more frequent) if the number of photons is not large enough.
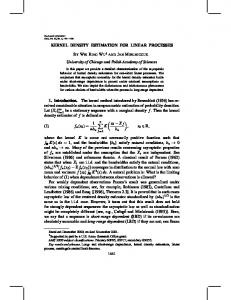
2.1 Density Estimation on the Tangent Plane A method to avoid the high variance of Photon Maps mentioned in the previous section consists in storing the rays in the scene and using a fixed size disc centered in the point where radiance is being calculated, and contained in the plane tangent to the surface. Rays intersecting a given disc are used to calculate the radiance at the point on which the disc is centered [LURM02]. The algorithm is called Density Estimation on the Tangent Plane (DETP). Note that this algorithm keeps track of the trajectory of the photons (origin, direction and impact point) unlike the original Photon Maps. See Figure 1. To avoid self-shadowing in concave surfaces, the second intersection of the ray and the scene is used instead of the first. This method uses discs of fixed radius [LURM02]. The algorithm has optimum trade-off between accuracy and variance when the disc radius (which is a user defined constant) is in the order of magnitude of half the distance between irradiance calculations. If disc radius were smaller, rays intersecting the tangent plane near
Figure 1: Density Estimation on the Tangent Plane
the middle point of two irradiance calculations would be ignored. If it were larger, intersections would be used for various calculations, creating artificial smoothing.
2.2 Sphere cache The limitation of DETP is that the number of disc-ray intersections is high, therefore increasing the computation time. To address this, the sphere cache [LURM02] was developed. The sphere cache consists in creating a hierarchy of spheres of decreasing radius and storing the rays which intersect each sphere in order to decrease the number of ray-disc intersection tests. Firstly, a sphere tangent (i.e. circumscribed) to the bounding box of the scene is built. This sphere intersects all the rays. Then, as figure 2 shows, spheres of decreasing radius are built one inside the other (the ratio between two consecutive spheres is a parameter called Q), until the radius is just above the disc radius mentioned in the previous section. Each sphere has an associated data structure which contains the rays which the aforementioned sphere intersects. These rays are calculated by the intersection of the sphere with the rays in the immediately enclosing sphere. The first point at which radiance is to be calculated is the center of the spheres of decreasing radius. Therefore, the first disc is contained in the inner sphere. Irradiance can be calculated by checking which rays in the inner sphere intersect the disc as well, and adding their energy. The number of ray-disc intersection tests is clearly reduced. For the rest of the points, if the disc centered in the point is contained in the inner sphere, the disc is intersected against the rays in this sphere. Otherwise, the sphere is discarded, and the rest of the spheres are tested in order, until one is found to enclose the disc. Then the hierarchy of spheres is recalculated, using this point as center. See Figure 2 right. Finally, the disc is intersected against the rays in the innermost sphere, in the same way as when no recalculation of spheres is needed.
This method has higher performance than the original sphere cache intersection method when the discs have a radius which is in the order of magnitude of the mean distance among the points in which radiance is being calculated. In other situations, the performance of the sphere cache is higher. Details are provided in Section 3.
3 EMPIRICAL COMPARISON Figure 2: Sphere cache
Lastra et al. [LURM02] demonstrated that the use of space filling curves to reorder the points increments spatial coherence, and therefore reduces computation time. This approach is called point sorting.
2.3 Disc indexing The disc indexing technique creates a spatial indexing of the discs in the scene. This is accomplished by considering the discs as real geometry, and applying a space partitioning method to them. The discs are initialized with a radiance value of zero. Then the rays traverse the spatial index adding their contribution to the discs they intersect. See Figure 3. The ray need
Figure 3: Disc indexing
only be followed until the first intersection with the real scene (or the second if concave surfaces exist). The spatial indexing should be able to store discs and to calculate efficiently all the intersections with a segment (the endpoints of this segment are the origin of the ray and the intersection with the real scene). All the published algorithms meet this criterion. After radiance has been calculated, each disc contains an estimate of the radiance according to the DETP scheme. The data structure can be considered a sort of irradiance cache [WRC88]; therefore new irradiance values can be estimated using the same interpolation which that paper proposes. Some work [HP03] has been done on studying characteristics of the scene which make some indexing techniques more efficient than others. Other studies [HPP00][RLGM03] use a fast simulation with few rays to choose the most appropriate indexing method. Since the disc position follows the surface of the objects, this research is applicable for this technique as well.
All the algorithms described in the previous sections have been implemented in our rendering system. The system calculates irradiance samples on the vertexes of the scene even though DETP can calculate irradiance on any surface point. The first test scene can be seen in Figure 4 (left). It contains 72 500 triangles, and is called the first tree scene. The second tree scene is a different type of tree and ground, with bigger triangles (Figure 4 (center)). An axis aligned BSP Tree [SS92] is used in the first examples of this section, and an Octree is used in the latter, more complete comparison. These techniques were chosen because they provided good performance in the photosimulation phase. The timing results for the BSP Tree are shown in Figure 5. In this article, all times are expressed in seconds. Triangles in the ground have edges whose length is 2 % of the scene’s length and triangles in the tree have edges of 1 %. It can be seen that for disc sizes under 4 % of the scene, disc indexing is faster than sphere cache. For 20 000 photons, the results are only better for sizes of 1 % and 2 %. The graph in Figure 5 shows disc indexing’s performance decrease as the area of the discs increases. It can be seen that for the second scene the results are better using larger discs than in the first, due to the fact that the triangle size has increased. In order to make a more complete comparison between the techniques, a series of experiments were conducted on the first scene. Time was measured for the different combinations of radius of the DETP disc (between 1% and 16%), maximum depth of the octree (between 5 and 8 levels) and number of photons (between 100 and 409 600). The timing results are linear with respect to the number of rays for the executions of disc indexing with octrees of different depths. Sphere cache is also linear, but the time is slightly better than linear when the number of rays is small. This is due to the rays in the inner sphere fitting the processor’s cache. According to the experiments performed, the performance difference of sphere cache and disc indexing depends basically on the ratio of the distance between discs (∆x) to the disc radius (d). If we call r this number, r = ∆x/d, and bearing in mind that the performance of the algorithms changes
Figure 4: First and second tree scenes, and large atrium
Figure 5: Time in seconds of radiance calculation using sphere cache and disc indexing for the first scene, as a function of disc radius
smoothly with this number and therefore the divisions are not sharp, three regions can be recognized. • The first corresponds to r ≤ 2, in which disc indexing is better than sphere cache. The difference is more significant as disc radius decreases. • The second corresponds to r ≥ 6, in which the situation is the opposite. • The third is the intermediate situation 2 < r < 6. In this case, if the rays in the inner sphere fit the processor’s cache, sphere cache is faster due to the coherence of this algorithm. Otherwise, disc indexing is faster, because the performance per ray of sphere cache lowers. Figure 6 gives the performance of the techniques for each case. In a third, more complex scene, which can be seen in Figure 4 (right), disc indexing obtained reductions in time of up to 50 %. In this scene, the mean distance between points is 0.013ˆ and the disc radius is ˆ therefore it belongs to the first zone. 0.01; ∆x/d=1.3, Summarizing, it is worth noting that the performance of disc indexing decreases faster than that of sphere
Figure 6: Zones in which each technique is optimal. Time as a function of r = ∆x/d
cache as disc size grows and that the memory required by disc indexing grows extremely fast as disc size grows, making disc indexing unusable for large discs. For very small radii, disc indexing at maximum depth is always better than sphere cache. It should be noted as well that the spatial partitioning should end when the size of the voxel is similar to that of the disc radius.
4 THEORETICAL STUDY These algorithms have the same underlying Density Estimation Technique (DETP). Therefore, for any given scene and set of rays, they will calculate the same solution (albeit using different computation time). In this case, the efficiency of the algorithms can be compared using computation time as a function of the size of the scene (that is, the number of discs and their size) and the number of rays. Of the three algorithms (raw DETP, sphere cache with point sorting and disc indexing), only sphere cache with point sorting and disc indexing are discussed, since they have the highest performance. Notation is sum-
Ray related quantities R Set of Rays nR = #R Number of rays Sphere related quantities S = {Si } Set of Spheres ri Radius of Si ri = ri−1 Q = r0 Qi Vi = 43 π ri3 Volume of Si mi Number of recalculations of sphere Si with point sorting. k Number of spheres Time related quantities u Ray Disc intersection time t Ray Sphere intersection time TR Time to recalculate the spheres with point sorting TI Time to intersect the disc against the inner sphere Other symbols 0 < Q < 1 Ratio of the radii of two spheres P = {Pi } Set of Irradiance samples nP = #P Number of Irradiance samples d Disc Radius Table 1: Symbols used in this article
marized in Table 1. The efficiency of raw DETP is clearly O(nR nP ). For sphere cache with no point sorting, the points at which the radiance is calculated are assumed to follow a uniform distribution. This prevents sphere cache from obtaining better performance. It can be shown that the algorithm is O(nR nP ), with a hidden constant slightly over 1. The efficiency of the other two algorithms is discussed in detail in the following sections. An asymptotical analysis of the performance of the algorithms in the average case is useful to check scalability. Scene complexity (here measured as the number of radiance calculations) and illumination complexity (number of rays) are used as the variables for the study. To calculate the expected time for the algorithms mentioned in the previous sections we need an estimation of the number of ray-disc intersections, which depend on the distribution of rays. We will suppose that the rays are uniformly distributed in space. This assumption is essential to obtain mathematical formulae for intersection probability. It is a common assumption [ABCC02, ABCC03], also implicitly used in [RKJ96] which works well in practice although it does not correspond exactly to reality.
4.1 Mean time using sphere cache with point sorting The probability that a ray (with uniform distribution) which intersects a convex body, intersects a second convex body located inside the first can be derived from re-
sults of integral geometry from Santalo [San02], and is the ratio of the areas of the bodies. In the case of sphere cache, if the distribution of the rays is uniform, the number of rays which intersect the inner sphere is independent of the location of the sphere, and is proportional to the quotient of the square of the radii of the spheres. The number of rays which intersect Si is then ni = n R
ri2 = nR Q2i r02
(1)
The cost of recalculating a sphere Si once is product of the number of rays in the surrounding sphere multiplied by the ray-sphere intersection test: ti = tni−1
(2)
where t is the ray sphere intersection time. Now we need to know how many spheres there are. Spheres are created with decreasing radius, until the radius of the sphere is just above the disc radius (i.e. the next sphere would have a smaller radius than the disc). Let k be the number of nested spheres in the sphere list. To calculate k, we will use d as the disc radius. Recall (Section 2.2) that the quotient between the radii of two adjacent spheres is Q, and that spheres are built until their radius is just above the disc radius d. The value of k should comply with the following equations: rk = Qk r0 ≥ d ; rk+1 < d Therefore k can be calculated as: � � �� d k = logQ r0
(3)
(4)
The cost of intersecting the disc with the rays in the inner sphere, TI , is: TI = u nk nP = u nR Q2k nP =
(5)
d2 (6) r02 Since sphere cache is not useful unless the locations of the points in which the radiance is calculated are coherent, a space filling curve is used to sort the points. The z-order or Lebesgue curve is used in this algorithm. The sorting algorithm divides the cube in 248 cubes. Each small cube has an X, Y and Z coordinate with 16 bits each, ranging from 0 to 16383. These 3 coordinates are concatenated to form a 48-bit number. A function then transforms this number by reordering the bits in the following way: the least significant bits of each coordinate correspond to the three least significant bits of the new one, and this process is repeated until the most significant bit is reached. An example with 3 bits / coordinate would be: u n P nR Q
2∗blogQ ( rd )c 0
. u n P nR
• Original: (x2 x1 x0 | y2 y1 y0 | z2 z1 z0 ) • Reordered: (x2 y2 z2 | x1 y1 z1 | x0 y0 z0 )
Now the cubes are visited from 0 to 248 − 1. Changing the least three significant bits means moving the point to a distance whose length √ does not exceed that of the diagonal of the cubes, 2 ∗ 3 ∗ 2−16, and it is also not less than that of its side, 2 ∗ 2−16. A sphere with a radius in that order of magnitude would be recalculated at most 248 times. It can be seen that a sphere of radius 2−m r0 is recalculated 23m times. Therefore, since ri = Qi r0 = 2−m r0 m = − log2 Qi
i = 23∗(− log2 Q )
(7) (8) = Q−3i
sphere Si is recalculated mi times. This is the maximum number of times the sphere is rebuilt, and is independent of the number of points at which the density estimation is calculated. There is an independent limit on the number of times which it can be rebuilt, given by the number of irradiance samples. Sphere Si is recalculated at most nP times. The total recalculation cost in this case is k
TR = ∑ min(nP , mi )ti
(9)
i=1
and the total cost is T = TR + TI
(10)
T can be used to provide clues about what value for Q should be used. See Figure 7. The graph in the left shows the cost of recalculating spheres per ray (i.e. 1 would mean nR intersections; equivalent to no optimization), as a function of the disc radius and Q. A small Q creates few spheres, so the time is small. The disc radius influences the length of the sphere list, but the smallest spheres have very few rays and therefore add little to the time, so the differences in time are small. Figure 7 (center) provides a graph of the time it takes to intersect the disc to the rays in the inner sphere. This time only depends on the radius of the inner sphere, which depends on Q: the radius is rk such that rk = r0 Qk ≥ d and rk+1 < d. This graph shows that there is an infinite number of optimum Q; but if numeric instability makes obtaining the minimum values difficult, Q should be as near as possible to one. A high Q provides inner spheres which wrap tightly around the discs. On the other hand, the number of recalculations is high. A low Q provides loose fits to the discs; therefore there will be many rays in the inner sphere and the calculation time will be higher. The spikes in the graph correspond to the inner spheres which wrap perfectly around the discs, i.e., d = rk . The local minima of this function have all the same value, which is the time to intersect the rays in a sphere of radius d: u nR d 2 /r02 . Figure 7 (right) provides the sum of the two previous graphs. It forms a U-shaped function, as was expected
of the two composing graphs, and shows how changing the disc radius makes the optimum value of Q change smoothly to create an inner sphere which encases the disc. When Q becomes near to 1, the number of spheres increases exponentially and the time can be seen to diverge in Q = 1, which would mean an infinite number of spheres. The figures show values between 0.6-0.7 as being a good compromise, because it is below 1 on Figure 7 (left) and near the point where the gradient becomes important, and the value in the graph of Figure 7 (center) is quite low also. The result is coherent with practical experiments [Las04]. It was seen above that for a sufficiently large nP , the number of recalculations is fixed and the time depends only on nR . The time to intersect the disc to the rays in the inner sphere, on the other hand, does depend both on n R and nP and is therefore O(nR nP ). The hidden constant, d 2 /r02 , can, in practice, make this algorithm quite efficient. If the disc radius is approximately equal to distance between irradiance samples, which would be desirable according to Section 2.1, the efficiency of the algorithm can be proven to increase. The supposition that the disc radius is approximately equal to the distance between samples will therefore be added. For small nP (so the limit on recalculations is not reached), since the disc radius is approximately the distance between irradiance samples, then k is approximately: � � √ 1 k ≈ logQ √ (11) = logQ−1 3 nP 3 n P Now, to calculate the order of efficiency of the algorithm, the value of some important quantities is shown, and finally the time of the whole algorithm is expanded and the efficiency is calculated. The value of ni , number of rays in sphere i is ni = nR Q2i
(12)
The time to recalculate sphere i is ti = t nR Q2i−2
(13)
The number of recalculations of sphere i: mi = Q−3i
(14)
The time to recalculate sphere i in the whole algorithm is mi ti = t nR Q−i−2 (15) Finally, the time of the whole algorithm is then �√ � k √ tnR 3 nP − 1 m t = = O(nR 3 nP ) i i ∑ 2 Q 1−Q i=1
(16)
Time 0.14 0.12 0.1 0.08 0.06 0.04 0.02 0.3 0.4 0.5 0.6 0.7 0.8 0.9
Q
Figure 7: Left: Number of recalculations of sphere cache as a function of Q and Disc Radius. Center: Time to intersect the disc to the rays in the inner sphere, as a function of Q. Right: Recalculation time of sphere cache as a function of Q and Disc Radius.
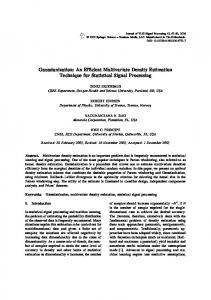
4.2 Disc indexing The disc diameter provides a useful minimum size for the voxels in the disc indexing technique. Dividing a voxel of this size creates voxels in which most of the discs belong to all child voxels. This makes the intersection time with the new voxels higher than the original combined voxel. To illustrate the problem, imagine we were to calculate the radiance on each of the vertexes of the mesh in Figure 8. Remember though that DETP is independent of geometry. There is a disc centered in each of the vertexes of the scene. As the disc size grows, it becomes apparent that space partitioning will not help.
1% 2%
4%
8%
There are therefore 8k voxels. A uniform distribution of the irradiance samples mean there are nP /8k samples per voxel, and therefore, the intersection time between one ray and one voxel is nP u/8k . Since each ray traverses a line of these voxels (2k voxels), and the origin must be found by traversing the tree (k steps) the mean time for this method is T = u k nR nP /4k
(19)
If we make the voxel size similar to the disc size, k = √ √ O(log2 3 nP ),. The algorithm is then O(nR 3 nP lognP ). If we use a balanced space partitioning structure, according to [ABCC02], traversing to a neighbor node can be done in O(1). Then the performance of disc in√ dexing becomes O(nR 3 nP ). This efficiency is higher than that of the sphere cache, which is O(nR nP ), for a large nP . For small nP , in which the distance between irradiance samples is similar to the disc radius, the efficiency is the same as that of sphere cache.
5 CONCLUSIONS Figure 8: Discs in a typical mesh
Since disc indexing can be used with different indexing techniques, the order of complexity depends on the technique used. However, [RKJ96] proves that the order of complexity of a grid, a binary tree and an octree is the cubic root of the number of cells for the three techniques. [SKM98] studies the average complexity for ray shooting for other techniques. Evidence suggests that most indexing techniques have the same order of efficiency in the average case. We will use an octree as a indexing technique in our analysis due to its performance in generic scenes. The relative size of the side of a voxel at a depth k with respect to the side of the whole scene is 21−k . If we set the disc diameter as the side of the smallest voxel, we get 21−k = 2 d (17) k = b− log2 dc
(18)
According to the empirical study of the techniques, the ratio of the mean distance between irradiance samples and the disc radius defines zones in which the algorithms are adequate. Disc indexing is optimal if this ratio is smaller than 2; sphere cache is optimal if this ratio is larger than 6. In the intermediate zone, sphere cache is better if the rays in the inner sphere fit the processor’s cache. A universal optimal algorithm would calculate this ratio and the mean number of rays in the inner sphere and would select the best technique with this data. The results of the theoretical study are the proof that basic DETP and sphere cache are O(nR nP ), and that sphere cache with point sorting, although O(nR nP ), has a hidden constant proportional to d 2 /r02 , which is the fraction of rays in a sphere whose radius is that of the discs. Since this value is quite small, the algorithm is quite fast in practice. For small scenes, this last algo√ rithm was also proven to be O(nR 3 nP ). It was also proven that the radius factor should be between 0.6 and 0.7.
√ Disc indexing is O(nR 3 nP lognP ) for unbalanced √ trees and O(nR 3 nP ) for balanced trees.
[HP02]
Heinrich Hey and Werner Purgathofer. Advanced radiance estimation for photon map global illumination. Computer Graphics Forum, 21(3):541–546, 2002.
6 FUTURE WORK
[HP03]
V. Havran and W. Purgathofer. On comparing ray shooting algorithms. Computer and Graphics, 27, Issue 4:593–604, August 2003.
[HPP00]
V. Havran, J. Pˇrikryl, and W. Purgathofer. Statistical comparison of ray-shooting efficiency schemes. Technical Report TR-186-2-00-14, Institute of Computer Graphics and Algorithms, Vienna University of Technology, may 2000.
[Jen96]
H.W. Jensen. Global illumination using photon maps. In Rendering Techniques’96, pages 21–30. SpringerVerlag, 1996.
[Jen01]
Henrik Wann Jensen. Realistic Image Synthesis using Phothon Mapping. AK Peters, 2001.
[LAM00]
J. Lext, U. Assarsson, and T. Moeller. Bart: A benchmark for animated ray tracing. Technical report, Dept. of Computer Engineering, Chalmers University of Technology, Goeteborg, 2000.
[Las04]
Miguel Lastra Leidinger. Stochastic Rendering Techniques for Complex Environments. PhD thesis, University of Granada, 2004.
We plan to use the BART [LAM00] benchmarking in the empirical study to investigate the border between the different useful zones of each algorithm. Some more studies should be done on other algorithms related to Density Estimation on the Tangent Plane, such as Variable Radius [Las04], which allows the size of the discs to change on account of the number of rays in the vicinity (like Photon Maps). In order to extend this approach to be able to compare it to different Density Estimation techniques (such as Photon Maps, or Ray Maps for Global Illumination [HBHS05] by Havran et al.), a study of variance and error should be added, and the algorithms compared by examining the error or variance as a function of computing time. The framework presented in this article should be used as a basis for the automatic estimation of parameters in DETP. Finally more realistic models of the distribution of the irradiance samples and the rays should be studied.
7 ACKNOWLEDGEMENTS This work has been supported by the research project coded TIN2004-07672-C03-02 (Spanish Commission for Science and Technology). We would like to thank Miguel Vega for his help, and anonymous reviewers for their comments.
REFERENCES
[LURM02] M. Lastra, C. Ureña, J. Revelles, and R. Montes. A particle-path based method for Monte-Carlo density estimation. Poster at: 13th EUROGRAPHICS Workshop on Rendering, 2002. [PM92]
S.N. Pattanaik and S.P. Mudur. Computation of global illumination by Monte Carlo simulation of the particle model of light. Proceedings of 3rd Eurographics Rendering Workshop, Bristol, 1992.
[RKJ96]
Erik Reinhard, Arjan J. F. Kok, and Frederik W. Jansen. Cost prediction in ray tracing. In Rendering Techniques ’96, pages 41–50. Springer-Verlag, June 1996.
[RLGM03] J. Revelles, M. Lastra, R.J. García, and R. Montes. A formal framework approach for ray-scene intersection test improvement. In WSCG’2003, 2003.
[ABCC02] B. Aronov, H. Brönnimann, A. Y. Chang, and Y. Chiang. Cost prediction for ray shooting. In SCG ’02, pages 293–302. ACM Press, 2002.
[San02]
L. Santalo. Integral Geometry and Geometric Probability. Cambridge University Press, 2 edition, October 2002.
[ABCC03] B. Aronov, H. Brönnimann, A. Y. Chang, and Y. Chiang. Cost-driven octree construction schemes: An experimental study. In SCG ’03, pages 227–236. ACM Press, 2003.
[SKM98]
L. Szirmay-Kalos and G. Márton. Worst-case versus average case complexity of ray-shooting. Computing, 61(2):103–131, 1998.
[SS92]
K. Sung and P. Shirley. Ray tracing with the BSP tree. In David Kirk, editor, Graphics Gems III, pages 271–274. Academic Press, 1992.
[AK89]
J. Arvo and D. Kirk. A Survey of Acceleration Techniques, chapter 6, pages 201–262. Academic Press, San Diego, 1989.
[Arv86]
James R. Arvo. Backward Ray Tracing. In ACM SIGGRAPH ’86 Course Notes - Developments in Ray Tracing, volume 12, pages 259–263, 1986.
[Hav01]
V. Havran. Heuristic Ray Shooting Algorithms. Ph.d. thesis, Department of Computer Science and Engineering, Czech Technical University in Prague, 2001.
[HBHS05] V. Havran, J. Bittner, R. Herzog, and H.-P. Seidel. Ray maps for global illumination. 16th Eurographics Symposium on Rendering, 2005.
[WHSG97] B. Walter, P. M. Hubbard, P. Shirley, and D. P. Greenberg. Global illumination using local linear density estimation. ACM Transactions on Graphics, 16(3):217– 259, July 1997. [WRC88]
Gregory J. Ward, Francis M. Rubinstein, and Robert D. Clear. A ray tracing solution for diffuse interreflection. In SIGGRAPH ’88: Proceedings of the 15th annual conference on Computer graphics and interactive techniques, pages 85–92, New York, NY, USA, 1988. ACM Press.