Feb 5, 1998 - kernel functions. There is empirical evidence that the regularization parameter gives good control of the approximation, and that the choice of ...
Density Estimation using Support Vector Machines J. Weston, A. Gammerman, M. Stitson, V. Vapnik, V. Vovk, C. Watkins.
Technical Report CSD-TR-97-23 February 5, 1998
!()+, -./01 23456 Department of Computer Science Egham, Surrey TW20 0EX, England
Introduction 1
1 Introduction In this report we describe how the Support Vector (SV) technique of solving linear operator equations can be applied to the problem of density estimation [4]. We present a new optimization procedure and set of kernels closely related to current SV techniques that guarantee the monotonicity of the approximation. This technique estimates densities with a mixture of bumps (Gaussian-like shapes), with the usual SV property that only some coe�cients are non-zero. Both the width and the height of each bump is chosen adaptively, by considering a dictionary of several kernel functions. There is empirical evidence that the regularization parameter gives good control of the approximation, and that the choice of this parameter is universal with respect to the number of sample points, and can even be xed with good results.
2 The density estimation problem We wish to approximate the density function p(x) where
F (x) = P (X � x) =
Zx
?1
p(t)dt:
(1)
We consider densities in the interval [0,1]. Finding the required density means solving the linear operator equation 1
Z
1
0
�(x ? t)p(t)dt = F (x)
(2)
where instead of knowing the distribution function F (x) we are given the iid (independently and identically distributed) data x1; : : :; x`: (3) We consider the multi-dimensional case where the data x1; : : :; x` are vectors of dimension d. The problem of density estimation is known to be ill-posed. That is, when nding f 2 F that satis es the equality Af = F; f can have large deviations in solution with small deviations in the right hand side. In our terms, a small change in the cumulative distribution function of the continuous random variable x can cause large changes in the derivative, the density function. One can choose regularization techniques to obtain a sequence of solutions that converge to the desired one. Using the data (3) we construct the empirical distribution function
F`(x) = 1`
` X i=1
�(x1 ? x1i ) : : :�(xd ? xdi )
where x = (x1 ; : : :; xd) instead of the right hand side of (2) which is unknown. We use the SV method to solve the regression problem of approximating the right hand side, using the data (x1; F`(x1 )); : : :; (xl ; Fl (x` )): Applying the SV method of solving linear operator equations [3], the parameters of the regression function can then be used to express the corresponding density. 1
� (x) =
n
1; 0;
x>0 otherwise
SV Method for Solving Linear Operator Equations 2
The advantage of this approach is that we can control regularization through the free parameter � in the SVM approach. For any point xi the random value Fl (xi ) is unbiased and has the standard deviation r � = 1 F (x )(1 ? F (x )) i
`
i
i
so we characterize our approximation with
r
�i = ��i = � 1` F` (xi )(1 ? F`(xi )) where � is usually chosen to be 1 + � , where � is some small value. Therefore one constructs triples (x1 ; F`(x1); �1); : : :; (xl ; Fl (x` ); �`):
(4)
3 SV Method for Solving Linear Operator Equations To solve the density estimation problem we use the SV method for solving linear operator equations Af (t) = F (x) (5) where operator A is a one to one mapping between two Hilbert spaces. We solve a regression problem in image space (the right hand side of the equation) and this solution which is an expansion on the support vectors can be used to describe the solution in pre-image space (the left hand side of the equation before the operator A has been applied). The method is as follows: choose a set of functions to solve the problem in pre-image space f (t; w) 2 � that are linear in some attening space:
f (t; w) =
1 X r=0
wr �r (t) = (W � �(t)):
(6)
That is, the set of functions is a linear combination of the functions �(t) = (�0(t); : : :; �N (t); : : :) (7) which can be thought of as a hyperplane in some attening space, where the linear combination W that de nes the parameters of the set of functions can also be viewed as the coe�cients to the hyperplane W = (w1; : : :; wN ; : : :): (8) The mapping from pre-image to image space by the operator A can then be expressed as a linear combination of functions in another Hilbert space de ned thus: 1 X (9) F (x; w) = Af (x; w) = wr r (x) = (W � (x)) r=0
where r is the r function from our set of functions after the linear operator A has been applied, i.e r (x) = A�r (x). The problem of nding the required density ( nding the vector W in pre-image space) is equivalent to nding the vector of coe�cients W in image space, where W is an expansion on the support vectors th
w=
N X i=1
i (xi );
Spline Approximation of a Density 3
giving the approximation to the desired density
f (t; w) =
N X i=1
i (xi )�(t):
To nd the required density we solve a linear regression problem in image space by minimizing the same functional we used to solve standard regression problems ([2, 3]). Instead of directly nding the in nite dimensional vector W which is equivalent to nding the parameters which describe the density function, we use kernel functions to describe the mapping from input space to the image and preimage Hilbert spaces. In image space we use the kernel 1 X
K (xi ; xj ) =
r
r=0
(xi ) r (xj )
to de ne an inner product de ned by the set of functions . We solve the corresponding regression problem in image space, using the coe�cients to de ne the density function in pre-image space:
f (t; �; ��) = where
K(xi; t) =
N X
1 X r=0
i=1
r
i K(xi; t)
(xi)�r (xj ):
(10)
4 Spline Approximation of a Density We can look for the solution to equation (2) in any set of functions where one can construct a corresponding kernel and cross kernel. For example, consider the set of constant splines with in nite number of nodes. That is we approximate the unknown density by the function:
p(x) = =
Z
1
0
Z
1 0
g(� )[
Z
0
x
�(t ? � )dt]d� + a0x
g(� )[(x ? � )+ ]d� + a0 x
(11)
where function g(� ) and parameter a0 are to be estimated. So the corresponding kernel is
K (xi ; xj ) =
Zx 0
(xi ? � )+ (xj ? � )+ d� + xixj
= (xi ^ xj )2(xi _ xj ) ? 21 (xi ^ xj )3 ? 12 (xi ^ xj )2 (xi _ xj ) + 31 (xi ^ xj )3 + xixj (12) and the corresponding cross kernel is
K(x; t) =
Z
0
1
�(t ? � )(x ? � )+ d� + x
= x(x ^ t) ? (x ^2 t) + x 2
Considering a Monotonic Set of Functions 4
Using kernel (12) and triples (4) we obtain the support vector coe�cients i = ��i ? �i, only some of which are non-zero, from the standard SV regression approximation with generalized �-insensitive loss function, by maximizing the quadratic form
W (�� ; �) = ?
` X i=1
�i(��i + �i ) +
subject to the constraints
` X i=1
yi (��i ? �i) ? 21
` X (��i ? �i)(��j ? �j )K (xi ; xj )
i;j =1
` ` X X ��i = �i i=1
0 � �� � C; i
i=1
i = 1; : : :; ` i = 1; : : :; `:
0 � �i � C; These coe�cients de ne the approximation to the density
f (t) =
N X i=1
(13)
i0 K(x0i ; t)
where x0i are the support vectors with corresponding non zero coe�cients i0 .
5 Considering a Monotonic Set of Functions Unfortunately, the described technique does not guarantee the chosen density will always be positive (recall that a probability is always nonnegative, and the distribution function monotonically increases). This is because the set of functions F (x; w) 2 � from which we choose our regression in image space can contain nonmonotonic functions. We can choose a set of monotonic regression functions and require that the coe�cients i , i = 1; : : :; ` are all positive. However, many sets of monotonic functions expressed with Mercer Kernels are too weak in their expressive power to nd the desired regression - for example if we choose from the set of polynomials with only positive coe�cients. A set of linear constraints can be introduced into the optimization problem to guarantee monotonicity. This becomes computationally unacceptable in the multidimensional case, and in our experiments did not give good results even in the one dimensional case. We require a set of functions that has high VC dimension but is guaranteed to approximate the distribution function with a monotonically increasing function.
6 Another Approach to SV Regression Estimation In the SV approach, regression estimation problems are solved as a quadratic optimization problem (13), giving the approximation
F (x) =
N X i=1
i0 K (x0i ; x):
If we choose to solve this problem directly, (to choose a function from this set of functions) without the regularizing term (w � w) (minimizing the norm of coe�cients), we are only required to solve a Linear Programming (LP) problem
Linear Programming Approach to SV Density Estimation 5
[4]. In this alternative approach we can choose our regularizing term as the sum of the support vector weights. This is justi ed by bounds obtained in the problem of Pattern Recognition that probability of test error is less than the minimum of three terms: 1. A function of the number of free parameters | this can be billions, and although is often used as a regularizer in classical theory, is in fact ignored in the SV method. 2. A function of the size of the margin | this is the justi cation for the regularizer used in the usual SV approach (maximizing the margin). 3. A function of the number of support Vectors | the justi cation for the new approach. So, to solve regression problems we can minimize the following: ` X i=1
` ` ` X X X � �i + �i + C �i + C �i� i=1
i=1
i=1
(14)
under constraints
` X yi ? � ? �i � ( (��i ? �j )K (xi ; xj )) + b � yi + � + �i� ; i = 1; : : :; ` j =1
(15)
�i � 0; �i � 0; ��i � 0; �i� � 0; i = 1; : : :; `:
(16) This regularizing term can also be seen as a measure in some sense of smoothness in input space; a small number of support vectors will mean a less complex decision function. So minimizing the sum of coe�cients can be seen as an approximation of minimizing the number of support vectors.
7 Linear Programming Approach to SV Density Estimation There exist powerful basis functions that will guarantee the monotonicity of the regression but are non-symmetrical, thus violating Mercer's condition of describing an inner product in some Hilbert space. If we do not describe an inner product, we cannot use the quadratic programming approach to the support vector machine, which minimizes the norm of coe�cients of a hyperplane in feature space. Using the linear programming approach to the Support Vector Machine we do not have this restriction. In fact in this approach K (x; y) can be any function from L1 (P ). To estimate a density we choose a monotonic basis function K (x; y) which has a corresponding cross kernel K(x; t) , and then minimize ` X i=1
under constraints
yi ? �i ? �i �
` X j =1
�i + C
` X i=1
�i + C
` X �i� i=1
�j K (xi ; xj ) � yi + �i + �i� ; i = 1; : : :; ` ` X i=1
�iK (xi ; 0) = 0
(17)
(18) (19)
Gaussian-like Approximation of a Density 6 ` X i=1
�iK (xi ; 1) = 1
(20)
�i � 0; �i � 0; �i� � 0; i = 1; : : :; `:
(21) This di�ers from the usual SV LP Regression (Section 6) in the following ways: 1. We require only positive coe�cients, so we only have one set of Lagrange multipliers. 2. We require the constraints (19) and (20) to guarantee F (0) = 0 and F (1) = 1. 3. We no longer need a threshold b for our hyperplane because we require that F (0) = 0, and F (1) = 1, and choose kernels that can satisfy these conditions. 4. We allow each vector xi , i = 1; : : :; ` to have a unique �-insensitivity so we can nd the corresponding support vectors for our triples (4). To show that there exist powerful linear combinations of monotonic non-symmetrical kernels, consider the following basis function, the so-called step kernel
K (x; y) =
d Y i=1
�(xi ? yi ):
For each support vector (basis function) this gives the e�ect of a step around the point of the vector in input space (we can also think of this as constant splines with a node at each vector). The coe�cient or weight of the vector can make the step arbitrarily large. This kernel can approximate any distribution and is known to converge to the desired one as the number of training examples increases. However, the non-smoothness of the function renders it useless for estimating densities.
8 Gaussian-like Approximation of a Density We would like to approximate the unknown density from a mixture of bumps (Gaussian-like shapes). This means approximating the regression in image space with a mixture of sigmoidal functions. Consider sigmoids of the form: K (x; y) = 1 + e 1(x?y) In particular, if = 2�� then � is a good approximation to the distance from the support vector at which the sigmoid approaches atness. The approximation of the density then is:
f (x) = where
N X i=1
�i K(xi; x)
K(x; y) = 2 + e (x?y) + e? (x?y) :
(22)
The distribution function is approximated with a linear combination of sigmoidal shapes which can estimate well the desired regression. The derivative of the regression function (the approximation of the density) is a mixture of Gaussian-like shapes. The chosen centres for the bumps are de ned by the support vectors, and their heights by the size of their corresponding weights.
Constant Spline Approximation of a Density 7
9 Constant Spline Approximation of a Density We can also estimate our density using a mixture of uniform densities. This means approximating the regression in image space with a mixture of linear pieces, using a kernel of the form: 8 0; (x ? y) < ? < K (x; y) = : (x?2y )+ ; ? � (x ? y) � 1; (x ? y) > where is the width parameter. The approximation of the density is then:
f (x) = where
N X i=1
�i K(xi; x)
8 < 0; (x ? y) < ? K(x; y) = : 1; ? � (x ? y) � 0; (x ? y) >
10 Adaptive kernel width This technique does not allow us to choose the width of each piece of our density function, but only its height and centre. The width of the pieces is decided by the free parameter , but all of the widths have to be the same. We would like to remove this free parameter, and allow our SV technique to choose these widths adaptively. This can be achieved if for each centre xi we have a dictionary of k kernels, giving the approximation to the density:
f (x) =
` X i=1
(�1i K1(xi ; x) + �2i K2(xi ; x) + : : : + �ki Kk (xi; x))
where each vector xi ,i = 1; : : :; ` has coe�cients �ji , j = 1; : : :; k. We then have a corresponding dictionary of k cross kernels, where Ki has the width i , a chosen dictionary of widths, for example
1 = 21 ; 2 = 13 : : :: As usual, many of these coe�cients will be zero. This technique allows us to remove the free parameter , and also tends to reduce the number of Support Vectors required to approximate a function because of the power of the dictionary. We can thus generalize the Linear Programming SV Regression technique (section 7) to the following optimization problem: minimize ` X k X i=1 n=1
�ni + C
` X i=1
�i + C
` X �i� i=1
with constraints
yi ? �i ? �i �
` X k X j =1 n=1
�nj Kn (xi; xj ) � yi + �i + �i� ;
(23)
Choice of regularizer 8 ` X k X i=1 n=1
` X k X
i=1 n=1
�niKn (xi ; 0) = 0 �niKn (xi ; 1) = 1
�i � 0; �i � 0; �i� � 0;
i = 1; : : :; `:
11 Choice of regularizer When considering density estimates as mixtures of kernel functions, where all the coe�cients are positive, the sum of coe�cients must sum to 1 (if the kernel chosen has been scaled appropriately) to ensure that the integral of the estimated density is also 1. This can be easily translated into a linear constraint which can replace the boundary conditions F (0) = 0 and F (1) = 1 to give a density estimate without nite support (this is more suitable for estimates using a mixture of Gaussian shapes because of the tails of the distribution.) However, using the linear regularizer described in the optimization problem (23) is not a good approximation to minimizing the number of support vectors because of the coe�cients summing to 1. This means we must choose another regularizer. This gives us the more general optimization problem:
(�) + C with constraints
yi ? �i ? �i �
` X k X j =1 n=1
` X i=1
` X �i�
�i + C
i=1
(24)
�nj Kn (xi; xj ) � yi + �i + �i� ;
` X k X i=1 n=1
�ni = 1
�i � 0; �i � 0; �i� � 0; i = 1; : : :; `: There are many choices of (�), for example we could try a more accurate minimization of the number of support vectors by approximating the � function (because
it has no useful gradients) with a sigmoid function:
(�) =
` X k X i=1 n=1
1
1 + exp(?��ni + 6) :
However, this leads to a nonlinear, non-convex optimization problem. In the case where one only has a single kernel function, if the cross kernel (the kernel that describes the density estimate rather than the estimate of the distribution function) satis es Mercer's condition and describes a hyperplane in some feature space, then one can choose the regularizer
(�) =
` X i;j =1
�i�j K(xi; xj )
which is equivalent to minimizing W � W , the norm of the vector of coe�cients describing the hyperplane in feature space. This is interesting because we can use the same regularizer as the usual support vector pattern recognition and regression
Approximating a mixture of normal distributions 9
estimation cases, because we are regularizing the derivative of our function, even though we are using a kernel to solve our regression problem that does not satisfy Mercer's condition. So we can regularize our density estimate if we use the radial basis (Gaussian-like) kernel (22). However, when considering a dictionary of kernels one must consider how the different kernels are combined in the regularizer, i.e they describe a set of hyperplanes in di�erent Hilbert spaces. In our experiments we chose a much simpler regularizer, a weighted sum of the support vector coe�cients:
(�) =
` X k X i=1 n=1
wn�ni
where wn is chosen to penalize kernels of small width (wn = n if the k kernels are in order, smallest width rst). This gives a linear optimization problem, however the quality of the solution can probably be improved by choosing other regularizers.
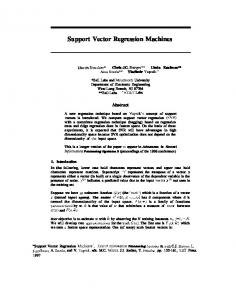
12 Approximating a mixture of normal distributions We considered a density generated from a mixture of two normal distributions � (x ? �)2 � � x2 � 1 1 p p exp ? 2�2 (25) + exp ? 2 p(x; �; �) = 2� (2�) 2 (2�) where � = ?4 , � = 21 . We drew 50 , 100 and 200 examples generated by this distribution, and estimated the density using our technique. Here, � = 1, and a dictionary of four kernel widths was used - 1 = 0:1, 2 = 0:2, 3 = 0:3 and 4 = 0:5. The results are shown in gure 1. 4.5
Density example - Royal Holloway Center for Computer Learning
Density example - Royal Holloway Center for Computer Learning
3.5
Density example - Royal Holloway Center for Computer Learning
4.5
5
training set estimated density estimated distbn func
4
training set estimated density estimated distbn func
training set estimated density estimated distbn func 4.5
4 3 3.5
4 3.5 2.5
3.5
3 3
3 2.5
2
2.5 2.5
2
2
1.5
2 1.5
1.5 1.5
1 1
1 1 0.5
0.5
0.5
0 0
0.2
0.4
0.6
0.8
1
0 -0.2
0
0.2
0.4
0.6
0.8
1
1.2
0 -0.2
0.5
0
0.2
0.4
0.6
0.8
1
1.2
0 -0.2
0
0.2
0.4
0.6
0.8
1
1.2
Figure 1 The real density (far left) scaled to the interval [0,1] is estimated using from left to right 50, 100 and 200 data points. The number of support vectors required were 9,10 and 13 respectively.
13 Conclusions and Further Research We have described a new SV technique for estimating multi-dimensional densities. The estimation can be a mixture of bumps where the height, width and centres are chosen by the training algorithm. We can also use other sets of functions desscribed by other kernels, for example constant splines. As is usual for SV techniques, the description of the approximation can be short as it depends on the number of support vectors.
Conclusions and Further Research 10
The control of the regularization in this method appears to be independent of the number of examples. Fixing � to be greater than the estimated variance (say � = 1) and C to a high value (close to in nity), then the technique becomes a parameterless estimator of densities. The key idea of our method is the following: nd the combination of weights that describe the smoothest function (according to some measure of smoothness which we choose) that lies inside the epsilon tube of the training data. Hypothetically we could choose to have in nitely many widths, giving us an in nite set of kernel functions at each point in our training set. Even with these in nite number of variables our optimization problem still has a nite (probably very small) number of coe�cients because it will not require many bumps to describe the smoothest function inside the epsilon tube. This has a great advantage over other kernel methods, for example, the Parzen windows method. The Parzen method is a xed width estimator (the width is the free parameter you must choose appropriately) and the number of coe�cients is equal to the number of training points. Thus our method has two advantages over the Parzen method: we remove the free parameter of width and we introduce sparsity into our decision function. The idea of dictionaries of kernel functions may also be useful in other problems (pattern recognition, regression estimation). Dictionaries of di�erent sets of functions could also be considered, and not just di�erent parameters of the same kernel type. Although the method looks promising, when the sample size is small (say less than 50 points) the estimates could be improved. To estimate well one must choose a good measure of smoothness. In the current implementation this method is rather poor - a weighted sum of coe�cients is minimized (this is not a good idea because the sum of coe�cients must sum to 1.) This is a rather ad hoc method, and there are many other regularizers we could choose. For example, as the density estimate describes a hyperplane in feature space (it is a radial basis kernel) we could minimize the norm of the vector of coe�cients describing this hyperplane, as in the usual support vector case.
REFERENCES 11
References [1] Cortes, C.; and Vapnik, V. 1995. Support Vector Networks. Machine Learning 20:273-297. [2] Vapnik, V. N. The Nature of Statistical Learning Theory. Springer-Verlag, New York, 1995. [3] Vapnik, V.; Golowich, S.; Smola, A. 1997. Support Vector Method for Function Approximation, Regression Estimation, and Signal Processing. In: M. Mozer, M. Jordan, and T. Petsche (eds.): Neural Information Processing Systems, Vol. 9. MIT Press, Cambridge, MA, 1997 (in press). [4] Vapnik, V. N. Statistical Learning Theory. J. Wiley, 1998 (forthcoming).