Hydrological Sciences–Journal–des Sciences Hydrologiques, 51(4) August 2006
599
Using support vector machines for long-term discharge prediction JIAN-YI LIN1, CHUN-TIAN CHENG1 & KWOK-WING CHAU2 1 Institute of Hydroinformatics, Department of Civil Engineering, Dalian University of Technology, Dalian 116024, China
[email protected] 2 Department of Civil and Structural Engineering, Hong Kong Polytechnic University, Hunghom, Kowloon, Hong Kong, China
Abstract Accurate time- and site-specific forecasts of streamflow and reservoir inflow are important in effective hydropower reservoir management and scheduling. Traditionally, autoregressive movingaverage (ARMA) models have been used in modelling water resource time series as a standard representation of stochastic time series. Recently, artificial neural network (ANN) approaches have been proven to be efficient when applied to hydrological prediction. In this paper, the support vector machine (SVM) is presented as a promising method for hydrological prediction. Over-fitting and local optimal solution are unlikely to occur with SVM, which implements the structural risk minimization principle rather than the empirical risk minimization principle. In order to identify appropriate parameters of the SVM prediction model, a shuffled complex evolution algorithm is performed through exponential transformation. The SVM prediction model is tested using the long-term observations of discharges of monthly river flow discharges in the Manwan Hydropower Scheme. Through the comparison of its performance with those of the ARMA and ANN models, it is demonstrated that SVM is a very potential candidate for the prediction of long-term discharges. Key words autoregressive moving-average (ARMA) models; long-term discharge prediction; neural networks; SCE-UA algorithm; support vector machine
Utilisation de “support vector machines” pour la prévision de débit à long terme Résumé La gestion et la programmation efficaces d’un barrage hydroélectrique requièrent des prévisions précises, dans le temps et spécifiques pour chaque site, de débit de cours d’eau et de flux entrant dans le réservoir. Les modèles autorégressifs à moyenne mobile (ARMA) sont traditionnellement utilisés pour la modélisation de séries temporelles hydrologiques comme une représentation standard de séries temporelles stochastiques. Récemment des approches par réseaux de neurones artificiels (RNA) se sont révélées être efficaces pour la prévision hydrologique. Dans cet article, une “support vector machine” (SVM) est présentée comme une méthode prometteuse pour la prévision hydrologique. L’approche SVM devrait éviter le sur-apprentisage et les optima locaux, car elle s’appuie sur le principe de minimisation structurelle du risque plutôt que sur le principe de minimisation empirique du risque. Un algorithme “shuffled complex evolution” est utilisé via une transformation exponentielle pour identifier les paramètres appropriés du modèle SVM de prévision. Le modèle SVM de prévision est testé avec les longues séries d’observation des débits mensuels de cours d’eau du complexe hydroélectrique de Manwan. Il apparaît, par comparaison de ses performances avec celles de modèles ARMA et RNA, que l’approche SVM est très pertinente pour la prévision de débits à long terme. Mots clefs modèles autorégressifs à moyenne mobile (ARMA); prévision de débit à long terme; réseaux de neurones; algorithme SCE-UA; support vector machine
INTRODUCTION Long-term discharge prediction results can be widely used in such areas as environmental protection, flood prevention, drought protection, reservoir control and water resources distribution. This may have significant economic value in decision control of reservoirs and hydropower stations. In the past few decades, a wide range of hydrological models has been proposed for this purpose. Conventionally, factor analysis and hydrological analysis methods, such as the historical evolution method, time series analysis, multiple linear regression method and so forth, are used to forecast the longterm discharges. Nowadays, time series analysis and the multiple linear regression Open for discussion until 1 February 2007
Copyright © 2006 IAHS Press
600
Jian-Yi Lin et al.
method are the two most commonly used methods. Time series analysis is based on the decomposition of various factors into trend and cycle. Since the 1970s, autoregressive moving-average models (Box & Jenkins, 1976) have also been widely used. Since the 1990s, artificial neural networks (ANN) (ASCE Task Committee, 2000a,b), which are based on the architecture of the brain and nervous system, were gradually used in hydrological prediction (cf. Dawson & Wilby, 1998; See & Openshaw, 2000; Hu et al., 2001, 2005; Campolo et al., 2003; Cigizoglu, 2003; Wilby et al., 2003; Giustolisi & Laucelli, 2005; Sy, 2006). In this paper, an attempt is made to examine any possible improvement in forecasting accuracy by employing the support vector machine (SVM) model (Vapnik et al., 1997). The support vector machine implements the structural risk minimization principle (SRM) rather than the empirical risk minimization principle implemented by most traditional ANN models. The most important concept of SRM is minimizing an upper bound to the generalization error instead of minimizing the training error. Based on this principle, the SVM achieves an optimum network structure. In addition, SVM is equivalent to solving a linear constrained quadratic programming problem so that the solution of the SVM is always unique and globally optimal. Originally, SVMs have been successfully applied to pattern recognition problems (Burges, 1998; Hsu et al., 2003). However, along with the introduction of Vapnik’s ε insensitive loss function, SVMs have been extended to solve nonlinear regression estimation (Gunn, 1998; Smola & Schölkopf, 2004) and time series forecasting (Thissen et al., 2003). It is useful to note that the SVM is finding its way into the water sector (Liong & Sivapragasm, 2002; Bray & Han, 2004; Asefa et al., 2004) and a combination of SVM and evolutionary algorithm called EC-SVM has also been attempted recently (Yu et al., 2004). In the latter study, a shuffled complex evolution (SCE-UA) algorithm (Duan et al., 1992, 1993, 1994) was used to search phase space parameters (the time delay embedding dimension) and three SVM parameters. The authors utilized the decomposition method to model two daily runoff time series of the Tryggevælde catchment and the Mississippi River in the phase space compared with the conventional approach and the recently introduced inverse approach. In this paper, a SVM combined with the SCE-UA algorithm is applied to the raw monthly river flow series in Manwan Hydropower Scheme in comparison with the ARMA and ANN models. And the SCE-UA algorithm is only performed to identify the SVM parameters through some exponential transformation. SUPPORT VECTOR MACHINES FOR REGRESSION (SVR) Assume that the training data set is given as:
{(x1 , y1 ), (x 2 , y 2 ), ..., (xl , y l )} ⊂ R n × R
(1)
The following function is estimated in SVM for linear regression (SVR): f ( x ) =< w, x > +b
w, x ∈ R n , b ∈ R
(2)
by minimizing the so-called regularized risk functional (Vapnik, 1998): 1 2 w + C ⋅ Remp [ f ] 2
Copyright © 2006 IAHS Press
(3)
Using support vector machines for long-term discharge prediction
601
1 1 2 2 w is called the regularized term. Minimizing w will make a 2 2 function as flat as possible, thus playing the role of controlling the function capacity. The second term Remp[f] is the empirical error measured by the loss function, and C is called the regularization constant which determines tolerated deviations from the loss function. Here, the ε-insensitive loss function is used:
The first term
Lt ( y i , f ( xi ) ) = max{0, y − f ( x) − ε}
(4)
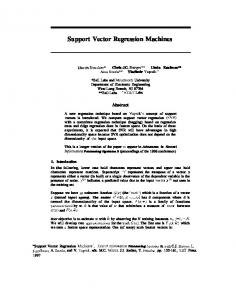
This defines an ε tube (Fig. 1), so that if the predicted value is within the tube the loss is zero, while if the predicted point is outside the tube, the loss is the magnitude of the difference between the predicted value and the radius ε of the tube. Assume that there is a function f that approximates training data X with precision ε. In this case, it is assumed that the problem is feasible. In the case of infeasibility, one can introduce slack variables ξ, ξ* to cope with infeasible constraints of the optimization problem.
Loss
+ε
ξi
−ε
ξi
ξi* −ε +ε Fig. 1 The soft margin loss setting for a linear SVM and ε-insensitive loss function.
Then the above problem can be formalized as: min
(
l 1 2 w + C ∑ ξ i + ξ *i 2 i =1
)
(5)
⎧ y i − < w, xi > −b ≤ ε + ξ i ⎪ subject to ⎨< w, xi > +b − y i ≤ ε + ξ *i ⎪ * ⎩ξ i , ξ i ≥ 0
(6)
The key idea is to construct a Lagrange function (also called Lagrangian) from the objective function and the corresponding constraints, by introducing a dual set of variables. It can be shown that this function has a saddle point with respect to the primal and dual variables at the solution: L=
(
)
(
)
l l l 1 2 w + C ∑ ξ i + ξ *i − ∑ ηi ξ i + η*i ξ *i −∑ α i (ε + ξ i − y i + < w, xi > +b ) 2 i =1 i =1 i =1 l
(
− ∑ α ε + ξ − y i + < w, xi > +b i =1
* i
* i
)
(7)
Copyright © 2006 IAHS Press
602
Jian-Yi Lin et al.
Here L is the Lagrangian and ηi, ηi*, αi, αi* are Lagrange multipliers. Hence the dual variables in equation (7) have to satisfy the positive constraints: ηi, ηi*, αi, αi* ≥ 0
(8)
The above problem can be converted into a dual problem where the task is to optimize the Lagrange multipliers, αi and αi*. The dual problem contains a quadratic objective function of αi and αi*with one linear constraint:
(
)
(
)(
)
(
)
(
)
l l 1 l l * * * max W α i , α = − ∑∑ α i − α i α j − α j < xi , x j > −ε∑ α i − α i + ∑ y i α i − α *i (9) 2 i =1 j =1 i =1 i =1 * i
subject to:
∑ (α l
i =0
i
)
− α *i = 0 and α i , α *i ∈ [0, C ]
(10)
By some manipulations with Lagrange multiplier and dual optimization, one obtains: l
(
)
w = ∑ α i − α *i xi
(11)
i =1
thus l
(
)
f ( x) = ∑ α i − α *i < xi , x > +b
(12)
i =1
The above approach describes how linear regression can be performed. However, in cases where nonlinear functions should be optimized, this approach has to be extended. This is performed by replacing xi with a mapping into the feature space, ϕ(xi), which linearizes the relationship between xi and yi. In the feature space, the original approach can be adopted in finding the regression solution. When using a mapping function, the solution of equation (12) becomes: l
(
)
f ( x) = ∑ α i − α *i K ( xi , x ) + b
(13)
K ( xi , x ) =< ϕ( xi ), ϕ( x) >
(14)
i =1
with In equation (13), K is the kernel function, which can simplify the mapping. By using the kernel function, the data can be mapped implicitly into a feature space (i.e. without full knowledge of φ) which is hence very efficient. The commonly used kernel functions are listed in Table 1. The data points associated with them have approximation errors equal to or larger than ε and are referred to as support vectors. Generally, the larger the ε, the fewer the number of support vectors and thus the sparser the representation of the solution. However, a larger ε can also depreciate the approximation accuracy placed on the training points. In this sense, ε is a trade-off between the sparseness of the representation and closeness to the data (Cao & Tay, 2003). In contrast to the Lagrange multipliers, the choice of a kernel and its specific parameters, ε and C, does not follow from the optimization problem and has to be tuned by the user. Copyright © 2006 IAHS Press
603
Using support vector machines for long-term discharge prediction Table 1 The commonly used kernel functions. Kernels Linear Polynomial
Functions ( + 1)d
(
Parameters
2
Radial basis function
exp − x − x i
Sigmoid
tanh(b +c)
/ 2σ
2
)
d σ b, c
STUDY AREA AND DATA USED The Manwan Hydropower Scheme in the Lancang River is chosen as the study site. The Lancang River is a large river in Asia, which originates from the Qinghai-Tibet Plateau, penetrates Yunnan from the northwest to the south and passes through Laos, Burma, Thailand, Cambodia and Vietnam, prior to ultimately entering into the South China Sea. The river is about 4500 km long and has a drainage area of 744 000 km2. The Manwan Hydropower Scheme is located in the middle reaches of the Lancang River and at the borders of Yunxian and Jingdong counties. The catchment area at the Manwan Dam site is 114 500 km2, the length above Manwan is 1579 km, and the mean elevation is 4000 m. The average yearly runoff is 1230 m3 s-1 at the dam site. Rainfall provides most of the runoff, whilst snowmelt accounts for the remaining 10%. Nearly 70% of the annual rainfall occurs from June to September. Locations of the Lancang River and the Manwan Hydropower Scheme are shown in Fig. 2.
Fig. 2 Location of the study area. Copyright © 2006 IAHS Press
604
Jian-Yi Lin et al.
5000
Validation
4000
3
Monthly Discharge(m /s)
Training
3000
2000
1000
0 0
60
120
180
240
300
360
Time(1974/1-2003/12)
Fig. 3 Monthly discharge of the Manwan Reservoir.
Figure 3 shows the monthly flow data from January 1974 to December 2003. The data set from January 1974 to December 1998 is used for training, whilst that from January 1999 to December 2003 is used for validation. It is very important to scale features before applying SVM and ANN to prediction (Sarle, 1997). The main advantage is to avoid attributes in greater numeric ranges dominating those in smaller numeric ranges. Another advantage is to avoid numerical difficulties during the calculation. Large attribute values might cause numerical problems because kernel values usually depend on the inner products of feature vectors, such as the linear kernel and the polynomial kernel. It is recommended to linearly scale each attribute to the range (–1, +1) or (0, 1). In the modelling process, the data sets of river flow were scaled to the range between 0 and 1 as follows:
qi′ =
qi − q min q max − q min
(15)
where qi′ is the scaled value, qi is the original flow value and qmin, qmax are, respectively, the minimum and maximum of flow series. APPLICATION OF SVM TO FLOW PREDICTION Prediction model and input numbering The objective of the prediction model is to generalize a relationship of the following form: Y = f (X n ) n
(16)
where X is an n-dimensional input vector consisting of variables x1, …, xi, …, xn, and Y is the output variable. In flow modelling, values of xi may be flow values with different time lags and the value of Y is generally the flow in the next period. Generally, the number of antecedent values included in the vector Xn is not known in advance. Determining the number of runoff values involves finding the lags of runoff Copyright © 2006 IAHS Press
605
Using support vector machines for long-term discharge prediction lag
ACF
lag
PACF
24
0.7649
24
0.212
18
-0.6708
18
-0.0462
12
0.7739
12
0.1781
6
-0.6977
6
-0.2267
(a)-1.0
-0.5
0.0
0.5
( )
(b)
1.0
-1.0
-0.5
0.0
0.5
1.0
Fig. 4 (a) The autocorrelation function and (b) the partial autocorrelation function of the flow series.
that have significant influence on the predicted flow. Sudheer et al. (2002) suggested a statistical procedure for identifying the appropriate input vector for a model. An autocorrelation function (ACF) and partial autocorrelation function (PACF) would suggest the influencing antecedent discharge patterns in the flow at a given time. The ACF and PACF are generally used in diagnosing the order of the autoregressive process and can be employed in prediction modelling too. Yhe ACF exhibits the peak at lag12, as shown in Fig. 4(a). Twelve antecedent flow values have the most information to predict future flow (Box & Jenkins, 1976). In this paper, 12 antecedent flow values are considered based on autocorrelation coefficient analysis. Performance criteria The criterion used to select the most appropriate model is to maximize the goodness of fit. In this paper, the model performance is examined by means of the following indices: – The coefficient of correlation (CORR) given by: CORR =
(
)(
1 n ∑ Qo (i) − Qo Q f (i) − Q f n i =1
(
1 n ∑ Qo (i) − Qo n i =1
)
2
(
)
1 n ⋅ ∑ Q f (i) − Q f n i =1
)
(17)
2
where Qo(i) and Qf(i) are, respectively, the observed and forecast discharge and Qo , Q f denote their means, and n is the number data points considered. –
The root mean square error (RMSE): RMSE =
1 ∑ (Q f (i) − Qo (i))2 n
(18)
Model development and testing There are two main steps for developing a SVM: (a) the selection of the kernel function, and (b) the identification of the specific parameters of the kernel function, i.e. C and ε. Copyright © 2006 IAHS Press
606
Jian-Yi Lin et al.
Most of the previous studies selected RBF as the kernel model for regression. The RBF kernel maps samples nonlinearly into a higher dimensional space and, unlike the linear kernel, can handle the case when the relationship between class labels and attributes is nonlinear. Furthermore, the linear kernel is a special case of RBF. Keerthi & Lin (2001) showed that the linear kernel with a penalty parameter C had the same performance as the RBF kernel with some parameters (C, σ). In addition, the sigmoid kernel behaves like RBF for certain parameters (Lin & Lin, 2003). Another factor influencing the model selection is the number of hyperparameters. The polynomial kernel has more hyperparameters than the RBF kernel. Hence, the RBF kernel involves fewer numerical difficulties in comparison to polynomial kernels, whose values may go to infinity or zero. Therefore, the RBF kernel is adopted in this study. There are three parameters in the approach of using RBF kernels: C, ε and σ. However, the best choices of C, ε and σ for the problem are not known a priori. Consequently, some kind of model identification (parameter search) should be made. The objective is to identify good parameters (C, ε, σ) in order to predict the unknown data with adequate accuracy. In this study, the parameter search scheme employed is the SCE-UA algorithm (Duan et al., 1992, 1993). The SCE-UA belongs to the family of evolution algorithms. The SCE-UA algorithm combines the strengths of the simplex procedure of Nelder & Mead (1965) with: (a) the concept of controlled random search, after Price (1987); (b) competitive evolution, after Holland (1992); and (c) the concept of complex shuffling (Duan et al., 1992, 1993). The synthesis of these three concepts makes the SCE-UA algorithm not only effective and robust but also flexible and efficient. More detailed information can be found in Duan et al. (1992, 1993) and Nunoo & Mrawira (2004). The SCE-UA technique has been used successfully in the area of surface and subsurface hydrology for the calibration of rainfall–runoff models and identification of parameters of aquifer formation (Duan et al., 1994). Moreover, the SCE-UA technique has also been applied successfully to identify parameters of SVM (Yu et al., 2004). Hsu et al. (2003) pointed out that a series of trial of C and ε in exponential space is a practical method to identify good parameters. In the present search process, the parameters C and ε are searched in the exponential space (Fig. 5). The search space of the parameters in this study is C ∈ (2-5, 25), ε ∈ (2-13, 2-1) and σ ∈ (0, 2). For the Manwan Hydropower Scheme, the three parameters are selected as 6.3559, 0.0016 and 1.2980, respectively.
Fig. 5 SVM parameter identification. Copyright © 2006 IAHS Press
607
Using support vector machines for long-term discharge prediction
Result of comparison with ARMA and ANN models The basic components to an ARMA model is autoregression (AR) and moving-average (MA). To obtain a useful ARMA (p,q) model, the two integers p and q, have to be determined, representing, respectively, the number of autoregressive orders and the number of moving-average orders of the ARMA model. In this paper, the AIC (Akaike information criterion) value of ARMA models, for p and q ranging from 1 to 13, is calculated. According to the AIC, the models ARMA(5,6), (6,6), (7,7), (11,9) and (12,10), which have relatively small AIC values, are selected as the candidate models. Table 2 shows the AIC value and the performance of selected ARMA models. The ARMA(11,9) model was chosen as the final ARMA model according to the performance indices (Table 2). Table 2 AIC value and performance indices of alternative ARMA models. (p,q) (5,6) (6,6) (7,7) (11,9) (12,10)
AIC 12.160 12.145 12.179 12.210 12.211
Training: RMSE 378.98 376.07 375.06 363.27 368.97
CORR 0.9055 0.9073 0.9075 0.9133 0.9108
Validation: RMSE 349.47 358.51 354.56 353.06 377.94
CORR 0.9354 0.9341 0.9371 0.9376 0.9260
A typical three-layer feedforward back-propagation ANN model (Fig. 6) is constructed using the same input parameters to the SVM for comparison purposes. The neurons of the hidden layer use the tan-sigmoid transfer function, and the linear transfer function for the output layer. A scaled conjugate gradient algorithm (Moller, 1993) is employed for training, and the training epoch is set to 500. The ANN models used for forecasting have 12 inputs and one output, and the number of hidden neurons is optimized through trials. Figure 7 shows the performance of different ANN models with different numbers of hidden neurons from 1 to 10. The ANN model with two hidden neurons, which produces the best performance according to Fig. 7, is selected as the final ANN model. Input layer
Hidden layer
Output layer
Fig. 6 The architecture of three-layer feedforward back-propagation ANN. Copyright © 2006 IAHS Press
Jian-Yi Lin et al.
0.93
480 460 440 420
0.92 0.91
Training Validation
400 380 360 340
Training Validation
CORR
RMSE
608
0.90 0.89 0.88
320
(a)
0
2
4
6
8
(b)
10
Neuron number of hidden layer
0
2
4
6
8
10
Neuron number of hidden layer
Fig. 7 (a) The RMSE and (b) the CORR of different neural networks.
RMSE=363.27 CORR=0.9133
4000
4000
3000
3000
2000 1000
(a)
0 0
2000
3000
4000
5000
0
4000
4000
3000
3000
2000 1000
2000
3000
4000
5000
2000 1000
0
0 0
1000
2000
3000
4000
5000
0
Ob d RMSE=349.77 CORR=0.9196
5000 4000
4000
3000
3000
2000 1000
1000
2000
3000
4000
5000
Ob d RMSE=351.81 CORR=0.9421
5000
Forecast
Forecast
1000
Ob d RMSE=368.49 CORR=0.9276
5000
Forecast
Forecast
1000
Ob d RMSE=353.92 CORR=0.9145
5000
2000 1000
0
(c)
2000 1000
0
(b)
RMSE=353.06 CORR=0.9376
5000
Forecast
Forecast
5000
0 0
1000
2000
3000
Observed
4000
5000
0
1000
2000
3000
4000
5000
Observed
Fig. 8 (a) ARMA, (b) ANN, and (c) SVM model scatter plots of observed vs forecast discharges: (left) during the training period, and (right) during the validation period. Copyright © 2006 IAHS Press
609
Using support vector machines for long-term discharge prediction
Observed ARMA forecast ANN forecast SVM forecast
4000
3
Monthly Discharge (m /s)
5000
3000
2000
1000
0 0
(a)
60
120
180
240
300
Time(1974/1-1998/12) Observed ARMA forecast ANN forecast SVM forecast
4000
3
Monthly Discharge (m /s)
5000
3000
2000
1000
0 0
(b)
10
20
30
40
50
60
Time(1999/1-2003/12)
Fig. 9 ARMA forecast, ANN forecast, SVM forecast and observed flow (a) during the training period, and (b) during the validation period.
Table 3 Performance indices of ANN and SVM models. Model ARMA ANN SVM
Training: RMSE 363.27 353.92 349.77
CORR 0.9133 0.9145 0.9196
Validation: RMSE 353.06 368.49 351.81
CORR 0.9376 0.9276 0.9421
In order to have the same basis of comparison, the same training and verification sets are used for all models. The scatter plots of observed discharges versus forecast discharges of ARMA, ANN and SVM models are shown in Fig. 8. Figure 9 shows the performances of the three prediction models during the training and validation periods. Table 3 shows their performance indices. It is demonstrated that, when employed for flow prediction in Manwan, the SVM exhibits some advantages over ARMA and ANN models. During the validation, the correlation coefficient of the SVM model is 0.9421, which is larger than its counterparts of the ARMA (0.9376) and ANN (0.9276) models. Moreover, the RMSE of the SVM model is 351.81, which is smaller than that of the Copyright © 2006 IAHS Press
610
Jian-Yi Lin et al.
ARMA (353.06) and ANN (368.49) models. In the training period, the SVM model also outperforms the ARMA and ANN models with larger CORR and smaller RMSE than the other two. CONCLUSION AND DISCUSSIONS In this study, a SVM model is employed to predict long-term flow discharges in Manwan, based on historical records. Data from January 1974 to December 1998 and from January 1999 to December 2003 are used for training and validation, respectively, in monthly flow predictions. The results indicate that the SVM model can give good prediction performance. It is found, through comparison of results of appropriate ARMA and ANN models, that the SVM model is able to give more accurate prediction. This demonstrates its distinct capability and advantages in identifying hydrological time series comprising nonlinear characteristics. Traditionally, ARMA models have been used in modelling time series in water resource management, because such models are accepted as a standard representation of stochastic time series (Box & Jenkins, 1976). However, such models do not attempt to represent the nonlinear dynamics inherent in the hydrological process, and may not always perform well (Tokar & Johnson, 1999). Artificial neural networks are essentially semi-parametric regression estimators and are well suited for prediction. The main advantage of the ANN approach over traditional methods is that it does not require information about the complex nature of the underlying process under consideration to be explicitly described in mathematical form. Whilst ANN models implement the empirical risk minimization principle, the SVM implements the structural risk minimization principle. The solution of the SVM may be globally optimal, while ANN models may tend to fall into a local optimal solution. At the same time, over-fitting is unlikely to occur with the SVM, if the parameters are properly selected. So the SVM seems to be a powerful alternative, which makes it possible to overcome some of the basic weaknesses related to the application of ANNs, while retaining all the strengths of an ANN. The main characteristics of the SVM are as follows: (a) a global optimal solution is found by the quadratic programming method; (b) the result is a general solution, which avoids overtraining as it implements the structural risk minimization principle; (c) according to the Karush-Kuhn-Tucker (KKT) conditions, the solution is sparse and only a limited set of training points contribute to this solution; and (d) nonlinear solutions can be calculated efficiently due to the usage of kernel function. A disadvantage of the SVM is that the training time scales may be somewhere between quadratic and cubic with respect to the number of training samples. So a large amount of computation time will be involved when an SVM is applied for solving large-size problems (Cao & Tay, 2003). Actually, efficient training algorithms have been developed, such as sequential minimal optimization (Platt, 1999), the Nyström method (Williams & Seeger, 2001), Cholesky factorization (Fine & Scheinberg, 2001), or methods that decompose the optimization problem (Joachims, 1999). Another drawback is the difficulty in the selection of a kernel function and its specific parameters, C Copyright © 2006 IAHS Press
Using support vector machines for long-term discharge prediction
611
and ε. More recently, several other methods have been developed to identify the parameters, such as the stepwise search (Dong et al., 2005), genetic algorithms (Chen et al., 2004), the shuffled complex evolution algorithm (Yu et al., 2004), and the simulated annealing algorithms (Pai & Hong, 2005). Acknowledgements This research was supported by the National Natural Science Foundation of China (No. 50479055) and the Internal Competitive Research Grant of the Hong Kong Polytechnic University (G-T592). The helpful comments of two anonymous referees are gratefully acknowledged. REFERENCES ASCE Task Committee (2000a) Artificial neural networks in hydrology. I: Preliminary concepts. J. Hydrol. Engng ASCE 5(2), 115–123. ASCE Task Committee (2000b) Artificial neural networks in hydrology. II: Hydrological applications. J. Hydrol. Engng ASCE 5(2), 124–137. Asefa, T., Kemblowski, M. W., Urroz, G., McKee, M. & Khalil, A. (2004) Support vectors-based groundwater head observation networks design. Water Resour. Res. 40, W11509. doi:10.1029/2004WR003304. Box, G. E. P. & Jenkins, G. M. (1976) Time Series Analysis, Forecasting and Control, Holden-Day, San Francisco, California, USA. Bray, M. & Han, D. (2004) Identification of support vector machines for runoff modelling. J. Hydroinf. 6(4), 265–280. Burges, C. J. C. (1998) A tutorial on support vector machines for pattern recognition. Data Mining and Knowledge Discovery 2, 121–167. Cao, L. J. & Tay, F. E. H. (2003) Support vector machine with adaptive parameters in financial time series forecasting. IEEE Trans. Neural Networks 14(6), 1506–1518. Chen, P. W., Wang, J. Y. & Lee, H. M. (2004) Model selection of SVMs using GA approach. In: 2004 IEEE International Joint Conference on Neural Networks vol. 3, 2035–2040. IEEE, New York, USA. Campolo, M., Soldati, A. & Andreussi, P. (2003) Artificial neural network approach to flood forecasting in the River Arno. Hydrol. Sci. J. 48(3), 381–398. Cigizoglu, H. K. (2003) Estimation, forecasting and extrapolation of river flows by artificial neural networks. Hydrol. Sci. J. 48(3), 349–362. Dawson, C. W. & Wilby, R. (1998) An artificial neural network approach to rainfall–runoff modelling. Hydrol. Sci. J. 43(1), 47–66. Dong, B., Cao, C. & Lee, S. E. (2005) Applying support vector machines to predict building energy consumption in tropical region. Energy and Buildings 37, 545–553. Duan, Q. Y., Gupta, V. K. & Sorooshian, S. (1993) Shuffled complex evolution approach for effective and efficient minimization. J. Optim. Theory Appl. 76(3), 501–521. Duan, Q. Y., Sorooshian, S. & Gupta, V. K. (1992) Effective and efficient global optimization for conceptual rainfall– runoff models. Water Resour. Res. 28(4), 1015–1031. Duan, Q. Y., Sorooshian, S. & Gupta, V. K. (1994) Optimal use of the SCE-UA global optimization method for calibrating watershed models. J. Hydraul. Engng 158(1), 265–284. Fine, S. & Scheinberg, K. (2001) Efficient SVM training using low-rank kernel representation. J. Machine Learning Res. 2, 243–264. Giustolisi, O. & Laucelli, D. (2005) Improving generalization of artificial neural networks in rainfall–runoff modeling. Hydrol. Sci. J. 50(3), 439–457. Gunn, S. R. (1998) Support vector machines for classification and regression. ISIS Tech. Report. ISIS-1-98, Image Speech Intelligent System Research Group, University of Southampton, Southampton, UK. Holland, J. (1992) Adaptation in Natural and Artificial Systems, second edn. MIT Press, Cambridge, Massachusetts, USA. Hsu, C. W., Chang, C. C. & Lin, C. J. (2003) A practical guide to support vector classification. Tech. Report, Dept Computer Sci. & Info. Engng, National Taiwan University, Taiwan, China. Hu, T. S., Lam, K. C. & Ng, S. T. (2001) River flow time series prediction with range-dependent neural network. Hydrol. Sci. J. 46(5), 729–746. Hu, T. S., Lam, K. C. & Ng, S. T. (2005) A modified neural network for improving river flow prediction. Hydrol. Sci. J. 50(2), 299–318. Joachims, T. (1999) Making large-scale support vector machines learning practical. In: Advances in Kernel Methods— Support Vector Learning (ed. by B. Schölkopf, C. J. C. Burges & A. J. Smola), 169–184. MIT Press, Cambridge, Massachusetts, USA. Keerthi, S. S. & Lin, C. J. (2001) Asymptotic behaviors of support vector machines with Gaussian kernel. Neural Computation 15(7), 1667–1689. Lin, H. T. & Lin, C. J. (2003) A study on sigmoid kernels for SVM and the training of non-PSD kernels by SMO-type methods. Tech. Report, Dept of Computer Sci. & Info. Engng, National Taiwan University, Taiwan, China.
Copyright © 2006 IAHS Press
612
Jian-Yi Lin et al.
Liong, S. Y. & Sivapragasm, C. (2002) Flood stage forecasting with SVM. J. Am. Water Res. Assoc. 38(1), 173–186. Moller, M. F. (1993) A scaled conjugate gradient algorithm for fast supervised learning. Neural Networks 6, 523–533. Nelder, J. A. & Mead, R. (1965) A simplex method for function minimization. Comput. J. 7(4), 308–313. Nunoo, C. & Mrawira, D. (2004) Shuffled complex evolution algorithms in infrastructure works programming. J. Comput. Civil Engng 18(3), 257–266. Pai, P. F. & Hong, W. C. (2005) Support vector machines with simulated annealing algorithms in electricity load forecasting. Energy Conversion and Manage. 46(17), 2669–2688. Platt, J. (1999) Flat training of support vector machines using sequential minimal optimisation. Advances in Kernel Methods—Support Vector Learning (ed. by B. Schölkopf, C. J. C. Burges & A. J. Smola), 185– 208. MIT Press, Cambridge, Massachusetts, USA. Price, W. L. (1987) Global optimization algorithm for a CAD workstation. J. Optim. Theory Appl. 55(1), 133–146. Sarle, W. S. (1997) Neural network FAQ. Periodic posting to the Usenet news group comp.ai.neural-nets. Available at: ftp://ftp.sas.com/pub/neural/FAQ.html. See, L. & Openshaw, S. (2000) A hybrid multi-model approach to river level forecasting. Hydrol. Sci. J. 45(4), 523–536. Smola, A. J. & Schölkopf, B. (2004) A tutorial on support vector regression. Statist. and Comput. 14, 199–222. Sudheer, K. P., Gosain, A. K. & Ramasastri, K. S. (2002) A data-driven algorithm for constructing artificial neural network rainfall–runoff models. Hydrol. Processes 16, 1325–1330. Sy, N. L. (2006) Modelling the infiltration process with a multi-layer perceptron artificial neural network. Hydrol. Sci. J. 51(1), 3–20. Thissen, U., van Brakel, R., de Weijer, A. P., Melssen, W. J. & Buydens, L. M. C. (2003) Using support vector machines for time series prediction. Chemometrics and Intelligent Laboratory Systems 69, 35–49. Tokar, A. S. & Johnson, P. A. (1999) Rainfall–runoff modeling using artificial neural network. J. Hydrol. Engng ASCE 4(3), 232–239. Vapnik, V. (1998) Statistical Learning Theory, Springer, New York, USA. Vapnik, V., Golowich, S. & Smola, A. J. (1997) Support vector method for function approximation, regression estimation, and signal processing. Adv. Neural Info. Processing Systems 9, 281–287. Wilby, R. L., Abrahart, R. J. & Dawson, C. W. (2003) Detection of conceptual model rainfall–runoff processes inside an artificial neural network. Hydrol. Sci. J. 48(2), 163–181. Williams, C. K. I. & Seeger, M. (2001) Using the Nyström method to speed up kernel machines. In: Advances in Neural Information Processing Systems (ed. by T. K. Leen, T. G. S. Dietterich & V. Tresp), vol. 13, 682–688. MIT Press, Cambridge, Massachusetts, USA. Yu, X. Y., Liong, S. Y. & Babovic, V. (2004) EC-SVM approach for real-time hydrologic forecasting. J. Hydroinf. 6(3), 209–233.
Received 24 August 2005; accepted 5 May 2006
Copyright © 2006 IAHS Press