Appl. Phys. A 85, 415–425 (2006)
Applied Physics A
DOI: 10.1007/s00339-006-3695-9
Materials Science & Processing
a. michaelides
Density functional theory simulations of water–metal interfaces: waltzing waters, a novel 2D ice phase, and more Fritz-Haber-Institut der Max-Planck-Gesellschaft, Faradayweg 4–6, 14195 Berlin, Germany
Received: 12 April 2006/Accepted: 9 August 2006 Published online: 27 September 2006 • © Springer-Verlag 2006 ABSTRACT There are few molecules, if any, more important than water. Yet remarkably little is known about how it interacts with solid surfaces, particularly at the all important atomic level. This is true despite widespread general interest and compelling environmental and economic incentives. Here, I will discuss detailed density-functional theory studies aimed at putting our understanding of water–solid interfaces, specifically water–metal interfaces, on a much firmer footing. In this paper, I will attempt to answer some key questions: Where do isolated water monomers adsorb on flat metal surfaces? How do water monomers diffuse across metal surfaces? How do water dimers adsorb and diffuse across metal surfaces? What factors control the structure and stability of water bilayers on metal surfaces? PACS 68.43.Bc; 82.65.+r;
1
68.43.Fg
Introduction
The nature of the H2 O–metal interaction is of obvious importance to many aspects of daily life and to any number of scientific disciplines. As a result many investigators have devoted considerable time and effort towards understanding these systems [1, 2]. One need only look at the impressive list of references in Henderson’s recent review article for evidence [2]. One particular area of scientific endeavor where H2 O– metal interactions play a prominent role is heterogeneous catalysis. The activity of fuel cells and other electrochemical devices, for example, depend sensitively on elementary steps involving H2 O molecules at metal surfaces. And almost all industrial catalytic processes catalyzed by metals have H2 O or hydroxyl implicated either as a reactant, product, or intermediate [3]. Moreover, the interaction of H2 O molecules with metal surfaces has an even greater historical significance to catalysis. It was the observation of H2 O formation from its elements over a Pt surface that lead Berzelius in 1837 to coin the term catalysis, or, more precisely, to postulate that the Pt possessed a “catalytic force” [4]. In the intervening u Fax: +49 308 413 4801, E-mail:
[email protected]
170 years this one particular catalytic reaction has been intensively studied. Indeed, it was only at the turn of this century that the reaction was observed in progress at the molecularlevel with scanning tunneling microscopy (STM), here at the Fritz Haber Institute [5]. Subsequent density-functional theory (DFT) calculations helped to identify the atomic-level reaction mechanism and sequence of elementary reaction steps through which it proceeds [6, 7]. This particular reaction is just one of several recent examples that illustrate nicely how the combination of modern experimental surface science techniques and state-of-the-art theoretical methods can now yield valuable atomic-level structural and energetic information about important elementary steps (adsorption, dissociation, diffusion, etc.) at metal surfaces. In the following, aside from discussing purely theoretical studies, I will discuss similar combined experimental and theoretical work that has lead to, for example, the structural characterization of a novel interfacial ice phase [8]. Some of the other issues and specific questions that will be addressed in this article are: (i) Where do isolated water monomers adsorb on flat metal surfaces? (ii) How do water monomers diffuse across metal surfaces? (iii) How do water dimers adsorb and diffuse across metal surfaces? (iv) What factors control the structure and stability of H2 O bilayers on metal surfaces? The answers provided to these questions will, for the most part, be those obtained from DFT [9, 10] with electron exchange and correlation treated by the generalized gradient approximations of Perdew and Wang (PW91) [11] or Perdew, Burke, and Ernzerhoff (PBE) [12]. Aside from saying that all calculations have been performed with the planewave pseudopotential DFT code CASTEP [13], I will not dwell on the precise computational set-up employed for each system. These details can be found elsewhere, in for example [8, 14, 15]. 2
H2 O monomer adsorption
The question of where does an isolated water monomer adsorb on a flat metal surfaces is perhaps the simplest question one could ask concerning H2 O–metal adsorp-
416
Applied Physics A – Materials Science & Processing
tion systems. This seemingly simple question is, however, difficult to answer because experimental characterization of H2 O monomer adsorption is exceedingly difficult, complicated by facile H2 O cluster formation. Cluster formation is problematic because it masks the true H2 O–metal interaction, making it difficult to make definitive statements about H2 O–metal bonding [1]. In order to minimize cluster formation, it is necessary to work with low H2 O coverages (< 0.1 monolayer (ML)) and at low temperatures (< 100 K). Although several experiments have recently been performed under these conditions such as a number of scanning tunneling microscopy (STM) studies on the (111) facets of Pt, Ag, Pd, and Cu [16– 19], it has not been possible with STM to resolve the internal structure of adsorbed H2 O molecules. Nor has it been possible to determine the orientation of the H2 O molecule with respect to the surface normal or its height above the surface. The preferred orientation of H2 O on a surface is important because it will, for example, affect how H2 O dissociates or the stability and structure of H2 O clusters that may form. Generally it had been assumed that H2 O adsorbs “upright” with the O end down and the OH bonds pointing away from the surface, since this orientation maximizes the adsorbate-dipole substrate-image-dipole interactions [1, 19–21]. Several spectroscopic techniques [22–24] and the electron stimulated desorption ion angular distributions (ESDIAD) [25, 26] approach have been used to probe the orientation of H2 O monomers on single crystal surfaces. However, results were conflicting and ambiguities have arisen, mainly because of difficulties in discriminating between H2 O monomers and H2 O clusters. Despite many theoretical studies in this area, a clear consensus on the nature of H2 O–metal bonding has not been arrived at [6, 27–32]. Some predict preferential adsorption at atop sites while others predicted adsorption at higher coordination sites. Further, it has often simply been assumed that H2 O sits upright in the plane of the surface normal. When this has been explicitly investigated, however, a range of orientations from upright to nearly flat lying molecules have been predicted. From a systematic DFT study of H2 O monomer adsorption on a variety of metal substrates – Ru(0001), Rh(111), Pd(111), Pt(111), Cu(111), Ag(111), and Au(111) – we have been able to identify a general model for H2 O monomer adsorption [14]. According to DFT, H2 O monomers bind pref-
Surface Ru(0001) Rh(111) Pd(111) Pt(111) Cu(111) Ag(111) Au(111)
E ads (eV)a
O–metal (Å)
O−H (Å)
−0.38 −0.42 −0.33 −0.35 −0.24 −0.18 −0.13
2.29 2.31 2.28 2.36 2.25 2.78 3.02
0.98 0.98 0.98 0.98 0.98 0.97 0.97
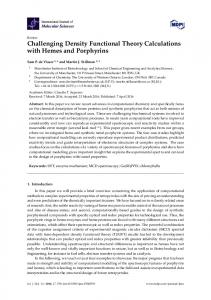
Top and side views of the typical structure of a H2 O monomer adsorbed on a close-packed metal surface FIGURE 1
erentially at atop sites and lie nearly flat on all of the above surfaces, as shown in Fig. 1. With the help of Table 1, we can look at this structure for H2 O on metals a bit more closely. The following general features are interesting and noteworthy: (i) H2 O binds weakly to all surfaces investigated. The adsorption energies range from −0.1 to − 0.4 eV and are in the sequence: Au < Ag < Cu < Pd < Pt < Ru < Rh Bond strengths in this energy regime place the H2 O–metal bond in the weak chemisorption/physisorption limit; (ii) H2 O deforms little upon adsorption: the O−H bonds are slightly elongated from a calculated gas phase value of 0.97 Å to 0.97 – 0.98 Å; and the HOH angle (Θ ) is expanded by no more than 2◦ from a calculated gas phase value of 104◦ ; (iii) H2 O is laterally displaced from the precise atop site (∆ Oxy), by as much as 0.3 Å on Ru, Pt, and Ag. Similarly, the metal atom directly beneath H2 O is slightly displaced along the surface normal from the other top layer metal atoms (∆metal); (iv) The largest variation between each adsorption system is the height of the H2 O molecule above the surface: the O–metal bond lengths vary from 2.25 Å on Cu to 3.02 Å on Au. Several other DFT studies, using similar methods, also lend support to this conclusion for H2 O monomer adsorption on these and other surfaces [33–37]. Moreover, comparison of this general binding configuration with experiment proves to be positive too. First, although often assumed to sit at atop sites the only actual characterizations of H2 O monomer adsorption are the recent STM study on Pd(111) [18] and an X-ray absorption fine structure study on Ni(110) [38]. Sat-
∆metal (Å) −0.01 0.06 0.03 0.03 0.07 0.04 0.03
∆Oxy (Å)
Θ (◦ )
0.30 0.06 0.18 0.29 0.03 0.29 0.06
106 106 105 106 106 105 105
α (◦ ) 6 9 7 7 15 9 13
E ads2 (eV)a 0.12 0.15 0.17 0.09 0.19 0.14 0.11
ads = E H2 O/M -E H2 O -E M ; where E H2 O/M , E H2 O , and E M are the total energies of the adsorption system, the gas phase H2 O molecule and the clean metal surface, respectively. aE
Adsorption energies (E ads ) and optimized structural parameters for H2 O at its equilibrium (atop) site on several metal surfaces. ∆metal is the vertical displacement of the atop site metal atom from the other surface layer metal atoms. ∆Oxy is the lateral displacement of O from the precise atop site. Θ is the HOH angle and α is the H2 O-surface tilt angle as displayed in Fig. 1. Also given are the adsorption energies of H2 O at the next-most stable site on each surface (E ads2 ) TABLE 1
MICHAELIDES
Density functional theory simulations of water–metal interfaces
417
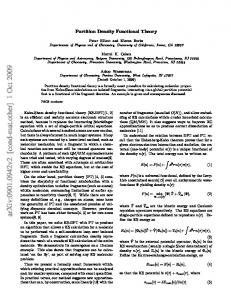
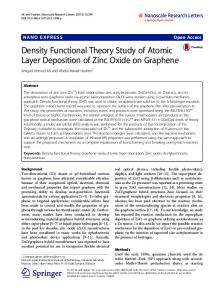
FIGURE 2 DFT computed energy level diagram and Kohn–Sham orbitals for the four highest occupied orbitals of a gas phase H2 O molecule. E HOMO is the energy of the 1b1 orbital, which has been set to zero eV
isfyingly, both conclude that H2 O adsorbs at atop sites. Further, on Ni(110) it was shown that the molecular plane is significantly tilted (< 70◦ ) from the surface normal [23, 38]. A similar conclusion for the H2 O tilt angle was reached from electron-energy-loss studies of H2 O monomers at 10 K on Cu(100) and Pd(100) [22]. In apparent disagreement with this model, however, are the ESDIAD results for H2 O on Ru(0001) from which it was concluded that H2 O monomers sit upright [25, 26]. However, these experiments were performed at 90 K at coverages of 0.2 ML. Subsequent infrared absorption spectroscopy (IRAS) experiments have shown that under these conditions on Ru(0001) the dominant surface species will be H2 O clusters, probably tetramers, and not H2 O monomers [24]. Monomeric H2 O is only stable on Ru(0001) below 50 K and the IRAS results provide evidence that indeed it lies “nearly parallel” to the surface [24]. Thus it appears that the model for H2 O adsorption identified here is not incompatible with experimental data, rather there are several results in apparent support of it. Moving our attention to the electronic structures of these adsorption systems, it is useful to recall the occupied molecular orbitals of an isolated gas phase H2 O (Fig. 2). In order of increasing energy these are labeled, according to C2v symmetry, 2a1, 1b2 , 3a1 and 1b1 1 . The 2a1 orbital is mainly a combination of O 2s and H s orbitals. This along with the 1b2 orbital, which is a combination of an O p and H s orbitals, constitute the main H2 O bonding orbitals. The two remaining O p orbitals form the 3a1 and 1b1 orbitals. These are the highest energy occupied orbitals of H2 O. Because the 3a1 orbital is a mixed orbital with some O and H s character it resides circa 2 eV below the 1b1 orbital (Fig. 2). Inspection of the adsorption systems reveals that the interaction of the H2 O molecule with each substrate is mediated mainly through the 1b1 orbital. This is illustrated, for example, by the partial density of states (PDOS) plots and electron density difference plot for H2 O on Pt(111) that are shown in Fig. 3. Furthermore, by examining the PDOS for a relaxed H2 O structure at the equilibrium tilt angle (α = 7◦ ) and an unstable upright H2 O (α = 90◦ ) on Pt(111), we can understand the desire of H2 O molecules to bond to the surface in a near-parallel configuration. For each adsorption structure, two peaks are observed in the vicinity of the Fermi level in the PDOS 1 The O 1s core orbital (1a ) is several hundred eV below the occupied 1 molecular orbitals of H2 O and out of the range of Fig. 2. The unoccupied antibonding 2b2 and 4a1 orbitals which reside about 7 eV above the 1b1 orbital are also not shown.
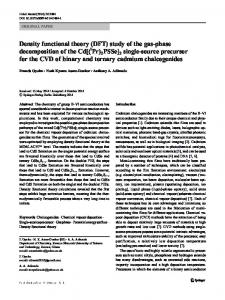
FIGURE 3 (a) Partial density of states (PDOS) projected onto the p orbitals of O for H2 O adsorbed in its equilibrium (“Flat,” α = 7◦ ) and an upright configuration (“Up,” α = 90◦ ) on Pt(111). The approximate energies of the 3a1 and 1b1 H2 O orbitals in the gas phase are displayed (vertical lines), as are two representative eigenstates from the 3a1 and 1b1 resonances for H2 O adsorbed in its equilibrium structure. (b) Isosurface of difference electron density for H2 O on Pt(111). This was obtained by subtracting from the adsorption system the densities of a clean Pt slab and a H2 O molecule. Dark (light) regions correspond to a density decrease (increase) of 3.6 × 10⁻² eÅ−3 .
(Fig. 3a). A careful examination of the real space distribution of the individual eigenstates within each of the two peaks displayed in Fig. 3a reveals that states within the lower energy peak are mainly 3a1 -d states and states within the higher energy peak are mainly of 1b1 -d character. A representative example from each peak, for H2 O in its equilibrium structure, is displayed in Fig. 3a. The approximate energies of the 3a1 and 1b1 orbitals in the gas phase are also shown in Fig. 3a2 . By comparing the energy of the gas and adsorbed phase peaks and also by inspection of the individual eigenstates, it is found that when H2 O is upright (dotted line) on Pt the 3a1 derived orbitals mix most strongly with the surface and consequently experience the greatest stabilization. On the other hand when H2 O lies flat (solid line) the 1b1 derived orbitals undergo the largest mixing with the surface and experience the greatest stabilization. However, given that initially the 1b1 orbital is closer to the Fermi level, orientations that maximize this interaction will be preferred. For a fuller discussion on this issue the interested reader is referred to [15, 39]. 3 3.1
H2 O diffusion H2 O monomer diffusion
After the examination of H2 O adsorption, it is natural to enquire about H2 O diffusion. Despite the numerous theoretical investigations of H2 O on model metal surfaces none has explicitly examined the diffusional PES of H2 O on a metal surface. Thus activation energies for H2 O diffusion on metal surfaces have not been calculated. Rather it has been assumed that the barrier to diffusion can be obtained by comparing adsorption energies at different high symmetry sites. Whether or not this is a reasonable assumption to make is now tested for the specific case of H2 O on Al(100) [40]. 2 These
are obtained by aligning the energies of the low energy 2a1 orbital in the gas phase and on the surface.
418
Applied Physics A – Materials Science & Processing
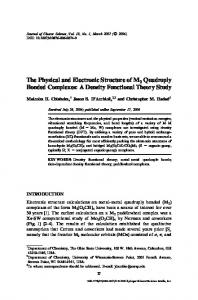
Variations in H2 O adsorption energy as a function of the lateral displacement of O from its original atop site for the four H2 O diffusion routes investigated on Al(100). The structure of the initial, transition and final states of each pathway are also shown. The solid lines connecting the data points are guides to the eye FIGURE 4
On Al(100) the atop site is again identified as the preferred one for H2 O adsorption. From this site we then sought to investigate how a H2 O would negotiate its way across the Al(100) surface. Since we find that H2 O does not adsorb at fourfold hollow sites on this surface, only diffusion mechanisms between bridge and atop sites were examined. The initial, final, and transition states, and the energy profile of four specific pathways examined are shown in Fig. 4. Table 2 lists the activation energies ( E a ) determined for these four diffusion routes. The activation energies range from 307– 327 meV. It is clear, therefore, that all diffusion mechanisms have reasonably similar activation energies. This implies that given a H2 O at an atop site on Al(100) it does not have a strong preference for a particular direction in which to diffuse. An examination of the energy profiles for each route (Fig. 4) reveals that they exhibit some interesting characteristics. The most striking features of the calculated energy profiles are the minima at 0.05– 0.10 Å from the precise atop sites. This is most apparent for routes labeled III and IV where ∼ 60 meV minima are located on either side of the precise
Route I II III IV
E a (meV)
∆Top–Bridge (meV)
307 309 327 309
292 299 225 247
Activation energies (E a ) for H2 O diffusion along the four pathways investigated, as shown in Fig. 4. E a is the total energy difference between the highest and lowest energy points along each route. The total energy differences between H2 O at the atop and bridge sites (∆Top–Bridge ) along each route are also shown. TABLE 2
atop site. These minima demonstrate that H2 O prefers to be displaced slightly from the precise atop sites. Indeed structure optimizations with H2 O allowed to fully relax, i.e., with no constraints on the O position, confirm this. In practice, therefore, when H2 O adsorbs on Al(100) it will be displaced slightly from the precise atop site. In fact our calculations indicate that the precise atop is not an energy minimum on the multidimensional PES. An implication for diffusion is that there tends to be a small energy barrier, the magnitude of which depends on the orientation of H2 O, for H2 O to move from one side of the precise atop site to another. The second thing we note from Fig. 4 is that the energy profiles are reasonably symmetric about the highest energy points, which tend to be located at bridge sites. For route IV this is trivial since the bridge site is a mirror plane along this route. Routes I and II exhibit a small asymmetry in energy on either side of the bridge site, on the order of 50 meV. Route III, however, stands out as it clearly exhibits the greatest asymmetry. Indeed in this case the barrier for diffusion is not even located over a bridge site, rather it is displaced towards the final atop site. Thus for H2 O diffusion in this orientation there is a small barrier (25 meV) between the bridge site and the final atop site (Fig. 4). It is clear from the energy profiles displayed in Fig. 4a–d that the bridge site is not an energy minimum. Rather it tends to be an energy maximum. Given that the fourfold hollow sites and the precise atop sites are also not minima, then none of the high symmetry sites are minima on the PES. However, as stated above, minima are located very close to the atop sites. Often it is assumed that the diffusion barrier for an adsorbate can be simply predicted from the difference in adsorption energies at the most stable and the next most stable high symmetry adsorption sites. An important consequence of the complexities in the diffusional potential energy surfaces shown in Fig. 4, however, is that this is clearly not the case for H2 O diffusion on Al(100). The barriers obtained for each route are always larger than the binding energy difference for H2 O at the atop and bridge sites. These comparisons are made in Table 2 where it can be seen that the differences in binding energies between bridge and atop sites range from 225 – 299 meV (depending on the orientation of H2 O) whereas the diffusion barriers are between 307 and 327 meV. The results presented here clearly reveal that in order to accurately determine the activation energy for the diffusion of H2 O monomers on Al(100) it is necessary to explicitly calculate points on the PES between the atop and bridge sites. 3.2
H2 O dimer diffusion
After examining H2 O monomer adsorption and diffusion, it is natural to make the (small) leap to look at adsorption and diffusion of H2 O dimers. Prompted by the remarkable experimental observation that H2 O dimers diffused circa 104 times faster than H2 O monomers on Pd(111) [18], the adsorption and diffusion of H2 O monomers and dimers was examined on Pd(111) [41]. First, H2 O monomer diffusion was examined. By careful exploration of the PES between the various high symmetry sites on Pd(111), with the H2 O monomer in different orientations, as done above for the case of a H2 O monomer on
MICHAELIDES
Density functional theory simulations of water–metal interfaces
419
bond acceptor H2 O, A). Compared to the H2 O monomer, the D H2 O is 0.10 Å closer to the surface and interacts strongly with it, whereas the A H2 O interacts weakly with the substrate at 2.90 Å from it. In fact, the A water can easily rotate around the low lying D water to which it is tethered ( Fig. 5a and b), with a barrier of only 0.02 eV. Facile rotation of the high lying A H2 O is a key observation and it strongly influences the preferred dimer diffusion mechanism. Mechanisms for the diffusion of the dimer across the Pd(111) surface were investigated. These involved simultaneously translating both H2 O molecules in the dimer across bridge and threefold hollow sites in a number of different orientations. In addition, diffusional processes with each molecule in the dimer adsorbed at different surface sites were considered. However, the lowest diffusion barrier identified for the dimer was 0.26 eV. Thus the lowest calculated diffusion barrier for the dimer is about 30% higher than the corresponding barrier for a single H2 O monomer, apparently the opposite of what is seen experimentally. If dimers cannot diffuse faster than monomers through simple translation mechanisms, one must look to mechanisms involving internal rearrangement of the dimer that may explain the STM findings. In particular, we recall that the H bonds in small water clusters rapidly rearrange through quantum tunneling, as shown by vibration rotation tunneling spectroscopy [42]. The donor–acceptor interchange tunneling in the gas phase water dimer, for example, has a tunneling rate of 109 s−1 through a ∼ 25 meV barrier [42]. This is several orders of magnitude faster than the highest diffusion rates measured by STM. Indeed, we now show how this facile H exchange and the quasi-free rotation of the dimer, can yield an unexpected mechanism for dimer diffusion. An example mechanism is shown in Fig. 5, which can be summarized by the following sequence of events:
Proposed mechanism for H2 O dimer diffusion on Pd(111) (side and top view). Step (a) to (b) involves a nearly free rotation of the dimer. Step (b) to (c) is the wagging motion of the dimer, which brings both H2 O molecules to a similar height above the surface from where they can undergo donor–acceptor tunneling interchange (c) – (e). From step (e) to (f), the dimer restores its equilibrium geometry having translated one lattice spacing (compare (a) and (f)) FIGURE 5
Al(100), we find that the lowest energy diffusion pathway goes from near-atop to near-atop sites via the bridge site. The barrier for this process is 0.19 eV. The structure of the adsorbed H2 O dimer was then examined. The most stable adsorbed dimer identified is displayed in Fig. 5a. This adsorbed dimer exhibits several interesting characteristics that we shall not discuss here, except to mention that the heights of the H2 O molecules above the surface differ substantially: the low lying H2 O molecule (H-bond donor, D) is 0.50 Å closer to the substrate than the high lying one (H-
(i) Rotation of the dimer around an axis perpendicular to the surface going through the oxygen in D and the Pd underneath. The low barrier (0.02 eV) translates into a basically unhindered rotation. The result of this step is that the A water is now located above a different Pd atom. (ii) A “wagging” vibrational mode of the adsorbed dimer, with a frequency of ∼ 100 cm−1 , brings the A molecule closer to the surface while the height of the D molecule remains essentially unchanged. The energy required to bring both oxygens to the same height above the surface, E a1 , is 0.11 eV. (iii) The H2 O molecules then exchange their roles as H-bond donor and acceptor molecules (Fig. 5c–e). The transition state for this process has a twofold rotation axis perpendicular to the surface, passing through the center of mass of the H2 O dimer (Fig. 5d) and the barrier, E a2 , is again 0.11 eV. (iv) Once the two molecules have interchanged their respective roles as donor and acceptor of the H bond, the dimer restores its asymmetric equilibrium structure. The result of this “molecular waltz” is a net translation of the dimer by a surface lattice spacing [43]. Allowing for tunneling through the barrier E a2 , as is observed for this process in the gas phase, leads to estimated diffusion rates for H2 O dimer diffusion on Pd(111) that can
420
Applied Physics A – Materials Science & Processing Structures of proton ordered H2 O overlayers on transition metals: (a) “H-up” bilayer; (b) “H-down” bilayer; and (c) H2 O−OH−H√overlayer √ on a hexagonal metal surface. The 3 × 3−R30◦ cell used in the simulations is indicated in (a) FIGURE 6
far exceed those of the H2 O monomer. Specifically, estimates based on WKB theory obtained by numerically solving a 1D Schrödinger equation using a model potential barrier of height E a2 predicts that, at the temperature of the experiments (40 K), dimer diffusion is circa two orders of magnitude more rapid than monomer diffusion. Bearing in mind the intrinsic exponential dependence of the diffusion rates on the magnitude of the calculated barriers and the simplicity of the tunneling estimates, one finds this qualitative level of agreement quite satisfactory. Suggestions on how to experimentally test this novel waltzing mechanism for H2 O dimer diffusion have been made [41], and it remains to be seen if this mechanism can be confirmed. Nonetheless it demonstrates that H-bonding interactions may be able to assist diffusion of molecules across metal surfaces.
and noble metal surfaces [55]. Specifically we looked at adsorption on the (111) facets of Ni, Cu, Rh, Pd, Pt and Ag, and on the (0001) facet of Ru3 . Our primary aim was to elucidate the interplay between adsorbate–substrate and H bonding interactions in dictating the stability of H2 O–ice and dissociated overlayers. By analyzing the H2 O adsorption energies, we find that variations in the stability of each type of overlayer depends mainly on variations in adsorbate–substrate bonding, and not on variations in H bonding as previously assumed [1]. In addition, we reveal that the tendency for H2 O dissociation in the bilayers depends mainly on the OH –metal bond strength in the final state. Table 3 lists the “total H2 O adsorption energy” per H2 O molecule, E ADS-TOT, in the various overlayers on each surface. We define E ADS-TOT as,
4
where E 2H2 O/M is the total energy of the adsorbed H2 O bilayer or H2 O−OH−H overlayer; E H2 O is the total energy of a single H2 O molecule in vacuum; E M is the total energy of the bare metal slab; and 2 is the number of H2 O molecules (H2 O molecule equivalents) in the adsorbed bilayers (H2 O−OH−H overlayers) per cell. The overlayers listed in Table 3 include the H-up and H-down intact bilayers as well as two H2 O−OH−H overlayers: One H2 O−OH−H overlayer is displayed in Fig. 6c and has the chemisorbed H located at an atop site in the centre of the H2 O−OH hexagonal network. In the other H2 O−OH−H overlayer (referred to as H2 O−OH + H/M) the chemisorbed H atom has been removed to a separate cell and allowed to adsorb at its favored threefold fcc site on the clean metal surfaces4 . This H2 O−OH + H/M state, therefore, models the scenario in which H atoms “escape” from the H2 O−OH overlayer and adsorb on patches of clean surface. A consideration of E ADS-TOT for the intact bilayers reveals that on all substrates the total bilayer adsorption energies are
2D Ice growth
When it comes to the question of 2D water overlayers on transition metals there remain major gaps in our understanding. On the late transition metal surfaces, in particular those with hexagonal symmetry, 2D H2 O adsorption is traditionally thought to proceed through bilayer formation. The lower set of H2 O molecules in the bilayer lie nearly parallel to the surface, with each molecule involved in three H bonds. The higher lying set have their molecular axes in the plane of the surface normal. Only one OH bond from each H2 O of this type is implicated in the H bond network. The other OH bonds are “free”, and practically since the advent of surface science, it had been assumed that these free OH bonds point away from the surface (“H-up” model, Fig. 6a). Recently, however, on Pt(111) it was shown that these OH bonds are instead directed at the surface (“H-down” model, Fig. 6b), resulting in a rather compressed H2 O bilayer [28]. And on Ru(0001), it has been argued that the free OH bonds are broken and that H2 O wets Ru(0001) as a H2 O−OH−H “partially dissociated” adlayer (Fig. 6c) [44]. Clearly the picture that is emerging for H2 O adsorption on metal surfaces is more complicated than had been anticipated and, in fact, currently the focus of an intense (sometimes heated) debate [15, 28, 44–54]. Here, we examine intact H2 O bilayer and dissociated H2 O−OH−H overlayer adsorption on a range of transition
E ADS-TOT = (E 2H2 O/M − 2E H2O − E M )/2
(1)
√ √ i.e., proton ordered, bilayers in 3 × 3−R30◦ cells have been employed throughout the H2 O bilayer calculations discussed in this section – Sect. 4 √ √ 4 H adsorption in 3 × 3−R30◦ cells has been investigated at threefold fcc, bridge and atop sites. On every surface considered here the fcc site is the most stable one. 3 Idealized,
MICHAELIDES
Density functional theory simulations of water–metal interfaces
H-up Ni(111) Cu(111) Ru(0001) Rh(111) Pd(111) Pt(111) Ag(111)
−0.42 −0.45 −0.54 −0.53 −0.52 −0.46 −0.46
E ADS-TOT (eV/H2 O) H-down H2 O−OH−H −0.37 −0.43 −0.50 −0.55 −0.56 −0.49 −0.48
−0.12 −0.07 −0.77 −0.51 −0.16 −0.31 +0.26
421
H2 O−OH + H/M −0.62 −0.40 −1.00 −0.78 −0.56 −0.38 −0.05
√ √ Adsorption energies for 3 × 3−R30◦ intact and partially dissociated overlayers. The most stable overlayer(s) on each surface is (are) indicated in bold. TABLE 3
reasonably similar; ranging from − 0.37 eV on Ni (H-down) to − 0.56 eV on Pd (H-down). In addition, on every surface the stability of the H-up and H-down bilayers is comparable (within 0.05 eV). In contrast the total adsorption energies of the H2 O−OH−H and H2 O−OH + H/M overlayers vary considerably on the different substrates; ranging from a maximum of − 1.00 eV on Ru to a minimum of + 0.26 eV on Ag. Moreover, the dissociated overlayers with the chemisorbed H atoms, once removed to separate unit cells are always more stable. This is a reflection of the greater stability of H atoms at threefold over atop sites. However, the most important information contained within Table 3 is that we can identify the overlayer that, within the current computational set-up, is thermodynamically most stable on each substrate. Table 3 reveals that intact bilayers are favored over dissociated overlayers on Ag (H-down) and Pt (H-down) by 0.43 and 0.11 eV/H2 O, respectively. On Ru, Rh and Ni, dissociated overlayers are preferred over intact bilayers by 0.46, 0.23 and 0.20 eV. On Cu the H-up bilayer is marginally favored (0.05 eV) over the dissociated overlayer and on Pd the intact (H-down) bilayer and partially dissociated overlayer are, to within the accuracy of the calculations, equally stable5 . Of the overlayers investigated in this study, the most stable, thermodynamically are identified in Table 3. This is not to suggest, however, that these are the overlayers that will necessarily form experimentally. Where partially dissociated overlayers are predicted to be stable, formation will occur only when the kinetic barriers to dissociation are not prohibitively large. It may also be required that subsequent barriers, such as H diffusion out of the H2 O−OH overlayers, are overcome. Assuming, for example, that in the H2 O−OH−H overlayers, H remains at the atop site (Fig. 6c), it is only on Ru that the H2 O−OH−H overlayer is predicted to be more stable than either type of intact bilayer. Many H2 O bilayer adsorption studies have speculated about the balance between H bonding and H2 O–metal bonding. Here, we decompose E ADS-TOT into these two contributions and quantitatively investigate their interplay. This decomposition has been performed for each of the three types of overlayer. Here we just discuss results for intact “H-up” bi5 Zero
point energies (ZPE) are not included in the calculations. On Ru(0001) it was shown that an OH−H2 O overlayer has a lower ZPE than a bilayer of intact H2 O molecules by 53 meV [P.J. Feibelman, Phys. Rev. B 67, 035 420 (2003)]. If similar ZPE differences exist on Cu(111) and Pd(111) then this would make the intact and partially dissociated overlayers energetically degenerate on Cu and tip the balance on Pd slightly in favour of the partially dissociated overlayer.
(a) H2 O adsorption energy and its decomposition into adsorbate-substrate and H bonding contributions for H-up bilayers on several close-packed metal surfaces as a function of the calculated substrate lattice constant. Each quantity is defined in the text. (b) Bilayer dissociation energy against OH adsorption at atop sites and H adsorption at threefold fcc sites on metal surfaces. The dotted line is a least squares fit to the OH points, which are labeled (diamonds) FIGURE 7
layers, since the conclusions reached apply equally to all three overlayers. Two complementary approaches have been used to estimate the relative importance of H2 O−H2 O and H2 O–metal bonding. In the first, we estimate the amount of H-bonding per H2 O molecule, E H-BOND(1) , from the following: E H-BOND(1) = (E BILAYER − 2E H2O )/2
(2)
where E BILAYER is the total energy of a bilayer in vacuum fixed in the structure it assumes when adsorbed6 . The bonding between the bilayer and the substrate, E ADS-BILAYER(1) , is then estimated per H2 O molecule as a bilayer adsorption energy: E ADS-BILAYER(1) = (E 2H2 O/M − E BILAYER − E M)/2.
(3)
The second approach takes advantage of the fact that in a bilayer the majority of the H2 O–metal bonding is through the low lying H2 O molecules. And so here we make the approximation that the total bilayer–substrate bonding, E ADS-BILAYER(2) , is equivalent to the chemisorption energy of a H2 O monomer, E ADS-MONO. Thus the bilayer–substrate adsorption energy per H2 O molecule is: E ADS-BILAYER(2) ≈ (E ADS - MONO )/2 = (E H2 O/M − E H2 O − E M )/2 6 Allowing
(4)
for local relaxation in the bilayers does not appreciably change the energetics.
422
Applied Physics A – Materials Science & Processing
where E H2 O/M is the total energy of a single adsorbed H2 O monomer. The H bonding per H2 O molecule within this scheme, E H-BOND(2) , is taken as the difference between the total H2 O adsorption energy and E ADS-BILAYER(2) : E H-BOND(2) = E ADS-TOT(1) − E ADS-BILAYER(2) .
(5)
In any energy partitioning scheme, a unique decomposition of the adsorption energy will not be arrived at, and, inevitably, there are limitations upon the schemes employed here. The first does not take account of H bond changes during adsorption of the bilayers, and the second assumes that the H2 O–metal bonding in the system remains constant upon adsorption of the second layer of H2 O molecules on top of the first7 . However, these standard approximations for adsorption energy decompositions are justified here by the finding that both approaches predict the same general trends and yield H-bond estimates that differ by ≤ 0.04 eV/H-bond (which can be taken as an error margin on our decomposition estimates). Figure 7a plots the total H2 O adsorption energy, the H bond energies and the H2 O–metal bond energies for the H-up bilayer on each surface, √ shown as a function of the next-nearest neighbor (NNN: 3) metal lattice constant. The energy decompositions reveal the delicate interplay between H2 O–metal and H-bonding in adsorbed bilayers. We highlight three important features. Firstly, the largest proportion of E ADS-TOT is always H bonding; H bonding accounts for ≥ 68% ( E HBOND (2) ) or ≥ 80% ( E HBOND (1) ) of the H2 O adsorption energies. Secondly, H-bonding is nearly always the same, regardless of the substrate; the E HBOND (1) estimates are −0.43 ± 0.01 eV/H2 O and the E HBOND(2) estimates are −0.37 ± 0.02 eV/H2 O. Expressed per individual H bond, the H bond strengths in the adsorbed bilayers are therefore ∼ −0.29 eV/H-bond ( E HBOND (1) ) or ∼ −0.25 eV/H-bond ( E HBOND(2) ). The third noteworthy feature in Fig. 7a is that the observed variations in E ADS-TOT(1) are almost exclusively a result of differences in bilayer–metal bond energies ( E ADS-BILAYER(1) and E ADS-BILAYER(2) ) and not due to H bonding. This finding is important since generally the contrary is assumed to be true [1, 2]. It has been argued that as the mismatch between the substrate lattice constant – specifically the NNN lattice distance – and the NNN O−O distance in ice Ih increases, the H bonding strength in the adsorbed bilayer decreases. Figure 7a shows that for a range of NNN lattice distances (4.33 Å for Ni to 5.04 Å for Ag) straddling the equilibrium value of ice Ih (4.50 Å) this is not the case. Finally, the specific roles played by the H2 O, OH and H moieties in determining the overall stability of the H2 O−OH + H/M overlayers have been examined. We already know that the H2 O monomer adsorption energy, E ADS-MONO, changes little on the substrates considered here (c.f. Fig. 7 and/or Table 1). Therefore, the large variations in the stability of the partially dissociated overlayers must be related to H and OH adsorption. Figure 7b plots the bi7 This
is partly justified through a cancellation of errors: any new H2 O bond formed between the upper H2 O molecules and the substrate will be offset by weakening of the bond between the low lying H2 O molecules and the surface
(a) (175 × 135 Å) STM image of D2 O clusters on Pd(111) at 100 K. (b) (41 × 53 Å) zoom-in image of the lace structure clearly showing star-shaped defected areas (dark in STM). (c) (20 × 20 Å) zoom-in image of the rosette structure FIGURE 8
layer dissociation energy (∆E )8 as a function of E ADS-H and E ADS-OH for every surface. We find that a clear relationship exists between ∆E and E ADS-OH, in that the relative stabilities of the intact and partially dissociated overlayers correlate with the OH adsorption energy. This correlation is not a coincidence; for example the correlation between ∆E and E ADS-H is considerably less pronounced (Fig. 7b). Although the precise value of ∆E on a given surface obviously depends on many factors, the significance of a simple relationship between ∆E and E ADS-OH is clear. It brings understanding and predictions as to when partially dissociated overlayers are thermodynamically favoured over intact bilayers become possible for other substrates. At the present level of theory Fig. 7b indicates that when OH is more strongly bound to atop sites than approximately − 2.4 eV, the partially dissociated overlayers become stable. 5
Quasi-2D ice growth
√ With √ the previous discussion in mind, in which ideal 3 × 3−R30◦ overlayers were considered, the STM images acquired near 0.5 ML coverage of D2 O on Pd(111), are intriguing (Fig. 8) [8]9 The large water clusters observed in experiment exhibit long chains of hexagonal units (Fig. 8a), whose width never exceeds a few hexagonal cells. A lace structure often forms (Fig. 8b), where the hexagonal units combine into extended and narrow chains, with vacant adsorption sites or holes in a periodic network. One also commonly sees seven connected hexagons arranged in a “rosette” (Fig. 8c). All observed √ clusters √ display a honeycomb contrast, internally, with 3 × 3−R30◦ hexagonal symmetry, and enhanced corrugation at the cluster edges. And so we naturally ask what exactly the structures of the observed overlayers are. Are the lace and rosette structures constituted of ice-like, H-up, or H-down clusters? Or, possibly, are some of the water molecules dissociated? Or, are they evidence for a new water overlayer structure? Figure 9a shows a generic overlayer model for 0.5 ML water coverage. The figure illustrates a p(6 × 6) unit cell containing nine flat water molecules (white circles) and another nine species (gray circles), which may be “up” or “down” water molecules or O−H fragments. This structure embodies 8 The
bilayer dissociation energy is the total energy difference between the most stable intact bilayer and the H2 O−OH + H/M overlayer on each surface. 9 Details of the experiments interpreted here are reported in Ref. [18], a paper exploring how water monomers adsorb at 40 K, and how they diffuse and aggregate to form small water clusters.
MICHAELIDES
Density functional theory simulations of water–metal interfaces
423
(a) Illustration of lace-like p(6 × 6) superstructures on Pd(111), built by removing molecules from ice-like bilayers. Pd surface atoms are at the crossings of the thin lines. (b)–(d) Illustration of the mechanism by which planar hexamers bind to each other. In (b) the gray filled hexagons define the “exclusion zone” where another A type hexamer cannot adsorb. (c) Scheme for the lacelike structure constructed after placing tilted species (hatched circles) at the bridging sites. The arrangement of the bridging species extends the exclusion zone to the D2 sites. (d) Scheme for the rosette type structure after placing flat-lying water molecules at the bridging sites. Now, the exclusion zone extends to all D sites. See text for further details
FIGURE 9
the three existing models for extended water overlayer adsorption (c.f. Fig. 6), but with six molecules removed from the unit cell so as to leave a periodic pattern that closely resembles the experimental lace structure of Fig. 8b. Immediately the three existing overlayer models can, however, be ruled out as being the structures of the observed overlayers. First, in the three existing models the species at the lace’s ring edges would alternate between flat (white) and non-flat (gray) molecules. Such alternation should impart threefold symmetry on the contrast of the vacant regions. What is observed, however, is sixfold star-like symmetry (Fig. 8). Second, the exiting models offer no explanation for the fixed width of the chains of the lace structure and the unique diameter of the rosettes.
Guided by the knowledge that isolated H2 O monomers preferentially adsorb on close-packed metal surfaces with both O−H bonds nearly parallel to the surface (Sect. 2) and additional DFT optimizations that identified several relatively stable adsorbed H2 O hexamers comprised mostly of flat-lying H2 O molecules, we therefore explored alternative clustering mechanisms. An example of one such hexamer, composed of six nearly flat H2 O molecules, is shown in Fig. 9b. Proceeding from the ansatz that a flat hexamer is the basic building block during low temperature water clustering, different hexamer aggregates may be generated by invoking the following rule for 2D water growth: Each water molecule prefers to lie approximately parallel to the surface, forming H bonds such that O−O−O angles are about 120◦ . This 2D-water rule may
FIGURE 10 (a) The optimized lace structure. Small gray circles are H atoms below the O atoms (down configuration). The remaining atoms are labeled as in Fig. 9. (b) STM topographic image simulation for this model (with I =0.1 nA and V =100 mV). (c) Same as (b) but for a model where the bridging molecules are O−H species. (d)–(f) Same as (a)–(c) but for the rosette structure
424
Applied Physics A – Materials Science & Processing
be considered as an alternative to the traditional ice rules [1] (and also to one of Doering and Madey’s surface modified ice rules [26]), that requires oxygen atoms to be in a tetrahedral environment. However, since each molecule donates two H bonds but accepts only one, there is an imbalance between donors and acceptors and defect-free networks of flat molecules can never be achieved. Instead defects are necessary, which leads to the lace and rosette structures observed. Let us now consider in detail how this rule leads to the observed lace and rosette patterns. As depicted in Fig. 9b, one may define an exclusion zone around each flat A hexamer (shaded region in the figure) within which another similar flat hexamer cannot adsorb without violating the 2D-water rule. The exclusion zone covers the first (B) and second (C) nearest neighbor sites, leaving sites D as the closest ones where another flat hexamer may adsorb. The key problem, then, is to identify the bonding mechanism between a flat hexamer at A and another at D. The obvious choice is to place a non-flat water molecule at the “bridging site,” with one O−H-bond parallel to the surface and the other dangling, with the H either up or down or missing, in order to respect the 3D ice rules. This is depicted in Fig. 9c, where the six available bridging sites are occupied. Notice that this arrangement facilitates growth along three symmetry equivalent directions [A−D1 in Fig. 9c], but prevents growth along the other three [A−D2 ]. This way, the chain-like geometry and fixed chain width, characteristic of the lace-type structure, are naturally derived. In fact, the structure corresponds to a 2D periodic tiling arising from the combination of flat hexamers and bridging species. On the other hand, if flat molecules are placed at the bridging sites (Fig. 9d), then the growth is inhibited along all six directions, since there is an O−H-bond pointing to all potential D hexamers, extending the exclusion zone. In this case, the nucleus of a rosette structure is left. The rosette is completed by closing each of the six B hexamers with two water molecules, suitably oriented to respect the 3D ice rules (i.e., with at least one of the two non-flat). Thus, all the structures experimentally imaged may now be easily generated by combining flat and/or non-flat molecules at the bridging sites, the former inhibiting the growth while the latter facilitating it. We now use DFT and STM image simulations10 to verify this novel growth model and address the nature of the bridging and edge species in the lace and rosette structures. DFT structure optimizations for the lace model reveal relatively stable phases for both H-down (0.56 eV/H2 O) or hydroxyl (0.53 eV/H2 O) bridging species. The STM image simulations, however, provide clear evidence that the bridging species is a water molecule in an H-down configuration. The model and its associated STM simulated image are presented in Fig. 10a and b; the nice agreement with the experimental image of Fig. 8b is evident. Overall corrugations are 0.6 Å in good accord with the STM data. The out-of-ring O−H bonds of the bridging water molecules protrude into the vacancy region, thus generating the characteristic star shape, while the bridging O atoms appear only slightly brighter than those belonging to flat molecules, despite the fact that they are 0.5 Å 10 STM
simulations reported here were performed with a tight-binding Hamiltonian for the electronic structure and with a one-electron scattering formalism as implemented in the GREEN code [J. Cerd´a, M.A. Van Hove, P. Sautet, M. Salmeron, Phys. Rev. B 56, 15 885 (1997)]
farther away from the surface. STM images simulated when the bridging species are OH molecules, shown in Fig. 10c, are at variance with the experimental images since the oxygens in the hydroxyls yield a markedly smaller tunneling signal (less bright). For the rosettes shown in Fig. 9d, DFT calculations were performed assuming one edge molecule in each of the B hexamers to be initially flat and the other one either in the H-down configuration or half-dissociated. The STM simulations again leave no doubt that the edge species are intact, H-down molecules. The model and the theoretical images are shown in Fig. 10d – f. The agreement is good for the H-down configuration (Fig. 10e), correctly reproducing the brighter contrast at the edges of the cluster. The overall corrugation is 0.7 Å, again within the experimental range. On the contrary, for the O−H configuration (Fig. 10f), the dissociated molecules appear less bright, ruling this model out. 6
Summary
To recap we can summarize some of the most important general conclusions that have been reached from these studies. (i) A general binding mode for H2 O on close-packed metal surfaces has been identified in which H2 O adsorbs preferentially at atop sites and lies nearly parallel to the surface. This binding mode favors interaction of the H2 O 1b1 molecular orbital with the surface. (ii) The potential energy surface for H2 O monomer diffusion is more corrugated than anticipated. There is a small orientational dependence on the magnitude of the computed H2 O diffusion barriers and in every case the barriers are larger than those that would be predicted based on a comparison of H2 O binding energies at atop and bridge sites. (iii) A novel mechanism for H2 O dimer diffusion on metal surfaces has been proposed. The mechanism, which relies on the ability of H bonds to rapidly rearrange through quantum tunneling, demonstrates how H-bonding interactions can assist diffusion on metal surfaces. (iv) The stability of model H2 O−OH−H overlayers varies considerably from metal to metal whereas the stability of the intact bilayers does not. Further, variations in the stability of both types of overlayer are primarily determined by variations in adsorbate–substrate bonding and not by variations in H bonding. In particular the large variations in the stability of H2 O−OH−H overlayers can be traced back to the OH adsorption energy on each surface. Indeed it has been shown that the strength of the OH bond with the substrate is a useful guide to predict if wetting will take place in the form of intact H2 O bilayers or mixed H2 O−OH−H overlayers. (v) A novel ice structure for water in the sub-monolayer regime on Pd(111) has been identified, in which all water molecules remain intact yet the majority lie parallel to the surface. This overlayer model is not based on the puckered hexagonal structure of ice Ih , nor on any recent variations such as the H-down, or dissociated ice models. Instead, we find an arrangement only possible in the submonolayer regime, wherein most of the molecules lie flat against the surface.
MICHAELIDES
Density functional theory simulations of water–metal interfaces
Of course, many more interesting questions related to H2 O and H2 O–ice adsorption on metal surfaces remain to be answered. One that is particularly pertinent to the studies discussed here relates to the precise accuracy of DFT-GGA for treating H2 O–metal adsorption systems. Being weakly bonded adsorption systems, typically also involving H bonds, they are thus challenging systems for modern DFT-GGA methods to describe accurately. Although in the examples discussed here good agreement with experiment has for the most part been obtained, it is not possible to place “error bars” on our structural and energetic predictions. Work on this issue is in progress, as is work on precisely comparing the properties and behavior of light and heavy water adsorption [56]. ACKNOWLEDGEMENTS I am extremely grateful to all the colleagues I’ve worked with on these systems. In particular I’d like to acknowledge the many and valuable contributions from Ali Alavi, Pedro de Andres, Marie-Laure Bocquet, Jorge Cerd´a, Peter Feibelman, Dave King, Victor Ranea, Miquel Salmeron, and Matthias Scheffler. I would also like to thank Matthias Scheffler for carefully reading this manuscript. This work was partially supported by the EURYI scheme. See www.esf.org/euryi.
REFERENCES 1 P.A. Thiel, T.E. Madey, Surf. Sci. Rep. 7, 211 (1987), and references therein 2 M.A. Henderson, Surf. Sci. Rep. 46, 1 (2002), and references therein 3 See, for example G.A. Somorjai, Introduction to Surface Chemistry and Catalysis (Wiley, New York, 1994) 4 J.J. Berzelius, Jahresber. Chem. 15, 237 (1837) 5 S. Volkening, K. Bedurftig, K. Jacobi, J. Wintterlin, G. Ertl, Phys. Rev. Lett. 83, 2672 (1999) 6 A. Michaelides, P. Hu, J. Am. Chem. Soc. 123, 4235 (2001) 7 A. Michaelides, P. Hu, J. Chem. Phys. 114, 513 (2001) 8 J. Cerd´a, A. Michaelides, M.-L. Bocquet, P.J. Feibelman, T. Mitsui, M. Rose, E. Fomine, M. Salmeron, Phys. Rev. Lett. 93, 116 101 (2004) 9 P. Hohenberg, W. Kohn, Phys. Rev. 136, B864 (1964) 10 W. Kohn, L. Sham, Phys. Rev. 140, A1133 (1965) 11 J.P. Perdew, J.A. Chevary, S.H. Vosko, K.A. Jackson, M.R. Pederson, D.J. Singh, C. Fiolhais, Phys. Rev. B 46, 6671 (1992) 12 J.P. Perdew, K. Burke, M. Ernzerhof, Phys. Rev. Lett. 77, 3865 (1996); 78, 1396 (1997) 13 M.D. Segall, P.J.D. Lindan, M.J. Probert, C.J. Pickard, P.J. Hasnip, S.J. Clark, M.C. Payne, J. Phys. C Condens. Matter 14, 2717 (2002) 14 A. Michaelides, V.A. Ranea, P.L. de Andres, D.A. King, Phys. Rev. Lett. 90, 216 102 (2003) 15 A. Michaelides, A. Alavi, D.A. King, J. Am. Chem. Soc. 125, 2746 (2003) 16 M. Morgenstern, T. Michely, G. Comsa, Phys. Rev. Lett. 77, 703 (1996) 17 K. Morgenstern, J. Nieminen, Phys. Rev. Lett. 88, 066 102 (2002)
425
18 T. Mitsui, M.K. Rose, E. Fomin, D.F. Ogletree, M. Salmeron, Science 297, 1850 (2002) 19 K. Morgenstern, K.-H. Rieder, J. Chem. Phys. 116, 5746 (2002) 20 F. Flores, I. Gabba, N. H March, Surf. Sci. 107, 127 (1981) 21 S. Seong, A.B. Anderson, J. Phys. Chem. 100, 11 744 (1996) 22 S. Andersson, C. Nyberg, C.G. Tengstal, Chem. Phys. Lett. 104, 305 (1984) 23 B.W. Callen, K. Griffiths, P.R. Norton, Phys. Rev. Lett. 66, 1634 (1991) 24 M. Nakamura, M. Ito, Chem. Phys. Lett. 325, 293 (2000) 25 T.E. Madey, J.T. Yates, Chem. Phys. Lett. 51, 77 (1997) 26 D.L. Doering, T.E. Madey, Surf. Sci. 123, 305 (1982) 27 S. Meng, L.F. Xu, E.G. Wang, S. Gao, Phys. Rev. Lett. 89, 176 104 (2002) 28 H. Ogasawara, B. Brena, D. Nordlund, M. Nyberg, A. Pelmenschikov, L.G.M. Pettersson, A. Nilsson, Phys. Rev. Lett. 89, 276 102 (2002) 29 A.B. Anderson, Surf. Sci. 105, 159 (1981) 30 E. Sophr, K. Heinzinger, Chem. Phys. Lett. 123, 218 (1986) 31 J.E. Muller, J. Harris, Phys. Rev. Lett. 53, 2493 (1984) 32 H. Yang, J.L. Whitten, Surf. Sci. 223, 131 (1989) 33 S. Meng, E.G. Wang, S. Gao, Phys. Rev. B 69, 195 404 (2004) 34 A. Michaelides, V.A. Ranea, P.L. de Andres, D.A. King, Phys. Rev. B 69, 075 409 (2004) 35 D. Sebastiani, L. Delle Site, J. Chem. Theor. Comput. 1, 78 (2005) 36 P. Vassilev, R.A. van Santen, M.T.M. Koper, J. Chem. Phys. 122, 054 701 (2005) 37 C.G. S´anchez, Surf. Sci. 527, 1 (2003) 38 N. Pangher, A. Schmalz, J. Haase, Chem. Phys. Lett. 221, 189 (1994) 39 V.A. Ranea, A. Michaelides, R. Ramirez, J.A. Verges, P.L. de Andres, D.A. King, Phys. Rev. B 69, 205 411 (2004) 40 A. Michaelides, V.A. Ranea, P.L. de Andres, D.A. King, Phys. Rev. B 69, 075 409 (2004) 41 V.A. Ranea, A. Michaelides, R. Ramirez, J.A. Verges, P.L. de Andres, D.A. King, Phys. Rev. Lett. 92, 136 104 (2004) 42 R.S. Fellers, L.B. Braly, M.G. Brown, C. Leforestier, R.J. Saykally, Science 284, 945 (1999) 43 An animation of the proposed mechanism for H2 O dimer diffusion can be found at www.fhi-berlin.mpg.de/th/ 44 P.J. Feibelman, Science 295, 99 (2002) 45 D. Menzel, Science 295, 58 (2002) 46 P.J. Feibelman, Phys. Rev. B 67, 035 420 (2003) 47 G. Held, D. Menzel, Surf. Sci. 316, 92 (1994) 48 P.J. Feibelman, Phys. Rev. Lett. 90, 186 103 (2003) 49 K. Andersson, A. Nikitin, L.G.M. Pettersson, A. Nilsson, H. Ogasawara, Phys. Rev. Lett. 93, 196 101 (2004) 50 J. Weissenrieder, A. Mikkelsen, J.N. Andersen, P.J. Feibelman, G. Held, Phys. Rev. Lett. 93, 196 102 (2004) 51 S. Meng, E.G. Wang, C. Frischkorn, M. Wolf, S. Gao, Chem. Phys. Lett. 402, 384 (2005) 52 C. Clay, S. Haq, A. Hodgson, Chem. Phys. Lett. 388, 89 (2004) 53 G. Materzanini, G.F. Tantardini, P.J.D. Lindan, P. Saalfrank, Phys. Rev. B 71, 155 414 (2005) 54 P.J. Feibelman, Chem. Phys. Lett. 389, 92 (2004) 55 A. Michaelides, A. Alavi, D.A. King, Phys. Rev. B 69, 113 404 (2004) 56 A. Michaelides, M. Scheffler, unpublished