disciplinary Analysis and Optimization, J. Sobieski, ... tion Using Designed Experiments", John Willey & ... cal Design and Analysis of Experiments, John Wiley.
DEPENDENCE OF OPTIMAL STRUCTURAL WEIGHT ON AERODYNAMIC SHAPE FOR A HIGH SPEED CIVIL TRANSPORT V. Balabanov�, M. Kaufman�, D. L. Knill�, D. Haimy, O. Golovidov�, A. A. Giunta� Multidisciplinary Analysis and Design (MAD) Center for Advanced Vehicles Virginia Polytechnic Institute and State University Mail Stop 0203, Blacksburg, Virginia 24061 Raphael T. Haftkaz, Department of Aerospace Engineering, Mechanics and Engineering Science, University of Florida Gainesville, Florida 32611-6250 B. Grossmanx, W.H. Mason{ and L.T. Watson# MAD Center for Advanced Vehicles, Virginia Tech
Abstract
A procedure for generating a customized weight function for wing bending material weight of the High Speed Civil Transport (HSCT) is described. The weight function is based on the shape parameters. A response surface methodology is used to t a quadratic polynomial to data gathered from a large number of structural optimizations. The results of the structural optimization are noisy. Noise reduction in the structural optimization results is discussed. Several techniques are used to minimize the number of required structural optimizations and to maintain accuracy. Simple analysis techniques are used to nd regions of the design space where reasonable HSCT designs could occur, thus customizing the weight function to the design requirements of the HSCT, while the response surfaces themselves are created employing detailed analysis methods. Intervening variables and analysis of variance are used to reduce the number of polynomial terms in the response surface model functions. Minimum variance and minimum bias procedures for creation of response surfaces are compared. Con guration optimization of the HSCT employing customized weight functions with di�erent response surfaces are compared.
1. Introduction
that completely de nes the HSCT design problem using twenty-eight design variables. Twenty- ve of the design variables describe the geometry of the aircraft, and three variables describe an idealized cruise mission and fuel weight 1;2. In the conceptual and preliminary design phases statistically-derived, experience-based algebraic models, known as weight functions or weight equations, are often used to estimate weights of all components. However, these weight functions may not accurately predict weights of some components of relatively new conceptual designs, such as HSCT, because they are derived mainly from existing aircraft data. As a part of the con guration optimization, we estimate structural weight using an algebraic weight function (weight equation) from the Flight Optimization System (FLOPS) 3. Previous studies showed good correlation for structural weight prediction between FLOPS and structural optimization 4. However, work by Huang et al.4 also indicated that the FLOPS weight equation may not be accurate in estimating wing bending material weight, when it is necessary to take into account planform shape changes. Consequently, we
The design of a High Speed Civil Transport (HSCT) con guration is an active research topic at the Multidisciplinary Analysis and Design (MAD) Center for Advanced Vehicles at Virginia Tech. Our design goal is to minimize takeo� gross weight for a range of 5500 nautical miles, a cruise Mach number of 2.4, while carrying 251 passengers. We have developed a model � Graduate Research Assistant, Dept. of Aerospace & Ocean Eng., Student Member AIAA y Graduate Research Assistant, Dept. of Computer Sci. and Math. z Professor, Associate Fellow AIAA x Professor, Dept. Head, Dept. of Aerospace & Ocean Eng., Associate Fellow AIAA { Professor, Dept. of Aerospace & Ocean Eng., Associate Fellow AIAA # Professor, Dept. of Computer Sci. and Math. c 1996 by V. Balabanov. Published by the Copyright American Institute of Aeronautics and Astronautics, Inc. with permission.
1 American Institute of Aeronautics and Astronautics
Several approaches were tried in order to reduce the cost of generating the response surface. First, a previously developed statistical weight function was used to identify a small set of geometric and loading parameters which characterize the wing bending material weight objective function. This reduced set of variables was then employed to reduce the dimension of the model function. Second, simple analysis techniques were used to identify a reasonable design space where the optimum design may be located. Finally, a xed number of reasonable designs were picked using statistical design of experiments techniques to produce response surfaces that re ect the entire reasonable design space. Only at these designs were structural optimizations performed. The large number of structural optimizations required make this problem especially suitable for coarse grain parallelization. A nite-element-based structural optimization code GENESIS5 , was used to optimize the design con gurations. A coarse-grain parallelization of GENESIS on the Intel Paragon yielded reasonable speedups and greatly accelerated the creation of the response surface. By its nature, the response surface is a simple algebraic expression that provides smooth derivative information. Although initially expensive to establish, the surface uses minimal resources once implemented. This makes it ideal for the HSCT design problem. To demonstrate the response surfaces' suitability to design, optimizations of the HSCT con gurations are performed. Results are presented with and without the implementation of the response surface. This paper is a direct continuation of the work presented in Refs. 6 and 7. The problem discussed in the present paper was rst formulated and solved in Ref. 6, where Kaufman et al. described in details its statistical and computational aspects. It was found there that structural optimization data used for creation of the response surface was noisy, but the origin of the noise was not identi ed. Reference 7 described structural aspects of the problem in more detail and identi ed the major source of the noise as coming from aerodynamic loading. However, the noise was not reduced signi cantly. In the present paper the aerodynamic noise is traced to the camber optimization of the wing and results with substantial less noise are obtained. Accuracy of the response surfaces with and without noise are compared. Additionally, two alternative design of experiment techniques for selecting con gurations for structural optimization are compared. Results of HSCT optimization using the alternative response surfaces are also compared.
have been working on the implementation of structural optimization for estimating structural bending material weight into the con guration optimization. One may consider complete coupling of the structural optimization with the con guration optimization process. However, this approach is di�cult for several reasons. First, the wing bending material weight obtained as a result of structural optimization is not a smooth function of the con guration design variables. This is due to changes in the set of active constraints as the con guration changes and numerical noise which includes incomplete convergence of the structural optimization as well as noise in the aerodynamic loads. Therefore, a derivative-based optimization would be di�cult to perform. Second, the con guration design process requires structural weight informationat a large number of design points and one does not know beforehand for which points in the design space structural optimization should be performed. These points are determined by the optimizer performing the con guration optimization. The di�culties described above and the expense of structural optimization make complete coupling of the structural optimization with the con guration optimization process unrealistic for HSCT design. Coupling unrelated optimization processes also introduces code integration problems. Di�erent optimization software packages utilize di�erent design variables, input parameters, and output formats. Additional software could be developed to automate code interaction. However, this is rarely a straightforward process. Moreover, such software produces ine�ciencies on modern high performance computers. The objective of this paper is to investigate the noisy behavior of the structural weight computed by structural optimization and to describe a response surface approach that may be used to lter out this noise. Instead of performing structural optimization during the con guration design process, structural optimization is performed for a large number of aircraft geometries beforehand. Results of the structural optimizations are then used to create a response surface to the wing bending material weight. Since the geometries are based on the con guration design variables, code integration problems are eliminated. While one desires accurate results throughout the entire design space, it is impractical to perform structural optimization for every conceivable HSCT con guration. For this reason, techniques are developed to limit the design space domain and to balance the response surface accuracy with development cost. These methods are not speci c to the wing bending material weight and can be applied to many response surface applications.
2. HSCT Design Problem
In research conducted by members of the Multidisciplinary Analysis and Design (MAD) Center for Advanced Vehicles at Virginia Tech, the design problem is the optimization of an HSCT con guration to minimize takeo� gross weight (TOGW) for a range of 5500 2
American Institute of Aeronautics and Astronautics
nautical miles and a cruise Mach number of 2.4, while carrying 251 passengers. The choice of gross weight as the objective function directly incorporates both aerodynamic and structural considerations, in that the structural design directly a�ects aircraft empty weight and drag, while aerodynamic performance dictates the drag and thus the required fuel weight. Trim and control requirements are also explicitly treated. To successfully perform aircraft con guration optimization it is very important to have a simple, but meaningful mathematical characterization of the geometry of the aircraft. Our design group at Virginia Tech has developed a model that completely de nes the HSCT design problem using twenty-eight design variables (listed in Table 1).
the constant climb rate used in the range calculation. No design variables are used to describe the camber distribution. Instead, camber is generated by Carlson's program WINGDES8. In this study, a baseline HSCT is used to provide a point near the interior of the feasible design space. The baseline geometry is the one that was thought to be optimal previously9, (Table 1). Because of modi cations and improvements to our analysis methods, this geometry no longer satis es all of the performance constraints. However, more recent optimal designs show similar characteristics. Table 2. Constraints on the HSCT design.
Number
Table 1. HSCT design variables and baseline values.
Number Value 1 2 3 4 5 6 7 8 9 10 11 12 13 14 15 16 17 18 19 20 21 22 23 24 25 26 27 28
181.48 155.9 49.2 181.6 64.2 169.5 7.00 75.9 0.40 3.69 2.58 2.16 1.80 2.20 1.06 12.20 3.50 132.46 5.34 248.67 4.67 26.23 33.09 322,617 64,794 33.90 697.9 713.0
Description
1 Range � 5,500 nmi 2 Landing angle of attack � 12� 3 CL at landing speed � 1:0 4-21 Landing section CL � 2:0 22 Fuel volume � 50% wing volume 23-40 Wing chord � 7.0 ft 41 LE break, y � wing semi span 42 TE break, y � wing semi span 43 Root chord t/c > 1.5% 44 LE break chord t=c > 1.5% 45 TE break chord t=c > 1.5% 46 Fuselage: xr est1 � 5 ft 47 Fuselage: xr est1 + 10ft � xr est2 48 Fuselage: xr est2 + 10ft � xr est3 49 Fuselage: xr est3 + 10ft � xr est4 50 Fuselage: xr est4 + 10ft � 300ft 51 Nacelle 1, y � side-of-body 52 Nacelle 1, y � nacelle 2, y 53 Engine out stability criterion 54 Minimum airfoil section spacing at wing tip 55-56 No engine scrape at landing angle-of-attack 57-58 No engine scrape at landing angle-of-attack, with 5� roll 59 No wing tip scrape at landing angle-of-attack, with 5� roll 60 No wing trailing-edge break point at landing, with 5� roll 61 Crosswind landing capability with aileron de ection only 62 Crosswind landing capability with aileron and rudder de ection 63 Rudder de ection � 22.5� 64 Takeo� rotation must occur prior to reaching 90% of takeo� velocity 65 Root trailing-edge must not overlap root leading-edge of horizontal tail 66-67 Required engine thrust � available thrust
Description
Wing root chord (ft) LE break point, x (ft) LE break point, y (ft) TE break point, x (ft) TE break point, y (ft) LE wing tip, x (ft) Wing tip chord (ft) Wing semi-span (ft) Chordwise max. t=c location LE radius parameter Airfoil t/c at root (%) Airfoil t/c at LE break (%) Airfoil t/c at tip (%) Fuselage restraint 1, x (ft) Fuselage restraint 1, r (ft) Fuselage restraint 2, x (ft) Fuselage restraint 2, r (ft) Fuselage restraint 3, x (ft) Fuselage restraint 3, r (ft) Fuselage restraint 4, x (ft) Fuselage restraint 4, r (ft) Nacelle 1, y (ft) Nacelle 2, y (ft) Mission fuel (lbs) Starting cruise altitude (ft) Cruise climb rate (ft=min) Vertical tail area (ft2 ) Horizontal tail area (ft2 )
Twenty- ve of the design variables describe the geometry of the aircraft and can be divided into ve categories: wing planform, airfoil shape, tail areas, nacelle placement, and fuselage shape. In addition to the geometric parameters, three variables de ne the idealized cruise mission. One variable is the mission fuel and the other two are initial cruise altitude and 3
American Institute of Aeronautics and Astronautics
Sixty-seven geometry, performance, and aerodynamic constraints are included in the optimization. They are necessary to prevent the optimizer from creating physically meaningless designs. Aerodynamic and performance constraints can only be assessed after a complete analysis of the HSCT design; however, the geometric constraints can be evaluated using algebraic relations based on 28 design variables. Thus we get the opportunity to e�ciently identify reasonable designs from the point of view of planform geometry, eliminating nonsensical designs where, for example, tip chord of the wing is greater than root chord. The geometric, performance and aerodynamic constraints are listed in Table 2. More details are presented in Refs. 4, 10.
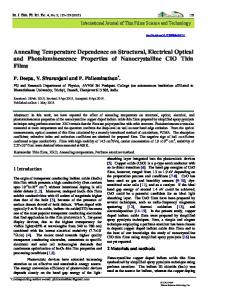
consist mostly of the weight of the spar caps and skin panels. It accounts for about 4:5% of the gross takeo� weight. However, the entire wing structural weight was the objective function of the structural optimization. After optimization was performed, wing bending material weight was calculated based on thickness of speci c portions of the wing. A special mesh generator was implemented to automatically create a nite element model based on the twenty-eight HSCT design variables. This mesh generator created the nite element nodes and element topology data, estimated the location of non-structural weights, and predicted the geometry of the wing fuel tanks. Fuel was assumed to be stored in thirty-one tanks throughout the aircraft. The loads applied to the structural model were com3. Structural Modeling posed of the aerodynamic and inertia forces. Inertia The goal of performing structural optimization is to loads represented the combined e�ects of non-structural provide wing bending material weight to be used later items, fuel weight, and the distributed weight of the in the overall multidisciplinary optimization process. structure. Aerodynamic loads for supersonic ight Due to the large number of optimizations that must conditions were determined using a supersonic panel be performed to create a response surface, a relatively method, and loads for subsonic ight conditions were simple structural optimization model was used. We from a vortex-lattice method. The structure was asemployed a structural model of the HSCT with a xed sumed to be rigid for the determination of aerodynamic Previous studies indicated that structural exiarrangement of spars and ribs. The wing and fuselage forces. bility did not have a large e�ect on the structural wing skin were modeled by membrane elements. Spar and weight (objective function of the structural optimizarib caps were modeled by rod elements. Vertical rods 4;11. For each tion) for this particular and shear panels were used to model spar and rib webs. design, orientation of thecon guration aerodynamic loads was govBecause of symmetry, we only generate a nite element erned by camber distributions generated by Carlson's model of half the aircraft. The typical nite element program WINGDES 8. A surface spline interpolation (FE) model is made up of 923 elements jointed at 193 method was used to translate forces between aerodynodes with 579 total degrees of freedom (Fig. 1). namic node and structural node locations. Five load cases were considered for the structural optimization (Table 3). More details about loads can be found in Ref. 4. Table 3. Load cases for the structural optimization.
Load Mach Load Altitude case number factor (ft.) % of fuel
Figure 1. Finite element model of HSCT. Forty design variables were used for the structural optimization, including 26 to de ne skin panel thicknesses, 12 for spar cap areas and 2 design variables were used for the rib caps areas. A uniform area and thickness distribution was assumed for elements controlled by one design variable. We apply stress constraints based on Von Mises yield criterion to each panel, spar, and rib cap element. In addition, local buckling constraints were applied. Because of the coarseness of the model, we only employed it to estimate the bending material weight of the structure, and continued to use FLOPS weight equations to estimate other parts of the structural and nonstructural weight. Following the FLOPS weight equation breakdown, the bending material weight was de ned to
1 2 3 4 5
2.4 1.2 0.6 2.4 0.0
1.0 1.0 2.5 2.5 1.5
63175 29670 10000 56949 0
50 90 95 80 100
4. Coarse Grain Parallelization
Due to large number of design variables, the number of structural optimizations needed to be performed beforehand is more than a thousand. To e�ciently perform such a large number of structural optimizations we took advantage of coarse grain parallel computing. Coarse grain parallelization implies that multiple structural optimizations for multiple HSCT designs, are performed simultaneously on separate processors. 4
American Institute of Aeronautics and Astronautics
5. Noise in the Structural Optimization Results
Each processor maintains its own data, so that interaction between the processors is minimal. We organized the parallel computation in a \slave-master" paradigm, with one processor free of computational work. This processor (the master) copies input and output les for the rest of processors (the slaves), checks which processors have nished their work, and assigns new jobs to them. A twenty-eight node Intel Paragon was used for this work. As the number of processors is increased on a distributed memory architecture machine like the Intel Paragon, disk input/output (I/O) limits the e�ciency of the parallel computations. This factor was the primary basis for choosing the GENESIS nite element structural optimization code for implementation in the parallel environment. GENESIS was available from the developer in a reduced I/O form and thus made it an e�ective code to use on the Paragon. GENESIS provides three di�erent optimization methods: method of feasible directions (FDM), sequential linear programming (SLP) and sequential quadratic programming (SQP). We used method of feasible directions for our problem. Figure 2 shows the bene ts of the reduced I/O version of GENESIS. The speedups of a parallel computation is de ned as Ts =Tp where Ts is the serial execution time and Tp is the parallel execution time using p processors. In an ideal situation, speedup would be equal to the number p of processors being used. With the standard version, maximum speedup levels o� at 2.3, regardless of the number of processors, while the reduced I/O version achieves a speedup of 11.7 using 20 processors. This is still rather poor, showing a need for further reduction of I/O.
Unfortunately, the weight obtained by structural optimization is not a smooth function of the con guration design variables. This nonsmoothness is the result of changes in the set of active constraints as the con guration changes and numerical noise which includes incomplete convergence of the structural optimization as well as noise in the aerodynamic loads.
5.1 Design-line plots
A procedure which we use to detect noise in a response quantity is to plot the response along a straight line segment in design space. This plot is sometimes called an � plot 12. The segment is obtained by connecting two close design points:
x = (1 ? �)x + �x ; 0 � � � 1 s
where x is the vector of starting design variables, x is the vector of nal design variables. In order to check the amount of noise in the results of the structural optimization, two close, conventionally looking HSCT designs are chosen as the endpoints of the segment. These designs are referred to as Design #1 and Design #20 (shown in the Figure 3). s
f
140
Design #1 Design #20
120
(feet)
100 80 140 60 120 40 100 20 80
Speedup
0 60 0
25
50
100
Speedup, ( Ts/Tp )
(feet)
Ideal speedup GENESIS, full I/O GENESIS, current
300
200
250
300
20 0
0
50
100
150
The con guration design variables which de ne these two designs di�er by about 3%. Eighteen additional equally spaced designs are taken along the straight line segment connecting two endpoint designs. Figure 4 shows the initially obtained variation in the wing bending material weight from structural optimization for the 20 designs. It appears from the gure that the noise in the structural optimization weight is on the order of 20{30%.
5 0 10 15 20 Number of processors, p
250
Figure 3. First and last designs in � plot
10
5
200
(feet)
15
0
150
(feet)
40
20
f
25
Figure 2. Ideal versus actual speedup for parallel execution of GENESIS. 5
American Institute of Aeronautics and Astronautics
1 10
1.6 104 Wing bending material weight (lb)
Bending material weight (lb)
1.5 104
4
Structural optimization FLOPS
5000
1.2 104
8000 FLOPS SLP
SQP FDM
4000
0
0 0
5
Design
10
15
0
20
5
10
15
20
Design
Figure 5. Wing bending material weight from di�erent structural optimization methods.
Figure 4. Initial noise in wing bending material weight.
5.2 Reduction of noise
We rst explored the possibility that most of the noise in the optimization results was due to unconverged optimization results. Accordingly we tried reducing move limits and tightening convergence criteria. Move limits were reduced from 30% to 10% and stopping convergence criteria were reduced from 1% to 0.1%. This had a favorable but small e�ect. The noise was reduced from 30% to about 29%. We looked for other optimization related noise sources and found that one of the possible sources was the objective function of the structural optimization (total wing structural weight). We found that the total wing structural weight varied less erratically than the bending material weight which was extracted from it. Apparently, the optimization procedure could nd designs with very similar total weight, but with di�erent distributions between the component de ned as the bending material by FLOPS and the rest of the weight. Consequently, the optimization procedure converged to designs with similar total weights as we changed the aerodynamic shape, but di�erent bending-material weights. To overcome this di�culty we tried to make the objective function of the structural optimization closer to the de nition of the wing bending material weight: we relaxed stress and buckling constraints for the portions of the wing whose weight was not included into wing bending material weight. Thus, we assumed that structural arrangement of these portion of the wing should be given. This manipulation of the objective function reduced the noise by another 2%. We also tried three di�erent optimization methods with GENESIS: method of feasible directions (FDM), sequential linear programming (SLP) and sequential quadratic programming (SQP), to see if the noise was method related. The results are presented in Figure 5, which shows that none of the methods has a de nite advantage over the others and that noise is not method related.
The biggest variation along the segment occurs for the design #8. To eliminate any e�ect of optimization convergence, we optimized this con guration starting from the arithmetic mean of the optimal designs #7 and #9. This approach reduced the variation in the wing bending material weight for design #8 by about 5%. Next, we investigated the e�ect of the aerodynamic loads by using the arithmetic mean of the loads from the cases of design #7 and design #9 as a starting point for optimization of design #8. This totally eliminated the variation, showing that the source of most of the noise arose from the loads that were applied to the structure. Figure 6, which shows the spanwise location of the center of pressure (CP) and of the inertia load center (IC) for the ve load cases (LC), supports this conclusion. (The fth load case is for taxiing, where only inertia loads are applied.) Most of the curves have some variation at the design #8. The curve for the second load case (Mach number 2.4, load factor 1.0), which is critical, has the largest variation. In Ref. 13 it was shown that a change of 1.5 ft. in the spanwise location of the center of pressure can change the stresses in the wing by about 20%. This sensitivity of the stresses to the location of the center of pressure is due to the large amount of fuel carried in the wing of the HSCT. The inertia loads associated with the fuel cancel most of the aerodynamic loads, so that small changes in the aerodynamic loads can have large e�ects on the resultant bending moment. These changes in bending moments and stresses in turn have substantial e�ect on the results of the structural optimization. 6
American Institute of Aeronautics and Astronautics
IC IC IC IC
LC#2 LC#3 LC#4 LC#5
CP LC#1 CP LC#2 CP LC#3 CP LC#4 IC LC#1
40
IC IC IC IC
LC#2 LC#3 LC#4 LC#5
35 Spanwise coordinate (ft)
Spanwise coordinate (ft)
40
CP LC#1 CP LC#2 CP LC#3 CP LC#4 IC LC#1
30 25 20
35 30 25 20
15 5
10 Design
15
15
20
0
Figure 6. The spanwise coordinates of the center of pressure and of the inertia load center for 5 load cases. Cambered wing. (wing span is 81:9 ft.) The variations in the inertia center location are mostly due to the fact that distribution of fuel between fuel tanks is optimized separately for each design4 . Results of these independent optimizations are noisy, and they certainly e�ect the wing bending material weight calculations. To further investigate the source of the noise in center of pressure location we studied the way camber is assigned to the wing. As mentioned earlier, camber is optimized by Carlson's program WINGDES which optimizes camber for each particular con guration. Apparently, the camber optimization can be noisy, too. Figure 7 shows the center of pressure and the inertia center locations for uncambered wing designs. The noise in the center of pressure location is totally eliminated. These results indicate that a large portion of the noise in the wing bending material weight was due to separate optimization of the wing camber for each design. Furthermore, we found that the noise was mostly due to incomplete camber optimization. When we adjusted the optimization procedure, we improved the camber design at the cruise CL and obtained much smoother wing camber as a function of wing geometry. That in turn signi cantly reduced amount of noise in the location of the center of pressure (Fig. 8). Due to di�erent camber distribution, the center of pressure for all the cases moved outboard.
5
Design
10
15
20
Figure 7. The spanwise coordinates of the center of presure and of the inertia load center for 5 load cases. Uncambered wing. (wing span is 81:9 ft.) LC#1 old LC#2 old LC#3 old LC#4 old
Spanwise coordinate (ft)
38
LC#1 new LC#2 new LC#3 new LC#4 new
36 34 32 30 28 26 0
5
10 Design
15
20
Figure 8. The spanwise coordinates of the center of presure for 4 load cases. Old and improved camber distribution. (wing span is 81:9 ft.) After optimization of camber distribution was improved, we performed structural optimization for the designs of the � plot (Fig. 9). We obtained a signi cant reduction in the amount of noise in the results of the wing bending material weight. Most of the remaining noise could be attributed to incomplete convergence of the structural optimization, separate optimization of fuel redistribution for each design, and noise left in the locations of center of pressure and center of inertia. The signi cant \shift up" in the absolute values of the wing 7
American Institute of Aeronautics and Astronautics
Wing bending materail weight (lb)
bending material weight is due to signi cant changes in the spanwise coordinate of the center of pressure location. The remaining noise in our results will be ltered out by the response surface approximations. Figure 9 shows the results of one of the response surfaces, discussed later as RS1. 2 104 1.5 104 1 104 FLOPS Str. Opt. Ini. Str. Opt. new RS1
5000 0 0
5
10 Design
15
20
Figure 9. Wing bending material weight for the old and improved camber distribution.
6. Response Surface Approach
The response surface methodology (RSM) approach is not the only way of integrating structural optimization in the overall HSCT design process. For example, a multilevel decomposition approach was successfully used by Rohl et al.14 and an interlacing factor approach was used by a design group at Virginia Tech9 . A broad survey of methods is presented in Ref. 15. Currently, we employ RSM because it provides several attractive features not provided by other approaches. Particularly, it allows disciplinary codes to be executed by specialists a priori to overall design, rather than by generalists in the overall design process. RSM signi cantly simpli es multidisciplinary code integration and helps to lter out the noise in the response. Since the response surface is usually a low-order polynomial, the optimization task becomes computationally simple. RSM is a statistical technique in which smooth functions, typically linear or quadratic polynomials, are used to model system response. In such a model the polynomial coe�cients may be estimated using the method of least squares. To estimate the coe�cients we need data at a certain number of points which is larger than the number of coe�cients. Large ratios between the number of points and number of coe�cients help lter out noise in the data as well as improve the t of the polynomial to the response. For the quadratic polynomial in p variables the number of terms in the model function, n, grows at a rate O(p2 ). Creating a response surface for the n-term polynomial requires a number of points, N, which is larger than, but of the same order of magnitude as
n. However, to maintain good accuracy, we would like the points where we use the response surface to be located within the convex hull of the data points used to construct the surface. To satisfy this for a p-dimensional box we must estimate response at 2p points (at the vertices of the box). Such experimental design, when all the vertices of the p-dimensional box are evaluated, is called full-factorial design and denoted according to the number of the vertices evaluated (2p ). Another commonly used experimental design which includes only 2(p?m) vertices of the p-dimensional box is called 2(p?m) fractional factorial design16. For the twenty-eight design variables describing the HSCT, fullfactorial design corresponds to more than 200 million points, which is certainly impossible to evaluate with present computational capabilities. This problem is often called the curse of dimensionality. Another source of inaccuracy in the response surface is that quadratic polynomials cannot model well higher order variations. Also estimations outside the design space where the response surface was created may produce inaccurate results. Several measures can be taken to address modeling error. First, the number of data points used to create the response surface can be increased so that the convex hull de ned by the known data points encloses a larger portion of the design space. This option increases computational expense and we did not consider it for our high-dimensional problem. Second, the volume of the design space modeled by RSM could be reduced. This will lower the distance between points interior to the convex hull and the boundary of the convex hull. Another option is to reduce complexity of the model function by eliminating unnecessary terms. A statistical technique, analysis of variance6 (ANOVA) enables the less signi cant terms in the polynomial approximation to be identi ed. Finally, the points can be selected so as to minimize modeling error. Once the response surface is generated, its predictive capabilities must be evaluated. This is accomplished by nding the response surface prediction at a series of data points with known responses. Measuring the di�erence between the known and the predicted response yields the information including average error, root mean square (RMS) error6 , and maximum error.
8 American Institute of Aeronautics and Astronautics
6.1 Design of Experiments for Response Surface where V is the volume of the reasonable design space,
m(x) is any monomial term obtained from multiplying a cubic polynomial by a quadratic polynomial, and N is the number of design points used for the response surface.
Techniques for selecting analysis points in the design space is called design of experiments. RSM typically employs structured set of points such as central composite design (CCD)17 . Consider the p-dimensional box centered at the origin of the system of coordinates. Then CCD represents vertices of this box, point at the center and 2p points at the axis of the system of coordinates, located symmetrically with respect to the center of the box. These 2p points are called axial points. However, CCD is only e�ective for a low dimensional regularly shaped design space, which is unlikely to appear in this study, where our design problem is described by 28 design variables. For an irregular design space in high dimensions, there is no simple way of creating a nite number of points that span the entire region. Hence, a very large number of points must be produced knowing that many will fall outside of the feasible design space. The infeasible points can then either be perturbed until they fall within the feasible region, or removed. This process will lead to a large number of points inside the feasible region, but whose geometric distribution is irregular. From these points, a small number must be chosen to construct the response surface. In a previous study18 it was found that the Doptimality criterion19;6 provided a rational means for choosing the location of a given number of these points. This criterion seeks to minimize the variance in the coe�cients of the response surface due to noise in the data. This is accomplished by maximizing the determinant of the normal equations used to obtain coe�cients. The D-optimality criterion provides maximum protection against the e�ects of noise, but it is not well suited to handle modeling errors. Another criterion, called minimum bias (ex., 20), seeks to minimize the modeling error (also called bias error) which re ects the fact that the function we use for the response surface (quadratic polynomial here) is di�erent from the true response function. Myers and Montgomery20 report on examples where minimum bias design sets of points had also good variance properties, but minimum variance sets of points did not have low bias properties. To nd a minimum bias set of points you have to postulate the true form of the approximated function. Since we employ a quadratic polynomial, we assume that the true wing bending material weight is a cubic polynomial. The minimum bias set of points satis es the condition that 1 V
Z m(x)dV = 1 XN m(x ) ;
V
N j =1
j
7. Variables for Wing Bending Material Weight Function
A response surface was created for the wing bending material weight by assuming a polynomial model equation and then estimating the polynomial coe�cients using the method of least squares. We initially chose the variables to be twenty- ve of the twenty-eight HSCT design variables (Table 1). The remaining three variables, the wing leading edge radius, the cruise climb rate and the starting cruise altitude were omitted because they had no e�ect on the wing bending material weight. For twenty- ve variables, we have 351 coe�cients which must be found through the method of least squares. However, to nd these coe�cients, large number of structural optimizations is required. To reduce the number of coe�cients we sought an alternative, smaller, set of variables (intervening variables), which would be more appropriate for a weight analysis while also being entirely dependent on the design variables. The intervening variables were chosen by analyzing the FLOPS equation for the wing bending material weight. It was found that the wing weight is based entirely on a set of ten basic parameters. Listed in Table 4, each of these parameters can be found using the twenty- ve HSCT design variables. However, moving from these intervening variables back to original 28 design variables cannot be done easily. Table 4. Parameters used to calculate wing weight in FLOPS.
Num. Name 1 6 2 7 3 8 4 9 5 10
Sht Bze Svt Bz Df use Sw b Wfuel sweep Wto
Description
Horiz. tail area Engine relief factor Vert. tail area Bending material fact. Max. fuselage diam. Wing surface area Wing span Takeo� fuel weight Ave. 1=4 chord sweep Gross weight from FLOPS
8. Identifying Reasonable Design Space
The main ingredient in customizing the weight function to the particular HSCT design requirements is to limit the design space to con gurations that are reasonable for the design requirements. The rst step in identifying the reasonable design space was to construct a suitably large hypercube, de ned by the twenty- ve
(1) 9
American Institute of Aeronautics and Astronautics
Sw - wing planform area, AR - aspect ratio, cyi+1 =cyi local taper ratios.
design variables (Table 1), that encompasses this entire region of space. Each of the variables, except the fuel weight, was allowed to assume values between 20% and 180% of its baseline value, given in Table 1. The fuel weight was only allowed to vary between 75% and 125% of its baseline value because of its strong in uence on the design's range and therefore feasibility. 19,651 con gurations were obtained by perturbing one, two and three variables at a time in such a way that perturbed variables reach their extreme allowable values. This technique is described in details in Ref. 6. Of the aircraft designs correspondent to these con gurations, 83% violated one or more of the HSCT's geometric constraints (Table 2) and a large portion of the remaining designs appeared to be unreasonable. Eliminating designs that are unreasonable could not be accomplished without removing nearly every design in the pool of 19,651 candidate points. For this reason, each unreasonable design x was moved so that it resided on the edge of the reasonable design space: x0 = � (x ? xc ) + xc ; � > 0: Computing � in the equation above required a set of criteria to determine whether a design was reasonable or not. These criteria were selected carefully to avoid a computationally expensive procedure and to ensure that no reasonable designs were inadvertently removed. To make use of complex constraints, a series of increasingly expensive evaluations were de ned and applied in phases. Initially, the simple criteria were applied to the data and a large percentage of the candidate points were moved toward a nominal feasible point xc . However, as the increasingly complex constraints were applied, fewer of the points had to be moved and the expense of the constraint evaluations did not become prohibitive. Table 5 lists the criteria used to move the data towards the reasonable design space. They are listed in order of application, with the range constraint, which is the most expensive, coming last.
9. Minimum Variance and Minimum Bias Response Surfaces
Due to the computational expense of the structural optimization, it was not possible to estimate wing bending material weight for all 19,651 points using structural optimization. It was necessary to choose points in the reasonable design space for creating the wing bending material weight response surface. To create response surface that minimizes modeling error, we had to satisfy condition (1). This condition is di�cult to satisfy for an irregular domain, and therefore we rst transformed the domain to a 25-dimensional sphere. We scaled the design domain so that minimum and maximum values of each coordinate of all 19,651 points we had in the reasonable design space were assigned values ?1 and 1, respectively. We also adjusted our domain to assure that points with only one coordinate equal ?1 or 1 with the rest of the coordinates being zero had to correspond to reasonable aircraft design. With this criterion satis ed for extreme points, we ensure that our reasonable design space is close to sphere. After we obtained the spherical domain, we selected the points in such a way that our experimental design satis ed equation (1). In a sphere, integrals of all monomials with any odd power are zero. One possible way to satisfy equation (1) is to construct a symmetric experimental design, so that all odd order monomial sums in (1) are zero. Even order monomials should satisfy the following conditions:
XN xi;j2 = j =1
XN xi;j4 = j =1
1 1 N k + 2 ; i = 1; : : :; k
1 3 N (k + 2)(k + 4) ; i = 1; : : :; k
XN xi;j2xr;j 2 =
Table 5. Criteria for reasonable design.
(2)
1 1 N (k + 2)(k + 4) ; i 6= r ; j =1 1-34 HSCT geometric constraints (Table 2) i; r = 1; : : :; k 35-36 20,000 lbs < WbF < 120,000 lbs 37-58 Minimum fuselage radius here k is the dimension of the problem (i.e., number 59 Inboard �le > Outboard �le of coordinates used), i; r are indices of particular coordinates, xi;j is the i coordinate of the j point in 60 �le > 0 the design space. These conditions are described in 61-62 5,000 ft2 < Sw < 15; 000 ft2 detail in Ref. 21 and could be easily satis ed for low 63-64 1:0 < AR < 3:2 dimensional problems. 65-83 cyi+1 =cyi < 1:0 In our case of 25 variables, we selected a modi ed 84 Approximate range > 5,000 n. mi. small composite design22 that satis ed all the necessary requirements. While central composite design (CCD) In this table WbF is wing bending material weight includes full factorial design (all the vertices of the pcomputed by FLOPS, �le - leading edge sweep angle, dimensional box) as a part, in small composite design
Num.
Description
10 American Institute of Aeronautics and Astronautics
the full factorial portion is replaced by a fractional factorial portion. We employed a 2(25?15) fractional factorial portion accounting for 1024 points. We also augmented our small composite design with additional 50 axial points for a total of 100 axial points. Including the central point, this experimental design consisted of 1125 points. The coordinates of the points in this experimental design were selected to satisfy criteria (2). In low dimensions the minimum bias requirement causes the points to be located close to the center of the design space. However, in our high-dimensional case we obtained a design where all but 50 axial points were located very close to the surface of the sphere that bounded our design domain. This fact led us to hope that in addition to good bias properties our design would possess good variance properties also (experimental designs which minimize variance, consist of points that are usually located at the perimeter of the design space). Response surface in 25 design variables was constructed based on minimum bias experimental design. It is also possible to create a minimum bias design in the 10-dimensional space of the intervening variables. However, while it is straightforward to calculate the intervening variables from the original variables, the opposite is not easy. We did not managed to nd a good procedure to accomplish this inverse transformation. So, we have constructed a minimumbias response surface only for the 25-variable case. We also considered minimum variance response surfaces which were based on the D-optimal experimental designs. The D-optimal set of points for the minimum variance designs was found by \k-exchange" method of Mitchell23 as a subset of the original set of points. This procedure was used for the 25 design variables, and the resultant set was employed also for the 10-variable case. The two minimumvariance response surfaces are denoted RS1 (in 25 variables) and RS2 (in 10 intervening variables). The minimum bias response surface is denoted RS3. Each response surface is constructed based on 1125 points and checked based on additional 1,000 points selected based on D-optimality criterion. With RS1 and RS2 using the same data points, we performed a total of 3,250 structural optimizations The approach used for creation of minimum variance response surfaces in this paper is the same as the approach used by Kaufman et al.6. However the structural optimization data used by Kaufman et al. was noisy. In our case we reduced the amount of noise considerably (see Fig. 9). The accuracy of the response surfaces in the current work is compared with similar models from Ref. 6 and the FLOPS weight function (Table 6).
Table 6. Comparison of RS Accuracy.
RS
RS1 (25 dv, D-opt.) RS2 (10 dv, D-opt.) RS3 (25 dv, min. b.) RS1� (25 dv, prev.) RS2� (10 dv, prev.) FLOPS
Avg. RMS Max. Err.(%) Err.(%) Err.(%) 4:29 10:06 4:43 7:72 8:84 29:84
6:61 13:78 6:45 12:78 12:11 49:07
71:08 89:31 52:77 114:58 63:67 297:29
In this table RS1� refers to the response surface constructed by Kaufman et al. for standard 25 variables based on D-optimal points selection, RS2� refers to response surface constructed by Kaufman et al. for intervening variables based on the same set of points as RS1�, and FLOPS refers to the FLOPS weight function. From Table 6 it is seen that all response surfaces have substantially lower errors than the FLOPS weight function. This reduced error is the consequence of customizing the response surfaces to the particular design conditions of the HSCT problem. Comparing RS1 and RS2 to the more noisy results obtained with RS1� and RS2� , we see substantial improvement for the 25-variable RS1 and small degradation in the accuracy of the 10 intervening variables RS2. The improvement in RS1 re ects the reduced e�ect of the noise. For RS2, with 1,000 points used to calculate 66 coe�cients, it is possible that the noise was already ltered out in RS2� , so that errors are mostly modeling errors. Comparing the minimum bias design RS3 to the minimum variance design RS1, we observe similar performance, indicating no advantage to one over the other. Another e�ect of the reduced noise levels is in the number of polynomial coe�cients that are characterized well by the data. Kaufman et al. found that only 61 coe�cients out of 351 were retained for RS1� when ANOVA technique were employed to eliminate poorly characterized coe�cients. Similarly, only 15 out of 66 coe�cients were retained for RS2� . Here, in contrast, 163 coe�cients were retained for RS1 and 52 for RS2. Model RS3 retained 81 coe�cient.
10. HSCT Design Optimization
Complete HSCT design optimizations were performed to evaluate the e�ects of using the response surfaces to wing bending material weight, RS1, RS2 and RS3. At the completion of the optimizations, results were compared with structural optimization results. Implementation of each response surface was accomplished by modifying the gross takeo� weight calculations within the weight module of FLOPS. In place of FLOPS estimates for wing bending material weight, response surface predictions were used. RS1, RS2 and RS3 were intended for use in the reasonable design space and their predictions could not be relied
11 American Institute of Aeronautics and Astronautics
upon outside this region. Therefore, all calculations outside the reasonable design space were done with FLOPS. At the edge of the reasonable design space, a smoothing function was used to prevent discontinuity between wing bending material weight calculated by FLOPS and the response surface predictions6 . Four HSCT con guration optimizations were performed, each starting from the baseline design detailed in Table 1. During the rst optimization, the FLOPS wing bending material weight was used to nd the takeo� gross weight. The next three optimizations were performed using RS1, RS2 and RS3 respectively. Results from these optimizations are given in Table 7 and the planforms are plotted in Figures 10, 11, 12 and 13. Table 7. Comparison of HSCT optimal designs. Parameter FLOPS RS1 RS2 RS3 Planform Geometry Root chord (ft) 161.5 141.0 158.3 158.2 Tip chord (ft) 7.44 7.51 7.65 7.66 Wing semispan (ft) 60.9 62.4 60.6 60.4 Aspect Ratio 1.74 1.84 1.79 1.76 Wing Area (ft2) 10,263 10,160 9,927 10,049 Performance Data Range (n. mi.) 5,510 5,516 5,505 5,498 Landing AOA (� ) 11.87 11.84 12.01 11.99 L=D max 8.98 9.16 8.91 8.92 Weight Data Wg (lbs) 622,551 622,439 618,168 620,488 Wb (lbs) 18,755 41,221 18,224 17,674 WbG (lbs) 22,848 36,767 21,517 20,244 Wf (lbs) 331,821 328,709 330,248 331,618
140 120
__________
100
------
RS1 Baseline
(feet)
140 80 120 60 100 40 80 20 60 0
0
50
100
0
50
100
150
(feet)
40
(feet)
200
250
300
20 0
150
200
250
300
(feet)
Figure 11: Optimal HSCT planforms using RS1 compared to baseline con guration. 140 120 __________
100
------
RS2 Baseline
(feet)
140 80 120 60 100 40 80 20 60 0
0
50
100
150
0
50
100
150
(feet)
40
(feet)
200
250
300
200
250
300
20 0
(feet)
Figure 12: Optimal HSCT planforms using RS2 compared to baseline con guration. 140 120 __________
100
------
RS3 Baseline
(feet)
140 80 120 60 100 40 80 20 60 0
(feet)
120 __________
FLOPS - - - - - - Baseline
(feet)
100
100
150
0
50
100
150
(feet)
200
250
300
200
250
300
(feet)
Figure 13: Optimal HSCT planforms using RS3 compared to baseline con guration. In Table 7 Wg denotes gross weight, Wb denotes wing bending material weight calculated by correspondent response surface, WbG - wing bending material weight calculated by structural optimization with GENESIS, and Wf - required fuel weight. Comparing the results in Table 7 and gures 10 - 13, we see that the optimizations using FLOPS, RS2 and RS3 obtained structurally e�cient designs (low Wb )
120 60 100 40 80 20 60 0 0 40
(feet)
50
20 0
140 80
50
100
150
50
100
150
(feet)
200
250
300
200
250
300
20 0
0
40
140
0
(feet)
Figure 10: Optimal HSCT planform using FLOPS compared to baseline con guration. 12
American Institute of Aeronautics and Astronautics
which were less e�cient aerodynamically (low L/D). The optimization using RS1 found an aerodynamically e�cient design with high structural weight. The response surface errors in Wb at the optima are of similar relative magnitude, but because RS1 has a conservative error (it overestimates the weight) it probably corresponds to slightly superior design. The error in the FLOPS estimate of Wb at the optimum is highest, but the di�erence is smaller than may be expected from Table 6. This may indicate that FLOPS works well for optimal designs since this weight equation was created based on actual aircraft data. Overall, the use of the response surface led to small improvement in performance compared to the use of FLOPS weight equation.
11. Concluding Remarks
con guration optimization of HSCT achieved superior design to that obtained by use of the original weight equation.
Acknowledgment
This work was supported by NASA Grants NAG-11562 and NAG-1-1160.
References
1. Hutchison, M. G., Mason, W. H., Grossman, B. and Haftka, R. T., \Aerodynamic Optimization of an HSCT Con guration Using Variable-Complexity Modeling", AIAA-93-0101, 31st Aerospace Sciences Meeting & Exhibit, Reno, Nevada, January 11{14, 1993. 2. Hutchison, M., Unger, E., Mason, W., Grossman, B. and Haftka, R., \Variable-Complexity Aerodynamic Optimization of an HSCT Wing Using Structural Wing-Weight Equations", Journal of Aircraft, Vol. 31, No. 1, pp. 110-116, Jan.{Feb. 1994. 3.. McCullers, L. A., \Aircraft Con guration Optimization Including Optimized Flight Pro les", Proceedings of Symposium on Recent Experiences in Multidisciplinary Analysis and Optimization, J. Sobieski, compiler, NASA Cp{2327, April 1984, pp. 395{412. 4. Huang, X., Haftka, R. T., Grossman, B., and Mason, W., \Comparison of Statistical-based Weight Equations with Structural Optimization for Supersonic Transport Wings", AIAA 94{4379, 1994. 5. Vanderplaats, Miura and Associates, Inc., GENESIS User Manual, Version 1.3, Dec. 1993, 5960 Mandarin Avenue, Suite F, Goleta, CA 93117 6. Kaufman, M., Balabanov, V., Burgee, S., Giunta., A. A., Grossman, B., Mason, W. H., Watson, L. T., and Haftka, R. T., \Variable-Complexity Response Surface Approximations for Wing Structural Weight in HSCT Design", AIAA 96{0089, 34th Aerospace Sciences Meeting and Exhibit, Reno, NV, January 15-18, 1996. 7. Balabanov, V., Kaufman, M., Giunta., A. A., Grossman, B., Mason, W. H., Watson, L. T.,and Haftka, R. T., \Developing Customized Wing Weight Function by Structural Optimization on Parallel Computers", AIAA 96{1336, Proceedings of the 37th
When structural optimization is integrated into aircraft con guration optimization, the structural weight is inherently a non-smooth function of the con guration shape variables. Additional noise may be created due to noise in aerodynamic loads and incomplete convergence of the structural optimization. For our model of the HSCT, we have found noise of the order of 30% for the wing bending material weight obtained from structural optimization. A small part of this noise was eliminated by improving the convergence of the optimization procedure. Most of the noise however, was traced to noise in the aerodynamic loads. Careful implementation of camber optimization allowed us to reduce the amount of noise signi cantly. To further smooth out the noise and facilitate the integration of the structural optimization in the overall design process we have explored the use of response surfaces for representing the optimum structural weight. The design points used for structural optimization for constructing the response surfaces were selected on the basis of the minimum variance and minimum bias criteria. To ensure good accuracy of the response surfaces, simple analysis tools were employed. These tools were used to eliminate unfeasible regions of the design space, thus customizing the weight equation to aircraft with the given range, Mach number, etc. Additionally, the original FLOPS weight equation was used to identify AIAA/ASME/ASCE/AHS/ASC Structures, Strucimportant parameters for determining wing bending tural Dynamics, and Materials Conference and Exmaterial weight, allowing a reduction in the number hibit , pp. 113{125, Salt Lake City, UT, April 15{17, of variables from 25 to 10. 1996. Optimizations of the HSCT con gurations were conducted using 25-variable minimum bias and minimum 8. Carlson, Harry W. and Walkley, Kenneth B., \Numerical Methods and a Computer Program for Subvariance response surfaces as well as 10-variable minisonic and Supersonic Aerodynamic Design and Analmum variable response surface. These were compared ysis of Wings With Attainable Thrust Corrections," to optimization based on the FLOPS weight equation. NASA CP 3808, 1984. The application of the customized weight equation to 13 American Institute of Aeronautics and Astronautics
9. Dudley, J., Huang, X., MacMillin, P. E., Grossman, B., Haftka, R. T., and Mason, W. H., \Multidisciplinary Optimization of the High-Speed Civil Transport." AIAA 95{0124, 33rd Aerospace Sciences Meeting and Exhibit, Reno, Nevada, January 9{12, 1995. 10. Hutchison, M. G., Unger, E. R., Mason, W. H., Grossman, B., and Haftka, R. T., \Aerodynamic Optimization of an HSCT Wing Using VariableComplexity Modeling," AIAA Paper 93{0101, Jan. 1993. 11. Barthelemy, J. F. M., Wrenn, G. A., Dovi A. R., Coen, P. G., and Hall, L. E., \Supersonic Transport Wing Minimum Weight Design Integrating Aerodynamics and Structures," J. of Aircraft, Vol. 31, No. 2, March{April 1994. 12. Giunta. A. A, Narducci R., Burgee, S., Grossman, B., Mason, W. H., Watson, L. T. and Haftka, R. T., \Variable-Complexity Response Surface Aerodynamic Design of an HSCT Wing", AIAA 95{1886, Proceedings of 13th AIAA Applied Aerodynamics Conference, San Diego, CA, June 19-22, 1995, pp. 994-1002. 13. Knill, D. L., Balabanov, V., Grossman, B., Mason, W. H. and Haftka, R. T., \Certi cation of a CFD code for High-Speed Civil Transport Design Optimization", AIAA 96{0330, 34th Aerospace Sciences Meeting and Exhibit, Reno, NV, January 1518, 1996. 14. Rohl, P. J., Mavris, D. N., Schrage, D. P., \HSCT Wing Design Trough Multilevel Decomposition", AIAA 95{3944, 1995. 15. Haftka, R. T., Sobieszczanski-Sobieski, J., \Multidisciplinary Aerospace Design Optimization: Survey of Recent Developments", AIAA 96{0711, 34th
Aerospace Sciences Meeting and Exhibit, Reno, NV,
January 15-18, 1996. 16. Myers, R. H., Montgomery, D. C., \Response Surface Methodology. Process and Product Optimization Using Designed Experiments", John Willey & Sons, Inc., New York, N. Y., 1995, pp. 134{174. 17. Mason, R. L., Gunst, R. F., and Hess, J. L., Statistical Design and Analysis of Experiments, John Wiley & Sons, New York, N. Y., 1989, pp. 215{221. 18. Giunta, A. A., Dudley, J. M., Narducci, R., Grossman, B., Haftka, R. T., Mason, W. H., and Watson, L. T., \Noisy Aerodynamic Response and Smooth Approximations in HSCT Design," AIAA Paper 94{4376, 5th AIAA/USAF/NASA/ISSMO Symposium on Multidisciplinary Analysis and Optimization, Panama City Beach, Florida, September 7{9,
1994. 19. Box, M. J. and Draper, N. R., \Factorial Designs, the jXT Xj Criterion, and Some Related Matters," Technometrics, Vol. 13, No. 4, 1971, pp. 731{742. 20. Myers, R. H., Montgomery, D. C., \Response Surface Methodology. Process and Product Optimization Using Designed Experiments", John Willey & Sons, Inc., New York, N. Y., 1995, pp. 402{418. 21. Myers, R. H., \Response Surface Methodology", Blacksburg, VA, published by Author, 1976, pp. 202{ 214. 22. Myers, R. H., Montgomery, D. C., \Response Surface Methodology. Process and Product Optimization Using Designed Experiments", John Willey & Sons, Inc., New York, N. Y., 1995, pp. 351{357. 23. Mitchell, T. J., \An Algorithm for the Construction of D-Optimal Experimental Designs", Technometrics, Vol. 16, No. 2, May 1974, pp. 203{210.
14 American Institute of Aeronautics and Astronautics