ROBERT P. O'SHEA and RANDOLPH BLAKE ... Address reprint requests to Robert O'Shea at Cresap Neuroscience ...... York: Gardner Press. WEGNER, K.
Perception & Psychophysics
1987, 42 (3), 205-214
Depth without disparity in random-dot stereograms ROBERT P. O'SHEA and RANDOLPH BLAKE Cresap Neuroscience Laboratory, Northwestern University, Evanston, Illinois
Depth can be perceived in random-dot stereograms in which dots are binocularly uncorrelated, in the absence of overall positional disparity (e.g., Julesz, 1960). This phenomenon, which we have called rivaldepth, persists over a wide range of luminances, stereogram dot densities, and dot sizes. Rivaldepth is also observed with interocular uncorrelation provided by complementation and orthogonal rival contours, and in both static and dynamic random-dot stereograms. Like conventional stereopsis, rivaldepth magnitude grows with increasing viewing distance, but unlike conventional stereopsis its direction does not reverse when half-images are interchanged. In a survey of 52 individuals, about half consistently reported far rivaldepth; they were also more likely to exhibit overconvergence on a test of fixation disparity. The remaining subjects reported near rivaldepth and tended to show underconvergences. A second experiment, however, showed that eye movements measured immediately after offset of rivaldepth stereograms were in the opposite direction (e.g., convergences were associated with near depth). Evidently, once rivaldepth is established, subjects attempt to fuse the "object" projecting the uncorrelated images. Rivaldepth magnitude is similar to depth produced by stereograms with disparities too large to be fused. The pattern of eye movements and rivaldepth magnitude suggest that the binocular visual system treats uncorrelation as a potentially correlated disparity beyond the fusion limit. It has been known for over a century (Wheatstone, 1838) that stereoscopic depth can be produced when the two eyes view displays in which matching portions of the two monocular views fall on noncorresponding retinal areas (i.e., a positional disparity exists between portions of the left- and right-eye views). Perhaps the most dramatic demonstration of the effectiveness of positional disparity is provided by random-dot stereograms, in which depth is signaled by some consistent disparity among locally identical elements (Julesz, 1971). It is not well known, however, that stereoscopic depth can also be elicited in the absence of consistent positional disparity. In particular, when random-dot stereograms containing relatively large regions in which dots are uncorrelated interocularly are viewed, the uncorrelated regions, besides yielding patent binocular rivalry, produce stereoscopic depth in the absence of overall horizontal disparity. For purposes of discussion, we shall term this percept rivaldepth, From the outset, we should stress that this phenomenon is not novel. Other investigators, most notably Julesz (1960), have described comparable depth effects. In the General Discussion, we shall relate This research was supported by NSF Grant BNS 8418731. Preliminary results were presented to the Annual Meeting of the Association for Research in Vision and Ophthalmology, Sarasota, Florida, April 28-May 2, 1986. We thank Gian Poggio and Oliver Braddick for sharing the results of their unpublished research. We are particularly grateful to Robert Patterson and Karen Holopigian for comments on an earlier version of this manuscript. Address reprint requests to Robert O'Shea at Cresap Neuroscience Laboratory, Northwestern University, 2021 Sheridan Rd., Evanston, IL 60201.
those earlier observations to the ones investigated in this paper. Our interest in this phenomenon originated from a related study concerned with depth in conventional, fully correlated random-dot stereograms containing a central region whose retinal disparity was too large to be fused. To our surprise, the depth associated with these large disparities was sometimes opposite that predicted from the sign of the disparity. For instance, large crossed disparities tended to be seen as far depth. For these initial observations, several naive observers were asked simply to estimate the magnitude of depth of the central region in inches and to report on its appearance. The stereograms consisted of a matrix of 240 X 240 dots, with a central square region consisting of 110 X 110 dots; each dot had an equal probability of being black or white. Between disparities of 0.5 0 uncrossed and 0.5 0 crossed, depth constancy for random-dot stereograms was present and single vision was reported. Outside this range, judgments were more variable but tended to fall around a fairly consistent level of near or far depth, regardless of the sign ofthe disparity. When viewing these large disparities, 0bservers described the central region as being rectangular, with fuzzy edges, the component dots to be cloudy, "busy, " or "swarming," and the depth to be nonuniform and unstable. 1 On a small fraction of trials, large disparities were correctly reported in depth. On these trials, the central region was seen as square and stable, but now superimposed on a cloudy, busy, rectangular surround. This reversal of depth sign is typically not reported with simple line stereograms; the phenomenon seems to be
205
Copyright 1987 Psychonornic Society, Inc.
206
O'SHEA AND BLAKE
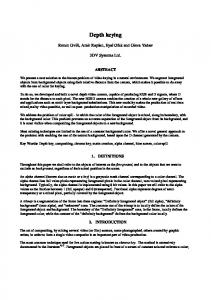
peculiar to random-dot stereograms (or, at least, stereograms with high contour density). In fact, depth estimates from line stereograms of the same dimensions and disparities tend to be veridical, whereas those from randomdot stereograms are relatively independent of disparity. What causes large disparities to be seen sometimes in reversed depth? The tendency for the central region to appear rectangular rather than square suggests that observers are unable to match up dots in the disparate regions and, instead, respond to a region of interocularly uncorrelated dots. This idea is shown schematically in Figure 1. To test this possibility, we constructed a variety of random-dot stereograms in which dots seen by the left and right eyes were perfectly correlated in one region (e.g., the surround) but were uncorrelated within another region (e.g., the center). We found that the entire uncorrelated area was seen as near or far depth, even though this region contained no consistent positional disparity. The following section describes observations bearing on this phenomenon of rivaldepth. Phenomenology Several interesting aspects of rivaldepth can be appreciated by stereoscopic inspection. Accordingly, some representative rivaldepth stereograms are given in Figure 2, so the reader may confirm most of the observations described below. Inspection of a random-dot stereogram containing a central uncorrelated region with no overall horizontal disparity, such as Figure 2a, yields a sense of depth, the phenomenon we are calling rivaldepth. This percept is augmented when the observer views the region peripherLEFT FIELD
RIGHT FIELD
I dot crossed displlrity
BINOCULAR SUPERIMPOSITION
Correspondence estllblished
2 dots crossed displlrity Correspondence flliled Key for hlllf-imllges Key for bin. superimposition
~ Center dots
\;;"B Surround dots
Correlllted center dots ~
uncerreteten center dotS. Correlllted surround dots
l;;iJ
Figure 1. These drawings are meant to illustrate wbat bappens when random-dot steI'eognUD baIf-images are binocularly combined.
Binocular correspondence can be establisbed in nmdom-dot stereo-
grams wben horizontal disparity is small (upper set of baIf-images) but not when disparity. large (lower set ofbalf-images). The failure of correspondence places uncorrelated dots on corresponding retinal areas within tbe center of tbe stereogram.
. -. . ..... . . ......... .. ...-.. ... ... - . . . :. . . ..... • • .. ... . .. ... . . .. . .. .... • I
•
• ••
i
•
I·
•
a
..... . . . .... . .. ..... .-• . ... ..· .:. -... . "" . •• ... . .. . • • •• . .. .i . ...·
.
• _. a. . . . ._ .
•
y
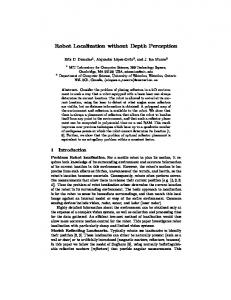
b Figure 2. Demonstration rivaldepth stereograms. Rivaldepth will be experienced if these are binocularly combined, wbetber by stereoscope or with free fusion through overconvergence or divergence of tbe eyes. (a) This stereogram is a 100 x 100 matrix with a concentric square region of 40 x 40 dots. The surround is correlated, and tbe center. uncorrelated. Dot density is .5. The central region should appear to be at a different depth from that of the surround; this is rivaldepth. Its direction (near or far) depends on individual differences. Compare this stereogram with tbat in Figure 3a to see that reducing tbe number of dots by a factor of four, wbile maintaining tbe same dot density, leaves rivaldepth unchanged. (b) This stereogram bas tbe same dimensions of that in Figure 3a, but with a dot density of .005. Cbance matcbes between individual dots are more noticeable, yet a global sense of rivaldepth remains, especially with peripheral viewing.
ally or squints. The boundaries of the central region may appear somewhat indistinct and, within them, individual dots may engage in binocular rivalry with their uncorrelated counterparts in the other half-image. On scrutiny, local regions may be seen at different depths up to or crossing the depth of the surround. These may fluctuate, but a global sense of depth that is relatively stable remains.P Occasionally, the global sense of depth may reverse, although the predominant depth direction-near versus far-is easy to specify. Rivaldepth seems to be relatively uninfluenced by the density of the dots making, up the stereogram. This is illustrated in Figure 2b. So Jong as the dots are individually resolvable, rivaldepthis also unaffected by the size of dots. With very large dots, or when there are very few of them, rivaldepth is not so compelling, but rivalry between individual dots is evident (cf. Boman & Kertesz, 1985). Rivaldepth is uninfluenced by luminance as long as the individual elements are visible. We have also observed rivaldepth with brief presentations (less than
DEPTH WITHOUT HORIZONTAL DISPARITY
207
100 msec) and in dynamic random-dot stereograms (presented at a frame rate of 22 Hz), although in the latter case rivaldepth seemed more unstable than under static presentation (cf. Gonzalez, Krause, & Poggio, 1986; Ross, 1974).
EXPERIMENT 1 Having explored phenomenologically some of the limits of rival depth, we set out to answer the following four specific questions: (1) Are there individual differences in preference for near and far rivaldepth? (2) Does rivaldepth reverse when the fields of stereograms are interchanged? (3) Is rivaldepth direction dependent on the nature of the rival contours contained in the stereograms? (4) Can the direction of rivaldepth be predicted from tests of binocular function? To answer these questions, data were obtained from a large sample of individuals.
Center, Uncorr L
a
~
Surround, Uncorr L
b
Method Subjects Fifty-two unpaid volunteers participated in this study; all were naive to the phenomenon under study, although 13 had had some experience with viewing conventional random-dot stereograms. All subjects had monocular acuity sufficient to resolve the elements of each half-image of the stereograms, either without or with correcCenter, Comp L c tion. All subjects could correctly report the form and depth in fully correlated random-dot stereograms with small crossed or uncrossed disparity. Apparatus and Procedure. Eight rivaldepth stereograms of identical dimensions were drawn by an Apple Laserwriter, mounted on cardboard, and shown in a Holmes-type stereoscope. We created four different types of rivaldepth stereograms. Threecontained fully correlated surrounds and the following types of interocular decorrelation in the center: (1) zero correlation (uncorrelation), (2) negative correlation (complementation), (3) patent rival targets (monocularly Center, Riyol L visible, orthogonal, diagonal contours). The fourth stereogram had d an uncorrelated surround and a correlated center. These are shown Figure 3. The four basic rivaldepth conditions of Experiment 1. in Figure 3 (identified as version L); the remaining four stereograms (a) Uncorrelated center and correlated surround; the center should (version R, not illustrated) were the same except with the half-images appear to be at a different depth from the surround. (b) Uncorrelated reversed. For each stereogram, the surround was 50 x 50 dots and surround and correlated center; if a stable match in the center can the central regions consisted of 20 x 20 dots or an equivalent cenbe achieved, rivaldepth should be opposite to that observed above. tral area. In all four stereograms, the central region occupied ex(c) Complemented cemer and correlated surround; rivaldepth sbouId actly the same position-overall it had neither horizontal nor vertibe the same as in (a). (d) Rival center and correlated surround; the cal disparity. The visual angle of the entire matrix at the focal plane central region is replaced with dichoptically orthogonal diagonaI6nes, of the stereoscope lenses was 8.58°. 3 resulting in clear binocular rivalry. Nevertheless, rivaldepth in the A subject was first administered Julesz's (1971, pp. 273-275) same direction as in (a) should be observed. random-dot test of stereopsis. This began with a fully correlated stereogram (its visual angle was 14.13 0) containing crossed diswere 0.5' in width), presented to the left eye. Presented to the right parity, followed by similar stereograms with increasing amounts eye was a series of equally spaced, numbered vertical lines, each ofcomplementation. The subject was scored on the largest amount separated horizontally from its neighbors by 1.5'; these were verof decorrelation at which he/she could see the form and depth of tically separated from the single upper line by 3'. The subject was the central square. The test was then repeated for uncrossed dis. asked to read the number of the lower line that was aligned with parities. the single upper line. The phoria targets consisted of a vertical arNext the subject was shown the eight rivaldepth stereograms in row (4.5') presented to the left eye and a horizontal scale (3' divirandom order. For each stereogram, the subject reported whether its central square area appeared in front of the surround or behind sions) presented to the right. The subject was asked to read the numthe surround; "don't-know" responses were allowed. The subject's ber of the scale to which the arrow pointed. Several weeks after the rivaldepth testing, 32 of the 52 subjects spontaneous comments were recorded verbatim. were recalled and presented with the anaglyphic version of Julesz's Finally, fixation disparity and phoria were measured in the stereo(1971, p. 350) ambiguous stereogram. It consists of a fully corscope. The fixation disparity stereogram consisted of correlated surrelated surround, and a central square with a vertically repetitive rounds of random dots with the central area blank. (3.44°), except pattern that provides equal probability matches for both a crossed for a single, central, upper vertical line (4.5' in length; all lines
208
O'SHEA AND BLAKE
and an uncrossed disparity. This was viewed through red-and-green glasses at reading distance (40 em for a visual angle of 12.50°), first with the red filter over the right eye, then with the glasses reversed. Subjects were asked to say whether the central square region (5.22°) was nearer or farther than the surround.
Results and Discussion Nearly all subjects responded quickly and confidently to the rivaldepth stereograms. Those who tarried reported depth fluctuations; they were asked to respond to the predominant depth. The research questions are answered below: 1. Individual differences in rivaldepth direction. Although uniform responses to the eight test stereograms (i.e., all near or all far) were given by only 5 subjects (fewer than 10 %), it is clear that subjects were not choosing directions by chance. Figure 4 shows the frequency distnbution of preferences for far rivaldepth over the eight stereograms. The distribution is approximately rectangular; a chi-square test for goodness of fit to a binomial distribution (the distribution expected from chance responding) showed r(7; n = 42) = 124.17, p < .001, a significant departure from chance, and fit to a rectangular distribution was quite good (JC = 7.71, p > .2). In other words, individual subjects generally preferred one direction of rivaldepth over the other. There is no obvious bias toward one particular direction of rivaldepth; across subjects, near rivaldepth was just as common as far depth. 2. Rivaldepth is unchanged by reversal of the half images. Product-moment correlations between rivaldepth responses to the two versions for each of the four types of stereograms should have been negative if depth had reversed when half-images were interchanged. In fact, all coefficients were positive: .82 (uncorrelated center), .51 (complemented center), .36 (rival center), and .52 (uncorrelated surround). This indicates that, unlike with conventional stereograms, rivaldepth tends to be in the same direction when the half-images are interchanged. Hence, rivaldepth cannot be explained on the basis of asymmetries between the eyes, the fields of the stereoscope, or the stereograms. 3. Rivaldepth direction is independent ofthe nature of the rival contours. Both hierarchical cluster analysis (see Thorndike, 1978) and factor analysis were used to classify stereograms on the basis of similarity of responses given to them. For the sake of brevity, results can be summarized as follows. Stereograms with uncorrelated surrounds formed a group distinct from those with correlated surrounds. This grouping probably is related to the difficulty of judging depth in the uncorrelated surround stereograms. Upon viewing these stimuli, subjects frequently commented that the shape of the central region was difficult to discern. Inability to see the central square may have arisen from problems with binocular fixation. The relationship offixation disparity to rivaldepth is considered below. In general, cluster analysis and factor analysis show that rivaldepth direction is similar for various sorts of uncorre-
....................
10
/...
>u c
.. :J
g
U::
..... ....
5
"'\
.......
r7""'7'""1:>-"""~
012345678 Total number of far responses
Figure 4. Frequency distn"bution of number of far-depth responstS given by each subject to the eight stereograms. The dotted curve shows the distribution expected if subjects chose rivaldepth direction according to chance. The dashed curve shows the best-fitting rectangular distribution.
lation. Nonetheless, subjects' comments revealed notable differences among the various types of stereograms. In comparison with stereograms containing uncorrelated centers: complemented figures showed larger depth with more depth reversals; rival figures showed smaller depth and were harder to judge, and line orientation alternated; and those with uncorrelated surrounds were the hardest to judge, with subjects often discerning no central region in depth, or only an ill-defined, circular region. 4. Rivaldepth is related to fixation disparity. The several tests of binocular function showed the expected intercorrelations: for example, performance on the crossed-disparity stereograms of Julesz's test was highly related to performance on uncrossed-disparity stereograms (r = .79). Fixation disparity and phoria were also highly related (r = .74). Multiple regression was used to find a linear composite of binocularity measures that would predict rivaldepth direction. To this end, various composite scores of rivaldepth were generated, including factor scores from the factor analysis mentioned above. There were no essential differences between the degree to which any of the scores were predicted, so the correlations reported below are on the total number of far-depth responses out of the eight stereograms. Also, combining the binocularity measures did not improve prediction; stepwise regressions generally settled on a single predictor. The best predictor was fixation disparity, which showed a significant negative correlation [r(39) = - . 37, p < .05], such that divergences were associated with reports of near rivaldepth and convergences were associated with far depth (cf. Shippman & Cohen, 1983). The remaining variables-stereopsis with decorrelation, phoria, and responses to Julesz's ambiguous stereogram-were minimally related to rivaldepth. So, the results from this survey, besides documenting the robustness of the phenomenon, raise two interesting points about rivaldepth. First, rivaldepth is observed with several different types of interoeular decorrelation, suggesting that rivalry has a depth sign. To our knowledge, no modem theory of stereopsis has included such a tenet." The existence of rivaldepth implies that such a tenet should
DEPTH WITHOUT HORIZONTAL DISPARITY
209
be given more consideration. Second, the direction of it seemed possible that this manipulation might influence 6 rivaldepth bears some relationship to fixation disparity. depth judgments. Manipulating disparity, while measuring depth magniBelow we develop an explanation of this relationship, although admit at the outset that it is quite speculative and, tude, allows a test of the first assumption about the association between rivaldepth and fixation disparity. Speas yet, largely untested. We start with the assumption that uncorrelation signals cifically, the magnitude of rivaldepth from uncorrelation the presence of an object so far in front of or behind the should be the same as depth from correlated stereograms . plane of fixation (i.e., the horopter) as to be beyond the with disparities beyond the fusion limit. The ideal test of the second element of the relationship limit of binocular fusion. This is entirely consistent, of course, with the phenomenon that motivated us to per- between fixation disparity and rivaldepth would involve form the survey experiment (recall Figure 1). Why, objective measurement of eye position during inspection though, do some subjects report far rivaldepth and others of a rivaldepth stereogram. As in the above example, an report near rivaldepth? Consider the case of divergent fix- initial divergence might be followed by a convergence and ation disparity associated with the percept of near rival- the subject would report near rivaldepth. Since apparadepth (the argument is the same, except reversed, for the tus for measuring binocular eye movements was unavailcase of a convergence). Perhaps a given individual habitu- able, we assessed eye position subjectively using nonius ally executes a divergence when confronted with a binocu- lines. Two tests were made: one test, which we shall call "tonic" fixation disparity, was a general, once-only mealar correspondence problem (cf. Julesz, 1971, p. 200). A divergence moves the fusion limits farther from the sure similar to that made in Experiment 1; the other, eyes. Since the problem is not solved by this manoeuver which we shall call "phasic" fixation disparity, involved (i.e., the uncorrelated region is still uncorrelated), the responses to nonius lines that appeared immediately afvisual system is biased to assume that the object was in ter offset of each stereogram. With these considerations in mind, Experiment 2 was the opposite direction, that is, near. This bias must override the information provided by the failure to establish designed to test a number of research questions: (1) Does binocular correspondence with subsequent convergent eye horizontal disparity (i.e., enlarging the horizontal extent of uncorrelation) have any effect on rivaldepth or fixamovements. 5 tion disparity, in comparison to its effects on correlated EXPERIMENT 2 stereograms? (2) Can naive subjects respond consistently to rivaldepth stereograrns? (3) Are there differences in There are a number of limitations of the survey method rivaldepth observed from uncorrelation and complemenused in Experiment 1. For one, each stereogram was pre- tation? (4) What is the relationship between fixation dissented only once, so there was no opportunity to judge parity (both tonic and phasic) and rivaldepth? whether subjects were consistent in their reports to the same rivaldepth conditions. For another, responses were gathered only on rivaldepth direction, but, from spontane- Method Subjects. Five female and 3 male students participated in this ous comments, there were indications that rivaldepth mag- experiment in partial fulfillment of a course requirement. All had nitude depended on type of uncorrelation (i.e., com- monocular uncorrected or corrected Snellen acuities of 6/6 or betplementation was described by some subjects as appearing ter in each eye, with the exception of 1 male, who haduncorrected farther from the surround than uncorrelation). Also, Julesz anisometropia (6/00 in his left eye); this individual wore no corand Tyler (1976) demonstrated perceptual differences be- rection during testing. Each student possessed good stereopsis, as tween uncorrelation and complementation, in particular measured on the Titmus test of the Orthorater. All participants were naive as to the purposes of the experiment and the phenomenon in the ease with which transitions between the two states of random-dot stereopsis. The point test of sighting dominance were detected. showed that each subject was right-eye dominant. Near and far Experiment 2 was designed to overcome these limita- phorias were within normal limits. Apparatus. The subject's head was stabilized with a foreheadtions. Also, Experiment 2 allowed a closer simulation of the correspondence problem that occurs when one views and chinrest, so that the screen of a Macintosh microcomputer was correlated stereograms with large horizontal disparities. visible through a mirror stereoscope constructed from optical bench components. The Macintosh's mouse was used to register responses. To this end, uncorrelated centers were shifted horizonThe random-dot stereograms were made up of an approximately tally in each half-image by the same amount as that con- square matrix (6.53° horizontally x 6.68° vertically; visual antained in stereograms with correlated centers. Below we gles given below are for horizontal extents only), consisting of 100 will refer to this monocular shift of an uncorrelated area x 100 approximately square elements, each of which had an equal as "disparity," although strictly speaking this term is a probability of being black or white. Each element subtended a visual misnomer. The leading edge of a horizontally shifted area angle of 3.92'. The stereograms contained a concentric central disobscures some potentially matchable dots in the surround, parate region of25 x 25 elements (1.63°). This area had a range of disparities added to it by shifting its horizontal position in equal and its trailing edge "uncovers" some unmatchable dots. and opposite directions in the two eyes and in integer multiples of When the shifted area is uncorrelated to start with, one element. The range was from 16 elements of uncrossed dishorizontally shifting it simply has the effect of broaden- parity (1.04 0; negative by our convention), through zero to 16 eleing the horizontal extent of uncorrelation. Nevertheless, ments of crossed (positive by our convention). Stereograms were
210
O'SHEA AND BLAKE
displayed on a half-tone field with white dots of 1.97' in diameter (this will be referred to as gray). Tonic fixation disparity was measured with a pair of nonius lines whose height and width were 40' x 4'; their separation was 10'. Concentric with the center of the gap between the nonius lines were annuli of4' width and internal radii of 0.82° , 1.38°, or 2.45°; these were presented to both eyes. The upper nonius line was visible to the right eye and was fixed on the screen. The lower nonius line was visible to the left eye, and its initial position was in geometric alignment with the upper. The subject could vary the horizontal position of the lower nonius line by making horizontal movements with the mouse. The position of the lower line was sampled 1,200 times in 40 sec. All stimuli were black on a white screen. To measure phasic fixation disparity on each trial, stereograrns were immediately followed by brief presentation (144 rnsec) of a field containing nonius lines. This field consisted of the gray background upon which were drawn black nonius lines, each of 31 ' length x 5' width, separated by 33'. The other fields used in the experiment consisted of (I) a uniform gray field, and (2) a response field that contained a Macintosh dialog box visible only to the left eye. The response dialog box consisted of the following: a schematic plan of the stereoscopic percept (the subject could move its central part by moving the mouse to estimate the depth experienced), and "buttons" to register a decision about the position of the nonius linesand to start the next trial. Luminances were measured through the eyepiece with a Minolta spot photometer. Dark parts had a luminance of 0.27 cd/m', bright parts were 15.76 cd/m', and the gray had a space average luminance of 6.03 cd/m", Testing took place in a sound-attenuated, light-tight booth with dim indirect lighting such that the body of the Macintosh reflected 0.48 cd/m", Procedure. To begin, the subject viewed nonius lines and adjusted the mirrors of the stereoscope to correct for any phoria. Then tonic fixation disparity was measured: the subject kept the lower nonius line aligned with the upper by varying horizontal position of the lower line with the mouse. Trials lasted about 60 sec and were separated by at least 60 sec. Each of the three surround radii was tested twice; the six trials were administered in a random order. Next, depth and phasic disparity were measured. Each trial began with the appearance of nonius lines and the computer's emitting a beep. On a press of the mouse button, the stereogram was displayed. The subject was allowed free eye movements and as much time as required to estimate the depth of the central region relative to the surround. Once that judgment was made, the subject fixated the center of the stereogram and gave a buttonpress. This removed the stereogram and replaced it with the briefly presented nonius lines. The subject then used the dialog box to indicate whether the top nonius line was to the left or right of the lower. The final mouse click in the box ended the trial. Intertrial interval was 7 during which the next stereogram was generated and the subject viewed a gray field. The subjects responded to the full factorial combination of disparities (at least 9) and correlations (3), repeated 4 times in completely random order (at least 108 trials) in one session. One subject (M.R.B.) returned for two more sessions so that more repetitions and tests of new disparities could be made.
sec,
Results and Discussion
Subjects generally responded quickly and confidently to the uncorrelated stereograms, usually viewing them for about 1 sec before making a response. The results of the anisometropic subject were not exceptional. The research questions posed will be dealt with in tum. 1. Rivaldepth is equivalent to depth from large disparities. Depth responses of one representative subject to
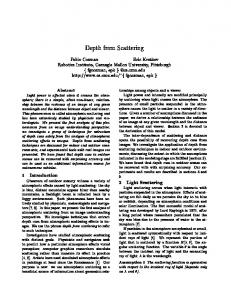
complemented, uncorrelated, and fully correlated stereograms are shown in Figure 5. Notice first the clear relationship between perceived depth and physical disparity for the fully correlated stereograms. This clear trend is evident for all subjects, and merely confirms that the magnitude of perceived depth grows with disparity. Critically, however, at disparities around 10 , rivaldepth is observed, as evidenced by the change in the magnitude of the depth percept. For the stereograms with uncorrelated and complemented centers, all "disparities" produced about the same magnitude of depth which, for this subject, was seen as a rivaling central region situated behind a fused surround. Note that mean depth responses and their standard errors have been computed for the uncorrelated and complemented stereograms. This is somewhat inappropriate, since these statistics are influenced by an underlying bimodality of responses (see below). Nevertheless, any systematic shift of depth direction related to disparity (i.e., horizontal extent) would be evident in the means. No effect of disparity was seen for this or any other subject. Absolute depth responses (i.e., ignoring depth direction) were averaged at the largest disparity (1.04 0 ) for the three types of correlation; averaging near- and fardepth absolute values eliminates the bimodality of responses. These data were analyzed by a two-factor, within-subjects analysis of variance. This analysis showed depth to be equivalent for the three types of stereograms [F(2,14) = 3.58, p > .05]; also there were no differDisparity (dots) -10
-15
-5
0
10
5
15
g
MRB
z
20 0--0
• QI
"5
10
•
Correlated
Uncorrelated
. - - . Complemented
5
iii QI
Uncrossed oi-!:!=~-----l,---t-,Q--,--r---""""""-7"1
.J:.
0. QI o
-10
-20
- - - - ~ - ~o
Disparity (deg.)
are
-.- - - -.- - .. 0.5
to
Figure S. In the upper panel plotted one subject's mean depth responses (arbitrary units) to correlated stereograms, and stereograms with unrorrelated and complemented centers, as a function of disparity. Vertical bars show standard errors. The lower panel shows phasic fixation disparity (the percentage of convergences) exhibited immediately following inspection of the various types of stereogram, plotted as a function of stereogram disparity.
DEPTH WITHOUT HORIZONTAL DISPARITY ences between crossed and uncrossed disparities (F = 0.22) and no significant interaction between type of stereogram and disparity (F = 0.36). The statistical analysis confirms what is evident in Figure 5: rivaldepth is of the same magnitude as depth from correlated stereograms with large disparity. Thus, our first assumption about the relationship between fixation disparity and rivaldepth is ~~~. . Correlated stereograms did lead to phasic vergence changes, as indicated in the lower panel of Figure 5. As expected, crossed disparities were associated with convergent eye movements and uncrossed with divergent ones. For the rivaldepth stereograms, there were no significant effects of disparity or type of complementation on fixation disparity for this or any other subject. Eye movements in response to rivaldepth stereograms are considered further below. 2. Rivaldepth is intrinsically variable. Since horizontal extent did not affect rivaldepth, responses were cumulated over all "disparities." All subjects except 2 showed an asymmetric, bimodal distribution of depth responses, with the trough between the two modes at zero depth. Seven subjects preferred far depth, and I preferred near depth. Even if depth direction is ignored, average standard deviation (expressed as a proportion of the mean) of rivaldepth responses was about 1.5 times greater than that for depth responses to fully correlated stereograms. The bimodal distribution of rivaldepth responses suggests that reversibility is intrinsic to rivaldepth stereograms. 3. Uncorrelation and complementation yield equivalent rivaldepth. In their signed rivaldepth responses, 7 subjects showed no difference between uncorrelation and complementation, measured over all stereograms. The remaining subject did show differences, for which we have no explanation. After all, complementation in stereograms containing disparity would require precise vergence changes to achieve the "goal" of complementary stimuli falling on corresponding retinal points. Examination of phasic fixation disparity showed that this subject did not make such eye movements. The critical comparison is at zero disparity, where complementary stimuli do fall on corresponding retinal areas. The bimodal distributions of responses presented a problem for statistical comparison. Accordingly, sign was ignored and differences between depth responses to complemented and uncorrelated stereograms were assessed by t tests for each individual and by a correlated t test for the means of all subjects. No significant differences were found [e.g., the latter test found t(7) = 1.54, p > .1]. There were also no differences in the pattern of phasic fixation disparities associated with uncorrelated and complemented stereograms [t(7) = 0.96]. 4. Rivaldepth is related to fixation disparity. To assess the relationship between tonic fixation disparity and rivaldepth, a matrix of product-moment correlations was computed for all measures including near and far phorias. Rivaldepth was expressed for each subject as the mean of all signed rivaldepth responses. With only 8 subjects,
211
Table 1 Correlation Coefficients for the Relationship Between Phasic Fixation Disparity and Depth for Conventional (Fully Correlated) and Rivaldepth (Uncorrelated and Complemented) Random-Dot Stereograms Stereogram Type Subject
Conventional
M.R.B. S.L.
0.52§ 0.59§
Rivaldepth
(87) 0.16* (169) (48) 0.18* (%) L.S. (36) (72) S.R. 0.46:j: (36) 0.42§ (72) 1.1. 0.34t (36) 0.12 (72) D.H. 0.44:j: (36) 0.22* (72) S.H. 0.81§ (31) 0.60§ (66) 0.29:j: (72) D.F. 0.58§ (36) Note-Numbers in parentheses are the number of observations. Values were indeterminant for Subject L.S. because of no variance in fixation disparity. *p