satellite sensors and hydromet weather server respectively to identify high ... Satellite Remote Sensing and GIS Applications in Agricultural Meteorology pp. 401- ...
DESERT LOCUST MONITORING SYSTEM – REMOTE SENSING AND GIS BASED APPROACH D. Dutta, S. Bhatawdekar, B. Chandrasekharan, J.R. Sharma, S. Adiga*, Duncan Wood** and Adrian McCardle** Regional Remote Sensing Service Centre, CAZRI Campus, Jodhpur, Rajasthan * NNRMS/RRSSC, ISRO Headquarters, Bangalore ** RADARSAT International, Richmond BC, Vancouver, Canada
Abstract : Desert locusts (DL) are a serious problem during April to August in the deserts and semi-deserts of Republic of Kazakhstan and causing extensive crop damage. There is no institutional and functional mechanism to forecast the habitat of locusts and most of the area remains unnoticed after laying eggs. The key to improve DL forecasting and control depends on the collection and generation of historical database on locust, weather and habitat from affected region. Looking at the problem a Decision Support System (DSS) has been developed on ARC/INFO GIS with ergonomic user interface for ingestion and subsequent analysis of locust related information vis-à-vis bio-physical and climatic data acquired from various satellite sensors and hydromet weather server respectively to identify high frequency breeding areas well before the physiological development is completed. Weather based analytical models for physiological development of DL has been dovetailed with the DSS for facilitating historic and present data analysis in relation to locust activity. This will enhance the surveying capability and better forecasting.
INTRODUCTION Desert locusts (Schistocerca gregaria, Forskl) are known to be one of the dreaded insects since time immemorial for agricultural production. More than 60 countries are affected at varying degrees during plague development caused by several consecutive generation of successful breeding triggered by a favourable sequence of heavy and widespread rainfall. Normally in solitary phase density remains low and poses no economic threat but under favourable bio-climatic condition population increases very fast over space and time and forms gregarious swarms which can devastate agricultural lands. It is during this period that locusts can cause enormous damage to standing crops even Satellite Remote Sensing and GIS Applications in Agricultural Meteorology pp. 401-423
402
Desert Locust Monitoring System - Remote Sensing ...
several hundred kilometers away from their origin. However, early detection of locust growth and breeding sites are two key issues for efficient surveillance and control of desert locusts (DL). Locating high frequency breeding areas over temporal and spatial scale warrants analysis of large number of biophysical and bio-climatic variables in relation to locust physiology. Nevertheless the most difficult part of forecasting is migration of adult winged locusts, which is influenced by large number of weather parameters at synoptic scale. To manage the locust devastation and its timely warning there is a need for structured geospatial database in GIS environment and interfacing with other analytical and modeling tools to form sophisticated spatial Decision Support System (Healy et al., 1996). This paper describes one such system and the approach to meet forecasting need using ARC/INFO GIS and a host of digital data especially from optical and microwave satellites sensors. GIS and Remote Sensing technology dramatically improves the ability of forecasting through effective manipulation of large volume and variety of spatially referenced and descriptive data. The logical aspects of database design employs integration of all application requirements in a database structure that supports the view and processing needs of these applications. The physical aspects refers to evalusation of alternative implementations and choosing storage structure, query mechanism and access methods (Navathe and Schkolnik, 1978). The major plague of 1985-89 prompted the world acridologists to improve the forecasting tools and methodologies in order to maximize the effectiveness of pesticides and reduce the toxicity in aquatic environment. The highest priority was assigned to modeling and validating the spread of infestations over space and time in relation to concurrent changes in weather and vegetation (FAO, 1989). In the present study effort has been made to provide interface to handle population dynamics, physiological development, habitat suitability as well as climate suitability for breeding and migration. The locusts biology in relation to weather and other environmental factors have been used in forecasting process. The DSS essentially adheres with norms of database design standard, customization, validation, integration before actual query mechanism and performing modeling operations. Locusts in Kazakhstan Locusts are a recurring problem in Kazakhstan but the problem has been intensified since 1996 mostly due to collapse of uncompetitive farming and
D. Dutta, et al.
403
unusually warm weather in recent past. In 2000, 27% of total food grain production i.e. 5 million ton was destroyed and more than 8.8 million ha land was affected. The perennial dynamics of locust population has strong relationship with transformation of landuse fabric in the republic from 1954 to 1992 onwards. The landuse distribution of Kazakhstan is dominated by semi desert and deserts (77.2%), and grassland and forests of 9.4%. The grasslands used to serve as ecological niche for the desert locusts confined to smaller pockets from which they used to migrate in adjoining fringe of agricultural lands. But the land development history of Kazakhstan has adversely affected the natural habitats of locusts while passing through 4 different phases since 1954. i.
Active development of virgin and fallow lands (1954-1964).
ii. Use of soil protection system in agriculture (1965-1974). iii. Intensive use of agrotechnology (1976-1992) and indiscriminate use of pesticides which has caused locust insurgence. iv. Continuous shrinking of agricultural lands due to economic constraints, giving rise to multistage fallow (1992 onwards). As a result of this multi-phasic land transformation large portion of arable lands have been infested with wild grasses and bushes. The extent of such lands has largely expanded and redistributed in the contact zones between cultivated and uncultivated lands in the territory forming excellent habitat for DL scattered over large areas especially in the west, south-east and south. Out of 35 species of DL found in Kazakhstan mostly 3 types are dominating namely Asian, Italian and Moroccan. In the east Italian locusts (Calliptamus italicus) dominate, whereas in south-east Asian locusts (Locusta migratoria) and in south Moroccan locusts (Dociostaurus maroccanus) are prevalent. The situation is getting worse not only in Kazakhstan but also in adjoining countries viz. Russia, Uzbekistan and Kyrgystan. The locusts are also spreading from their traditional breeding grounds to further west. Many new areas have been reported first time since 80 years. Key issues in DL control The major issues related to DL control can be summarized as follows.
404
Desert Locust Monitoring System - Remote Sensing ...
z
Acquisition of bio-physical information from vast inaccessible and hostile terrain (locust habitats) using satellite remote sensing technology with better temporal sampling capability.
z
Parameterization and accurate translation of remote sensing information in relation to ground segment for model input.
z
Use of spatial variables for process modeling and subsequent field validation.
z
Bio-climatic modeling for locust physiology and migration based upon historical locust events and ground intelligence.
z
Operationalization for forecasting of high frequency breeding areas and flight behavior.
Satellite remote sensing helps to examine relationships between distributions of insect pests, rainfall and green vegetation in the seasonally dry tropics. For migration and dispersal modeling there is a need for studying historical records for plague development and forecasting. Current weather data could help to examine downwind airborne dispersal of insect pests over a range of temporal and spatial scales. Based upon the survey of ecological conditions in potential breeding and outbreak areas, aerial and ground survey is organized that become potentially suitable after rainfall incidence. Following the survey operation strategies are chalked out to control DL populations when exceeds above a specific threshold limit, mainly in known outbreak areas. Requirement for a GIS to support Forecasting DSS facilitates incorporation and integration of a variety of information, relevant for modeling of locust population on spatial and temporal context on a common platform. It maximizes the opportunities for early intervention and management of locust swarms. Characteristically it is ergonomic with user interface to facilitate both data capture and analysis through a series of menus for accessing separate information management tools with data display on spatial context. It is desirable to bring together all the information sources used by forecasting and field staff to aid in decision making process. The characteristic features of the DSS are expected to be as follows (Healey et al., 1996). i.
Access to historical records of locust sightings and associated environmental conditions, with ability to cross-reference related events.
D. Dutta, et al.
405
ii. Structured access to reference material for new and existing locust case studies the later being derived from sources such as the published Desert Locust Forecasting Manual (Pedgley, 1981). iii. Rapid input and storage of accurately located sightings. iv. Facilities to display and analyze locust events in the context of both current and antecedent environment conditions, both meteorological and vegetation-related. v.
Ability to compare the present spatio-temporal configuration of locust events, together with prior dynamics, to past analogue spatio-temporal sequences from previous plagues and recession periods.
vi. Interfacing between GIS and other analytical tools for modeling of locust development and migration. vii. Capacity of handling historical locust data for analysis of past locust events and analogue development from previous upsurge based on similarity / matching index. viii. Capability of handling raster, vector and descriptive data as well as comparison of multiple raster and vector maps for analysis of the relationships between locust events and bio-climate. ix. Analysis of daily weather data for bio-climatic modeling for breeding, upsurge and duration of life stage. x. Organisational requirements to meet in-house procurement standards for hardware and software. What is Geo-LIMIS Geo-LIMIS (Geographically Encoded Locust Impact Minimization Information System) is a Decision Support System (DSS) developed on ARC/ INFO 8.0 NT platform using ARC macro language, ODE tools and Visual Basic. The aim is to provide operational decision support for locust habitat suitability, surveillance, prioritization of critical areas and weather conditions on spatial context to enable timely control measures at the field level over the target areas. There is an unique amalgamation of data from various sources such as remote sensing data from optical and microwave satellites along with daily meteorological data downloaded from internet and ground based information on locust generated by the line departments. The thematic maps
406
Desert Locust Monitoring System - Remote Sensing ...
used in habitat suitability mapping include landuse/landcover, vegetation density, landform, soil texture and soil moisture supplemented with a large number of reference maps viz. road, rail, stream, administrative units, settlement location, meteorological stations etc. The conceptual diagram of working of Geo-LIMIS is given in Figure 1 and the main menu in Figure 2. Functionally Geo-LIMIS comprises of six modules viz. i) Spatial database dictionary, ii) database validation as per the database standard formulated for the project, iii) database integration with the query shell using validated database, iv) Inputting locust information from field observation to create spatial database along with the descriptive data i.e. the swarm type, species, density of egg/ hopper/adult as per field survey and other ancillary information on ground condition, v) Geo-LIMIS query shell – It is the main habitat suitability analysis module. Query shell provides facilities for display of single or multiple themes, locust ground observations, theme overlay, generation of integrated layer for habitat suitability, in situ report generation from locust sighting regarding the prevailing ground condition during locust observation which finally is used as knowledge based input for generating habitat suitability map for the entire area from known sample area known as cohort distribution, vi) Life cycle builder – It necessarily uses daily weather data and analyzes the locust breeding suitability under prevailing weather condition, egg and hopper development and flight suitability.
Figure 2: Geo-LIMIS main menu
D. Dutta, et al.
407
Spatial Database Dictionary The package has devised suitable database structure for spatial and nonspatial database elements. Database elements, required to be integrated, with the package must adhere to these standards. To explore and analyze these database elements efficiently and provide ease to the users in executing various tasks of the package, all the database elements and components should be known to the shell. For this purpose, Geo-LIMIS maintains a spatial database dictionary, named as LWTHEME.LWS (INFO table), to store details of various database elements. This dictionary can be updated and extended by the user through a user friendly GUI (Figure 3). User can browse through the spatial dictionary, update or extend it.
Message board
Figure 3: Spatial database dictionary interface
This module (Figure 4) performs the validation of each database element (spatial layers) and also checks the integrity of the database and validates each database element whether it adheres to Geo-LIMIS database design and standards or not. It generates a validation report after critically examining the data. The spatial database elements, which have an entry in the spatial database dictionary will only be considered for validation. During database validation the package performs following validation checks vis-à-vis Geo-LIMIS database design and standards.
Desert Locust Monitoring System - Remote Sensing ...
408
Figure 4: Database validation module
i.
Name of the spatial layers.
ii. Existence of layers and type of layers, feature attribute table (FAT), look up table files. (.LUT) and files containing data for non-spatial themes (.DAT). iii. Existence of link-code in feature attribute table (FAT), .LUT and .DAT files. iv. Definition of link-code i.e. width and each entry of link-code. v.
Projection information.
5.3 Database Integration Module This module performs the pre-processing and integration of each validated database element (spatial layers) and prepares them for further analysis. Database integration can be performed either for all the themes or for selected themes (Figure 5a and 5b). The spatial database elements, which have an entry in the spatial dictionary and have been validated successfully, will only be considered for database integration. Integration is performed in either of the following cases.
D. Dutta, et al.
Figure 5a: Database integration
i.
409
Figure 5b: Database integration
Whenever the database is being integrated for the first time.
ii. After updating any spatial layer, either spatial features or its feature attribute table or associated .LUT files. iii. Whenever a new layer is added to the database. Major tasks performed during database integration include – i.
Generation of intermediate GRID’s for using by the Geo-LIMIS query shell for virtual masking.
ii. Creation of projection files (.PRJ) required for projection transformation from one system to another. iii. Generation of Theissen polygon layer from point meteorological station data. As a result the entire area is spatially divided into number of polygons each represented by a meteorological station. Input Locust Information Module This module (Figure 6a) is provided to convert non-spatial locust information into spatial data. It is important to understand the soil-vegetation and climatic information in the locust sight points. The knowledge gained in terms of ground condition during locust reporting helps to build the complex query for habitat suitability analysis. This module generates date wise spatial file dovetailed with field attribute information. Each point entry is automatically projected into desired system and records the data against the
410
Desert Locust Monitoring System - Remote Sensing ...
point entered. Efforts are ongoing to directly input GPS measurements from field. Besides entry of field points graphically/key board, the module also supports entry of point layers generated outside in ARC/INFO or Arcview environment. User can browse through all the points of sighting and visualize the detailed locust information, edit or update (Figure 6b). For enhancing the referencing capability, layers such as roads, rail, settlement and administrative boundaries can be set in the back environment to precisely ingesting the locust sight point.
Figure 6a: Locust input interface
Figure 6b: Spatial database generation with attributes
D. Dutta, et al.
411
From locust sighting files those observations would be sorted where the density of locust are above a certain threshold to be critical. The points, thus identified, are used for generation of buffer of specified width (as per the ground spread). The objective of doing so is to identify the biophysical condition underneath buffer, which is supposed to be critical in terms of locust. The information extracted from the buffer area, is used by the Geo-LIMIS query shell, for habitat suitability analysis. QUERY SHELL MODULE Geo-LIMIS Query Shell It is the main display analysis and query shell module (Figure 7) which facilitates display of spatial and non-spatial data, identification of theme attributes, overlay of themes, visual query of single of multiple themes, generation of integrated layers, building queries for suitable locust sites and habitat suitability map in desired scale as well as statistics generation. Besides query shell hosts a number of other functionalities viz. symbol updating, choice of text font and color, zooming/panning, saving of map output in various formats etc.
Figure 7: Query shell main menu
SELECT_AOD (Selection of area of display): This is the first option which facilitates user to select desired area of display (Figure 8). Selection could be made for one or more polygons, by defining as irregular area or by specifying the geographic coordinates. The area could be selected by clicking on the graphics or by name through a pull down menu. The selected area of display (AOD) will be used for all display purpose. Area outside the AOD will be virtually masked. SPATIAL_DISPLAY (Spatial display of themes, Primary or Derived): The option is used for display of selected theme (primary or derived) pertaining to the AOD (Figure 9a, b, c, d). Along with map the legend, display scale, north arrow and index map is also displayed. NON_SPATIAL _DISPLAY (For displaying of locust and meteorological data): This facility provides display of locust related information viz. density
412
Desert Locust Monitoring System - Remote Sensing ...
of egg/hopper/adult etc in the form of spot/ratio (Figure 10a, b) as well as meteorological data of selected variable on monthly basis in graphical form. The size of the spot varies proportionately with the value of density. The detailed information of any locust sight could be visualized as a text file using sight-info button. The some of the climate data that could be plotted include temperature, humidity, wind velocity, cloudiness and rainfall in the form of bar or line diagram. For climate data display the EXCEL file must be available in the user’s workspace. The package automatically coverts .xls files for corresponding meteorological station into INFO file. In the EXCEL to INFO conversion interface, the user can specify the name of the station along with the year of interest.
Figure 8: Selection of area of display
D. Dutta, et al.
413
(A)
(B)
(C)
(D) Figure 9: Spatial display of themes
IDENTIFY (To identify attribute of the themes at user specified location): It helps the user to identify attributes at user specified location (Figure 11). Identification could be for currently displayed theme, selected themes or multithemes. OVERLAY (For overlaying selected features of a theme on the displayed theme): It facilitates the user to overlay selected features of a theme on the displayed theme. Overlaid theme is displayed in the form of polygon, lines, points or hatched polygons (for themes of GRID type) with selected color/ pattern (Figure 12). VIS_QUERY (For visual query of single or multiple themes): The purpose of this option is to perform visual query of single theme or across multiple themes i.e. to display selected subset of features (attributes) using query builder. The area satisfying the user defined query is only displayed (Figure 13). In the query builder menu the name of the selected theme appears along with
414
Desert Locust Monitoring System - Remote Sensing ...
(A)
(B) Figure 10: Non-spatial data display
D. Dutta, et al.
415
Figure 11: Attribute identification specific location
(a)
(b)
Figure 12: Overlay of themes (a) polygon-polygon (b) polygon-line
relational operators – AND, OR along with choice for the attribute. Once the attribute of a theme is selected it can be added to the query set. The existing query can however, be added or edited. Once all the theme specific queries are put together in the query set the ‘DRAW’ button executes plotting of areas satisfying the criteria defined in the query set. COMPOSITE (To generate integrated layers viz. SOLSCAPE and SOMVI and the final composite layer): The layers to be used for the generation of habitat suitability can be grouped into tow broad derived layers based on temporal sampling requirements for analysis. It is presumed that landform and soil texture are relative static geophysical properties in temporal scale and could be generated afresh once in 7-10 years time frame. Similarly is the case of broad landuse, which remained almost unchanged over the years in Kazakhstan except the current fallows are becoming permanent. Only the biomass cover changes drastically with summer and spring. Hence it was felt logical to integrate these three layers to generate SOLSCAPE layer, which could be used as it is for 2 or more consecutive seasons.
416
Desert Locust Monitoring System - Remote Sensing ...
Figure 13: Visual query for single and multiple themes
On the other hand vegetation density and soil moisture are highly dynamic in temporal and spatial scale. Hence there is a need to map both of these parameters in every 7-10 days interval. Coarse resolution satellite data thought to be adequate for such dynamic features as the locust activity is a regional phenomena and not does not affect by local changes. These two parameters were combined together to generate an integrated layer called SOMVI. Integration of both SOLSCAPE and SOMVI generate final COMPOSITE layer which is the precursor for habitat suitability analysis. LOC_DATA_ANAL (Analysis of locust data for input to query builder): Locust information in conjunction with ground and meteorological data is a prerequisite for developing expert system through the process of “knowledge gain”. Historic locust data such as swarm type, species type, egg/hopper/adult density, area infested vis-à-vis concurrent weather during infestation will help the modeler to predict optimal range and combination of weather parameters in relation to locust response (Figure 14). Besides climatic suitability locust data is also utilized to analyze in reference to in situ condition in the ground segment. The land condition underneath buffer area gives valuable input about locust preference for soil moisture, texture, vegetation etc and cohort distribution based on known sampling area. The buffer area generates report across multiple themes and displays as per cent distribution of various classes of each theme. HABITAT_SUITABILITY (To generate habitat suitability layer): Based on locust data analysis the query set is generated and each set is given a class name such as most favourable, favourable, medium favourable and not
D. Dutta, et al.
417
favourable (Figure 15). This file is saved as .qry file for eventual use in habitat suitability map generation.
Figure 14: Locust data analysis interface
Figure 15: Habitat suitability map
TOOLS (Miscellaneous functions): The other functions include zooming and panning, saving of image in desired format, statistics generation, setting of text font and color, viewing of symbolset, updating of symbols and execution of ARCPLOT commands externally.
418
Desert Locust Monitoring System - Remote Sensing ...
Life Cycle Builder This module (Figure 16) works independently to query shell and analyses daily weather data downloaded from internet for forecasting of i) climate suitability for breeding of locusts and ii) suitability for flight. Besides thermal growth curve for egg incubation and hopper development specific to desert locust have been used to model the growth and development of locusts, which is an important indicator for locust control at temporal scale. Detailed physiology and locust life cycle have been studied to jot down environmental growth parameters in conjunction to ground intelligence for programming logic.
Figure 16: Life cycle builder interface
The database for climate was generated by downloading daily weather data from (http://meteo.infospace.ru.wond.html.index.ssi) Russian Hydromet Server. Year and location wise weather file is generated.
D. Dutta, et al.
419
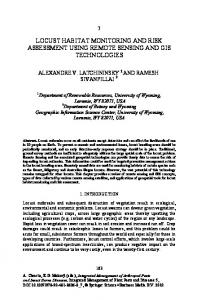
Climate suitability for Locust Breeding For breeding of desert locusts, consecutive rain is required over 3 to 4 weeks to keep surface soil moist. If the surface soil remain moist for 10-15 days the adult locusts start oviposition. Besides soil moisture, soil temperature is also important to avoid desiccation of the egg pods. Hence to model breeding suitability past 3 weeks data pertaining to rainfall type, number of occurrence, maximum difference between two consecutive rain is analysed (indicates the duration of soil wetness). After analysis the model returns the output as a text file indicating whether the prevailing weather over past 3 weeks was suitable or not. Climate suitability for Locust Migration/Flight Migration and long march of adult locusts is a function of temperature, saturation deficit, wind velocity and direction, cloudiness and the upper atmospheric condition i.e. vertical distribution of atmospheric water vapour and mixing zones of upper atmosphere especially in the convergence zones. There is a minimum threshold temperature for flight muscle activation (greater than 17oC), on the other hand above 42 oC thermal inactivation of muscle take place and flight is rare. Most optimum temperature is nearer to 35 oC. Similar to air temperature, humidity also play role in maintaining water balance during flight. Threshold wind velocity required for flight of DL is 13 m/s as the swarms prefer to move passively downwind with +/-10 degree deviation along its direction. Below the threshold wing movement is limited to hopping and saltation. In a cloudy day however, locusts do not fly. All the above constraints were used in programming logic to evaluate the chances of flight. Per cent Egg Incubation undergone This module essentially employs the temperature-growth model (Figure 17) of desert locust based on experiment carried out by Symmons et al., 1973. The percent incubation per day is calculated against daily ambient temperature from the model and integrated over the period of interest. If the percent development value exceeds 100 it prompts that incubation is complete. Besides it also compares with thermal degree days required for DL to complete its incubation. This gives idea about the degree of development undergone till date since it’s reporting in the field. Here the inputs required are date of sighting of egg pods in the field along with approximate development till that
420
Desert Locust Monitoring System - Remote Sensing ...
Figure 17: Air temperature vs per cent egg incubation of desert locust
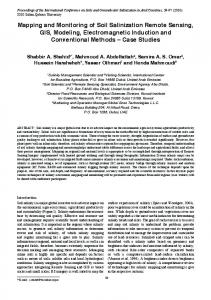
time and the date on which percent incubation is sought. For generalization the model uses the growth curve of DL but with availability of species specific growth curve choices could be given to the users for selection of model. Per cent Hopper Development undergone Similar to egg incubation this model (Figure 18) calculates per cent development of hopper through various instars using daily air temperature. Like egg incubation per cent development undergone per day is integrated over the requested period and the value is returned. Here the inputs required are date of sighting of hoppers in the field along with approximate development till that time and the date on which percent development is sought. For generalization the model uses the growth curve of DL but with availability of species specific growth curve choices could be given to the users for selection of model. The output menu of the Life Cycle Builder is given in Figure 19.
D. Dutta, et al.
421
Figure 18: Air temperature vs per cent hopper development of desert locust
Figure 19: The Life Cycle Builder output
422
Desert Locust Monitoring System - Remote Sensing ...
CONCLUSIONS A Decision Support System on ARC/INFO GIS was developed to meet the need of locust forecasting requirements and operational use in the republic of Kazakhstan in the locust season. Various needs for the user has been taken into account by introducing ergonomics in the user interface design as well as coupling of analytical tools for efficient and meaningful outputs generation. The DSS developed can handle complex spatio-temporal configuration of locust events, generation of locust sighting as spatial database, cohort distribution based upon known sampling areas and utilization of internet downloaded daily weather data for locust life stage development. As the DSS uses wide variety of cartographic and remotely sensed sources, provision is kept for handling of raster, vector and descriptive data as well as comparison of multiple raster and vector maps for analysis of the relationships between locust events and bio-climate. Introduction of the mobile GIS and Global Positional System in surveying techniques will improve the accuracy and timely availability of data as model input to forecast in near real time. One of the important aspects of locust data analysis for near real time forecasting depends upon the dissemination of field information to the center where data analysis is performed. Data on distribution, density and life stages of locust as well as habitat condition could be collected using GPS and palmtop computer and sent to GIS based DSS located at the headquarter where further analysis is performed through high frequency radio modems. The survey data could be converted to GIS format point features for visualization and used as input to run spatially explicit development models for predicting critical events at various life stages. The next important aspect is to combine operationally the outputs of various environmental models in relation to locust biology and critical events of life cycle like DYMEX professional model of Australia. A climate matching function can be used in the absence of any knowledge of the distribution of a species. This option can help the user to directly compare the temperature, rainfall and relative humidity of a given location with any number of other locations. It will provide a method of identifying sites with similar climates for assessing risk zones. Species-specific models could be developed after availability of detailed ground based information for event modeling. In the Life Cycle Builder module of Geo-LIMIS could be enhanced for calculating the values of its output variables at each time step. The sub-modules could be connected to an appropriate output variable of another or the same module by linking each of their input variables. During simulation, the value of that output variable can be used as
D. Dutta, et al.
423
the input value. Scope is there that model designer can configure most modules to adapt them for required task. Geo-LIMIS with little change in the input layers and habit suitability criteria interfaced with life stage builder specific to the species concerned could be used for modeling other exotic insect pests and near real time forecasting for ground surveillance and control strategy. ACKNOWLEDGEMENTS The authors express their deep sense of gratitude to Dr K. Kasturirangan, Chairman, ISRO and Secretary, DOS, for his constant encouragement and guidance during this study. We are grateful to Shri V. Sundaramaiya, Scientific Secretary, ISRO for his guidance and support to bring out this manuscript. The authors are also thankful to the Director, Space Research Institute, Kazakhstan for extending support and valuable information for successful completion of the project. REFERENCES Deveson, E.D. and Hunter, D.M. 2001. Decision Support for Australian Locust Management using Wireless Transfer of Field Survey Data and Automatic Internet Weather Data Collection (Unpublished). FAO, 1989. Desert Locust Research Priorities. Report of the FAO Research Advisory Panel, 2-5 May, 1989, Rome (FAO). FAO, 1994. The Desert Locust Guidelines 1. Biology and Behavior, Rome. Healey, R.G., Robertson, S.G., Magor, J.I., Pender, J. and Cressman, K. 1996. A GIS for Desert Locust Forecasting and Monitoring. Int. J. Geographical Information System, 10 (1): 117-136. http://pest.cpitt.uq.edu.au/forecast/intro.html. http://www.environment.gov.au/land/monitoring/green.html. Navathe, S. and Schkolnick, M. 1978. View Representation in logical database design. In Proceedings of ACK-SIGMOD International Conference on Management of Data. Austin, TX. (ACM Press), pp. 144-156. Pedgley, D.E. (editor) 1981. Desert Locust Forecasting Manual. Volume 1. (London: HMSO).