International Journal of Scientific & Engineering Research, Volume 6, Issue 6, June-2015 ISSN 2229-5518
1531
Design and Development of a Low Cost Prototype Food Penetrometer to Evaluate Quality of Foods A. P. Hashini I. Abeysuriya, S. B. Navaratne, P. L. A. G. Alwis Abstract— This study was undertaken to design and develop a low cost food penetrometer to measure quality of solid, semi-solid and liquid foods. This equipment specifically has designed to measure the force required for the penetrant to travel a constant distance into food sample. Two types of penetrants were tested with the developed equipment. A penetrant fabricated with aluminum and which is a half 0 hallow cone with 90 of internal angle was used for liquid and semi-solid foods. A penetrant fabricated with nylon and which is a solid cone 0 with an internal angle of 20 was used for solid foods. The developed food penetrometer was tested with different types of food samples including bread, yoghurt and a sugar solution. Reading of the fabricated food penetrometer for fresh bread was 0.1755N and readings were increased during the storage period. Food penetrometer readings for fresh yoghurt and spoiled yoghurt were 0.1704N and 0.1242N respectively. In sugar solution samples, readings from fabricated food penetrometer were gradually decreased during fermentation. Index Terms— Food rheology, Food texture, Low cost food penetrometer, Penetrant, Prototype food penetrometer, Quality of foods, Texture measurement
——————————
1 INTRODUCTION
R
——————————
IJSER
HEOLOGY is the science that studies the deformation and flow of matter [11] and texture can be regarded as manifestation of the rheological properties of foods. Rheology is an important attribute which affects processing and handling of foods and storage stability and stability during transportation. Rheological and textural properties of foods influence food habits, and affect shelf life and consumer acceptance of foods. In certain foods texture may be more important than flavor [13]. If texture of a food product is not compatible with the textural properties expected by consumer, it will affect the mouth feel and sense of organoleptic quality of the product [3], [5].
Rheological properties of foods can be changed during the storage period, while badly affecting the quality of foods. Evaluation of rheological properties of foods is important to assure the quality of the product, meet the desired quality expected by consumer and to ensure consistent quality over different batches. As well as rheological properties of food products can be varied at different stages of processing depending on the different processing conditions [1], [4], [11]. Therefore it is important to evaluate the rheological properties of foods during different processing stages to control the quality of the final product. As well as texture evaluation is a necessary component in research and development purposes of the food ————————————————
A.P.H.I. Abeysuriya is currently a Research officer in Department of Food Science and Technology in University of Sri Jayewardenepura, Sri Lanka, PH-0094714655599. E-mail:
[email protected] S.B. Navaratne is currently a Senior Lecturer in Department of Food Science and Technology in University of Sri Jayewardenepura, Sri Lanka, PH0094775095610. E-mail:
[email protected] P.L.A.G. Alwis is currently a Professor in Department of Agricultural Engineering in University of Ruhuna, Sri Lanka, PH-0094771230208. Email:
[email protected]
industry when achieving the competitive market. Meeting customer expectations in terms of food quality ensures the market retention of the company and makes higher financial returns on investment [11]. Texture measurement can be done by instrumental methods and sensory evaluation. Instrumental methods are more predictable as values are generated and cost is lower. But sensory methods are more expensive and time consuming [2], [11]. In Sri Lanka there are many small scale domestic food manufacturers who supply food products to the local market [6]. It is a great challenge for the small scale manufacturers to retain in the competitive market while satisfying needs of the customers by providing food products with higher quality. As mentioned earlier textural quality is an essential component in overall quality of a food product and therefore, it is important to evaluate textural quality before releasing product to the market [11]. There are many well developed technologies, techniques and sophisticated machinery like texture profile analyzer for evaluating rheological properties of foods which are practiced by many developed countries around the world. Almost of these equipment are very expensive and they are not affordable for small and medium scale food manufacturers in developing countries like Sri Lanka. Therefore it is a timely need of the local food industry to develop low cost texture measuring equipment in order to uplift the standard of living of the society by offering high quality foods for all. This will improve the qualitative contribution of small scale food manufacturers, in economical and social strengthening of developing countries. Therefore this study was under taken with the objective of designing and development of a low cost food penetrometer to evaluate quality of food products.
IJSER © 2015 http://www.ijser.org
1532
International Journal of Scientific & Engineering Research, Volume 6, Issue 6, June-2015 ISSN 2229-5518
2 MATERIALS AND METHODS 2.1 Designing of food penetrometer This food penetrometer was specially designed to measure the force required for the penetrant to travel a particular distance into the food sample. The equipment was designed with special design features of ease of handling, immaterial of high level of technical knowledge to operate, simplicity and portability. As well as, ability for local fabrication using available facilities and locally available raw materials in order to fabricate the equipment with minimum cost was highly considered. The design of the food penetrometer is in Fig. 1.
3 a b
c
Radius scale is important to identify the distance traveled by the penetrant and to identify whether the pointer at zero before starting the experiment. The sensitivity of the device has improved by radius scale as it can be used to identify even small variations from zero. Radius scale indicates the distance as double the value as penetrant travels. It helps to maintain high level of accuracy of measurements.
d
4
IJSER 7
2
of the penetrant facilitates obtaining of readings and enhances the sensitivity of the equipment. The designed penetrants are shown in Fig. 2. For semi-solid foods a half hallow cone with 900 of internal angle which is made out of aluminum was used. Internal angle of 900 and minimum weight (5g) used facilitate obtaining floating ability and penetrating ability in semi-solid foods. For solid foods solid cone with an internal angle of 200 and which is made out of nylon was used. First class lever system was designed to use in order to improve the sensitivity. Pointer of the radius scale is important to identify the traveled distance of the penetrant. Force required, for the penetrant, to travel the pre-determined particular distance is applied by adding weights into the weight loading unit. Pulley has connected with both “pointer with weight loading unit” and “adjustable counter weight”. A particular weight was placed along the pointer of the radius scale which is known as adjustable counter weight. This part is important to make the pointer of the radius scale to zero before starting the experiment by equalizing the moment of force in both sides.
Stage is the place where the food sample (6) that is going to be tested is placed. The stage is vertically adjustable. Vertically moveable stage is important to keep the food sample at particular distance from the penetrant. There is a nylon bush (7) which directs the penetrant linearly into the food sample. As well as there is a “U” shaped metal part just beyond the weight loading unit through which penetrating assembly was attached with the equipment. This “U” shaped metal part and the nylon bush allow linear motion of the penetrant.
6 5
(b)
(a) 1 Fig. 1. Design of the food penetrometer
Ø25.4mm Ø32mm
The designed food penetrometer consists of five major parts. They are base and the frame of the equipment (1), penetrating assembly (2), lever system (3), radius scale (4) and stage (5). The penetrating assembly consists of two main parts as removable penetrant and connecting spoke. Lever system of the equipment consists of four parts as pointer of the radius scale (a), weight loading unit (b), pulley (c) and adjustable counter weight (d). All parts of the equipment have connected with the frame and the base of the equipment. Penetrant is the part of the equipment which penetrates into the food sample. In this study, conical shaped penetrants were used. The conical shape IJSER © 2015 http://www.ijser.org
6.4mm
16mm 90
0
76mm 200
Fig. 2. Design of the penetrant for (a) semi-solid and liquid foods (b) solid foods
1533
International Journal of Scientific & Engineering Research, Volume 6, Issue 6, June-2015 ISSN 2229-5518
2.2 Material ordering and construction of the equipment After designing of the equipment, the materials required for the fabrication were ordered and construction of the equipment was done using stainless steel. Constructed food penetrometer is shown in Fig. 3. and constructed penetrating assemblies are shown in Fig. 4. First step of operating the constructed equipment is selecting the appropriate penetrating assembly according to the type of food going to be tested. After selecting the penetrating assembly it should be connected with the equipment, using the nut provided with the equipment. Pointer of the radius scale was made to zero by adjusting the counter weight. Then food sample was kept on the stage and stage was moved upwards until surface of the sample touches the tip of the penetrant. After making pointer to zero, force was applied on the penetrating assembly and because of this externally applied force, penetrant was penetrated into the food sample. Weights should be loaded until penetrant travels the particular distance. The distance traveled was identified using the radius scale.
(a)
(b)
Fig. 4. Constructed penetrating assembly for (a) semi-solid and liquid foods (b) solid foods
2.3 Preliminary testing Preliminary tests were carried out with two objectives. They are (1) calibrating the equipment for the penetrant and (2) ensuring proper functionality of the developed penetrometer and ensuring that readings significantly differ with different textural and rheological properties of matter. Calibrating of the equipment was done to check whether radius scale shows the distance as double the penetrant travels as designed. In this experiment force was applied until total height of the cone penetrates into a water sample and results were recorded. According to the results, when penetrating assembly penetrated 1mm into the sample, radius scale indicated it as 2mm. Error cross checking was done for further guarantying the relationship of actual depth of penetration and radius scale reading.
IJSER
Then experiments were carried out to ensure that penetrometer will give significantly different readings with respect to the nature of the material. Variations in readings (force) were observed when samples of water, wheat flour, wheat flour batter, liquid milk and yoghurt were tested with the equipment. By doing preliminary tests some problems associated with the constructed equipment were identified and necessary modifications were done to overcome those problems. Functionality of penetrometer after doing modifications was tested by re-doing preliminary tests. After confirming proper functionality of fabricated equipment, final tests were carried out.
2.4 Final testing Final tests were carried out to explore the relationship of the readings of developed food penetrometer with the quality of food products. Final tests were carried out with wheat flour bread as a solid food, plain yoghurt made with cow’s milk as a semi-solid food and sugar solution (5 brix degrees) as a liquid.
Fig. 3. Constructed food penetrometer
In final tests on bread, change in force required for the penetrant to travel a constant distance during the staling of bread was observed using developed food penetrometer. Force required for the penetrant to travel 16mm (or 32 units from the radius scale) into the slice of bread was measured using developed food penetrometer for four days. Penetrant made out of nylon with internal angle of 200 was used with bread. FreshIJSER © 2015 http://www.ijser.org
1534
International Journal of Scientific & Engineering Research, Volume 6, Issue 6, June-2015 ISSN 2229-5518
ly baked loaves of bread were randomly purchased from the local market. First readings were obtained from fresh loaves of bread and other loaves of bread were stored for further experiments. Readings were obtained in the morning and evening each day and readings were obtained from three different places of bread crumb. For final test on yoghurt, food penetrometer readings for fresh yoghurt and spoiled yoghurt were obtained using developed food penetrometer. Penetrant with internal angle of 900 and which is made out of aluminum was used for yoghurt. In the experiment with yoghurt, force required for the penetrant to penetrate 8mm of distance into the yoghurt sample (16 units from the radius scale) was measured. Readings were obtained using three yoghurt samples for each and from three different places of the same yoghurt sample. Final test was carried out on a sugar solution with 5 brix degrees. Change in readings was obtained using fabricated food penetrometer during fermentation of the sugar solution. Penetrant with internal angle of 900 and which is made out of aluminum was used for sugar solution. In the experiment with sugar solution, force required for the penetrant to penetrate 8mm of distance into the sugar solution (16 units from the radius scale) was measured.
correlation coefficient between force required for the penetration and days is 0.937. Therefore, there is a strong positive linear relationship. The regression equation for this relationship refers to (1)
(1) The reason for increase in penetrometer readings during the storage period of bread is increase in firmness of bread due to bread staling. Starch retrogradation during storage is responsible for bread staling. Unlike amylose, which is almost completely recrystallized after cooling, recrystallization of amylopectin requires more time and due to that it is considered the main reason for staling [12]. Bread staling result in harder texture in bread and it leads to increase in readings of developed food penetrometer. Reading of developed food penetrometer for fresh bread is 0.1755N or 17.91g. The firmness of bread crumb is important bread feature because it directly affects consumer preference. Therefore developed food penetrometer is important in evaluation of textural quality of bread. The reading of developed food penetrometer for fresh yoghurt is 0.1950N or 19.95g and for spoiled yoghurt it is 0.1242N or 12.67g. Spoilage of yoghurt leads to weakening of texture.
IJSER
3 RESULTS AND DISCUSSION
The readings, obtained using developed food penetrometer have shown significant difference depend on the textural nature of the food material.
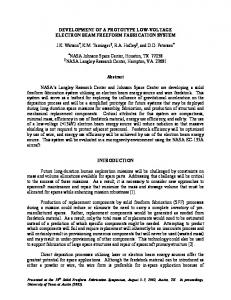
Change in food penetrometer readings of a sugar solution with 5 brix degrees during four days period was obtained. The chart of relationship between force required for penetration and days of storage has shown in fig. 6.
The readings for force required for penetration in bread samples were obtained during storage period of four days. The chart of the relationship between force required for penetration of 16mm into the bread crumb and days of storage has shown in fig. 5.
Fig. 6. Change in readings of developed food penetrometer during brix degrees
4 fermentation CITATIONS of a sugar solution with 5
Fig. 5. Change in readings of developed food penetrometer during storage period of bread
According to the graph in fig. 5. the force required for penetration has increased with time. As well as the Pearson
According to the readings obtained in prepared sugar solution, force required for the penetration has decreased with time. There is a strong negative linear relationship between force and days of fermentation with Pearson correlation coefficient of 0.966. With time fermentation is taken place in sugar solution and the force required for penetration has de-
IJSER © 2015 http://www.ijser.org
International Journal of Scientific & Engineering Research, Volume 6, Issue 6, June-2015 ISSN 2229-5518
creased. Regression equation between force required for penetration and days for the sugar solution refers to (2)
[2]
(2) The readings of developed food penetrometer had significant difference with quality changes of foods. According to the results, there is an interrelationship between penetrometer readings and period of storage. During the storage period of foods, the force required to penetration or the readings of the developed food penetrometer were changed. That is why, a significant difference could be observed in readings of developed food penetrometer with quality changes of food products. Total cost of fabrication of food penetrometer is LKR 6,500.00. The cost of fabrication of this food penetrometer is lower as locally available low cost materials were used.
4 CONCLUSION In this study a low cost prototype food penetrometer was designed and developed in order to evaluate the quality of food products. The developed food penetrometer can be used with semi-solid, liquid and some solid foods when appropriate penetrant is used.
1535
thesis, Dept. of Food Science, Univ. of Manitoba, Manitoba, 2001. A.A. Anton and F.B. Luciano, “Instrumental Texture Evaluation of Extruded Snack Foods”, Ciencia y Technologia Alimentaria, vol.5, no.4, pp.245-251, 2007.
[3]
E.K. Rogers and C.J.B. Brimelow, Instrumentation and Sensors for the Food Industr. (2nd Ed.). Cambridge: Woodhead Publishing Ltd., pp.519-545, 2001.
[4]
G.V.B. Canovas, J.L. Kokini, L. Ma and A. Ibarz, “The Rheology of Semiliquid Foods”, Advances in Food and Nutrition Research, vol.39, pp.1-69, 1996.
[5]
H.A. Barnes, A Hand Book of Elementary Rheology, Wales: University of Wales, pp.171-172, 2000.
[6]
K.K.D.S. Ranaweera, “Food Insecurity in Sri Lankan Scenario: Causes and Remedies”, The Journal of Agricultural Sciences, vol.2, no.2, pp.1331, 2006.
[7]
L. Chen and U.L. Opara, “Texture measurement approaches in fresh and processed foods”, Food Research International, vol.51, pp.823-835, 2013.
IJSER
Based on results, penetrometer reading for fresh bread is 0.1755N or 17.91g. Deviation of penetrometer reading from 0.1755N and reaches higher value indicates quality deterioration of bread. For fresh yoghurt the penetrometer reading is 0.1950N or 19.95g and for spoiled yoghurt it is 0.1242N or 12.67g. Fresh yoghurt with acceptable quality should have penetrometer value of 0.1950N. When this value is highly deviated and become close to lower value as 0.1242N, indicates poor quality of yoghurt due to manufacturing defects or textural quality deterioration due to prolonged storage. During four days of period, penetrometer readings of food penetrometer were decreased in the sugar solution. Using developed food penetrometer, quality changes occurred on foods can be well identified. It is feasible for local food industry because of its lower cost of fabrication.
[8]
M.A. Chauvin, “Food Texture and Perception”, PhD dissertation, Dept. of Food Science and Human Nutrition, Washington State Univ., Washington, 2007.
[9]
M.C. Bourne, “Measurement of shear and compression componenets of puncture tests”, Food Science, vol.31, pp.282-291, 1966.
[10] M.C. Bourne, “Use of the penetrometer for deformation testing of foods”, Food Science, vol.38, pp.720-721, 1973. [11] M.C. Bourne, Food Texture and Viscosity: Concepts and Measurement. (2nd Ed.). New York: Academic Press, pp.1-337, 2002.
[12] T.D. Handnadev, L. Dokic, M. Pojic, M. Handnadev, A. Torbica and S. Rakita, “Rheological properties of dough and quality of bread supplemented with emulsifying polysaccharides”, Hemijska industrija, vol.68, no.1, pp.99-106, 2014. [13] Y. Pomeranz and C.E. Meloan, Food Analysis: Theory and Practice. (3rd Ed.). Maryland: Aspen Publishers, Inc., pp.449-451, 2000.
ACKNOWLEDGMENT The authors wish to thank the academic and non academic staff of the Department of Food Science and Technology, University of Sri Jayewardenepura, Sri Lanka.
REFERENCES [1]
A. Anand, “Texture Related Mechanical Properties of Foods”, MSc IJSER © 2015 http://www.ijser.org