Debugger. â. Christoph Hofer, Marcus Denker ...... [WMFB+98] Robert J. Walker, Gail C. Murphy, Bjorn Freeman-Benson, Darin Wright, Darin. Swanson, and ...
Design and Implementation of a Backward-In-Time Debugger∗ Christoph Hofer, Marcus Denker Software Composition Group University of Bern, Switzerland
St´ephane Ducasse LISTIC Universit´e de Savoie, France
www.iam.unibe.ch/∼scg
www.listic.univ-savoie.fr
Abstract: Traditional debugging and stepping execution trace are well-accepted techniques to understand deep internals about a program. However in many cases navigating the stack trace is not enough to find bugs, since the cause of a bug is often not in the stack trace anymore and old state is lost, so out of reach from the debugger. In this paper, we present the design and implementation of a backward-in-time debugger for a dynamic language, i.e., a debugger that allows one to navigate back the history of the application. We present the design and implementation of a backward-in-time debugger called U NSTUCK and show our solution to key implementation challenges.
1
Introduction
Debuggers offer the ability to stop a program at a chosen place, either due to an error or an explicit request (breakpoint). They provide the current states of the involved objects together with a stack trace. However, while stepping through the code is a powerful technique to get a deep understanding of a certain functionality [DDN02], in many cases this information is not enough to find bugs. The programmer is often forced to build new hypotheses about the possible cause of the bugs, set new breakpoints and restart the program to find the source of the problem. Often several iterations are necessary and it may be difficult to recreate the exact same context [LHS99]. The questions a programmer has are often: “where was this variable set?”, “why is this object reference nil?” or “what was the previous state of that object?”. A static debugger cannot answer these questions, since it has only access to the current execution stack. There is no possibility to backtrack the state of an object or to find out why especially this object was passed to a method. The Omniscient Debugger is a first attempt to answer these problems [Lew03], however it is limited to java and instrumentation is done at bytecode load time. To understand the challenges faced by building a backward in time debugger, i.e., a debugger that allows one to query the state history of a program, we developed a backward ∗ Proceedings
of NODe 2006, Lecture Notes in Informatics, vol. P-88, 2006, pp. 17-32.
in time debugger in Squeak called U NSTUCK. For its implementation we collect rich information about the program execution in terms of events, which are used to recreate the state of objects at particular points in time. The contributions of this paper are: • A model for a back-in-time debugger. • A user interface to present and query the massive amount of data generated by the recording of all the objects states. • An implementation for Squeak Smalltalk The paper is organized as follows. Section 2 shows the problems of conventional debuggers. Section 3 then presents trace based debugging. After a short overview of the implementation in Section 5, we present related work in Section 7. Finally, we conclude in Section 8 with an overview of future work.
2
Why Stack Trace is Not Enough
After an error occured a standard debugger shows the current stack. The problem is that only methods which have not yet been executed are on the stack, those that have finished execution are no longer available. 2.1
A Simple Example
The following example demonstrates the problem: there is a class Foo with two instance variables var1 and var2 and the following methods: Foo�start self beforeBar. self bar. self moreBar. Foo�initialize var1 := 0. var2 := ’’. Foo�beforeBar var1 = 0 ifTrue: [var2 := nil.]. Foo�bar tmp tmp := 0. (var1 to: 10) do: [:each tmp := tmp + each ].
self var1: tmp. Foo�moreBar var2 size > 0 ifTrue: [ ˆvar2 at: 1]. ˆ’’
Accessor methods are defined for var1 and var2. Foo new start starts the program execution. The debugger comes up because of an error, var2 is nil in method moreBar (see 2.1 left).
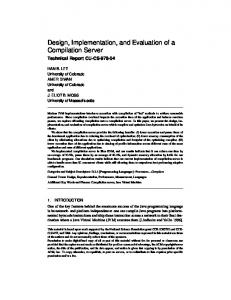
Figure 1: Left: error in the squeak Squeak debugger. Right: method calls and the resulting stack trace. Only the methods in the dashed box are in the stack trace when an error occurs in method moreBar
In a normal debugger, we see a stack trace: only methods on the stack are shown, those methods which have been completely executed are not available anymore. Figure 2.1 right shows a complete execution trace of all methods executed. Only a small part of that (visualized with the dashed box) are part of the stack trace the debugger can show. When inspecting objects, only the current state is accessible but the old state is lost. Even when selecting a method that is not on top of the stack, the debugger does not revert but presents the same state as before. Assume the situation in Figure 2.1 right: if we select moreBar: or bar:, the debugger presents the state of the program when the error occurred, even if the state has been different at the execution of these methods. Recapitulating there are mainly two issues: loss of execution trace and loss of objects old state.
2.2
The Debugging Problem
The missing information on the execution trace and object state makes debugging much harder: with a debugger that is unable to provide this information, we have to work around to get to this information by running the program multiple times with different breakpoints. For our example, typical steps we have to make to find the bug might be: • The first question is “Was the initialize method executed?” A breakpoint in the initialize method and a restart of the program confirm that the variables were properly initialized. • Putting another breakpoint in the setter method of var2 does not halt (the newly restarted) program. We learned that var2 was not set to nil over the setter method. But this does not help anything in finding the bug. • Now it is not clear where the next breakpoint should go. We have to explore the code deeper. There is no simple procedure to find the next place for a breakpoint. The debugger does not offer information about the previous values of var2 nor about where they were assigned. The bug is in an already finished method and the debugger cannot jump backwards to this method. To find the bug as fast as possible the programmer should not have to think about where to put breakpoints. From this example, we see that a developer missed ways to explore the complete execution trace. He should have the possibility to explore previous states of an object, navigate through the places where variables changed their value and analyze the already executed methods. Some approaches already used execution traces of programs, but in the context of debugging procedural languages [Duc99b], or for exploring and reverse engineering objectoriented applications [CM93,LN95,RD99]. In object-oriented program debugging, querybased debugging combines conditional breakpoints with logic queries, evaluating a querylike expression is evaluated each time a conditional breakpoint is reached [LHS97,LHS99]. However, such approaches require to add clever probes in advance. The Omniscient Debugger [Lew03] is an attempt to provide the full stack to the programmer. TestLog [DGW06] uses a logic engine to query the trace of object-oriented application with the possibility to query the previous state of objects.
3
U NSTUCK: A Backward-In-Time Debugger
Our solution to the problem presented before is to offer a debugger based on event traces and a specific interface to navigate backward in time.
3.1
Trace-Based Debugging
One solution to provide more advanced debugging support is to keep much more information about the execution of a program. For this purpose we collect events representing runtime data. For each method we record the name, the receiver, the arguments and the return value (see Section 5). This information is completed by collecting every write access to a variable (instance and local). This means that we record every state change. The collected events are basically a data structure containing the specific runtime information. There is one event for each method executed, its returned value and for every write access to a variable. This data can answer many of the questions a programmer has during debugging, but simple navigation through this mass of data is needed. We make a trace out of a set of given classes which are interesting for the user to debug. We instrument transparently the methods of these classes to produce the needed data at runtime. Further we will refer to objects from these classes as instrumented objects. The execution trace holds a huge amount of data, thus we need a methodology for interacting with the debugger, which is described in the following sections. 3.2
User Interface for Navigating the Execution
Basically the user interface of the Unstuck Debugger consists of several views on the collected data from the TraceLibrary, enhanced with search and navigation functions. In the following we describe these views. They are identified in Figure 2 with numbered black boxes. The corresponding number is specified in brackets. Method trace (1). Each line represents a method call. The format is of the form receiver# selector(arg1, arg2, ...) -> return value. Each line is indented according to the depth of the message sends. Methods can be collapsed if they are of no interest (and of course expanded as well). Methods can be highlighted for remembering them easily. We can step through the highlighted lines. For the receiver and the return value of the selected method the object history can be viewed in the object history (4) over a context menu. This view selects always the current method in the trace. It can change due to interaction with another view, too. Object views (2). There are two views displaying objects according to the currently selected method in the method trace: one displays the receiver of the method and the temporary variables (on the left side, the first line represents the receiver, beneath the temporary variables with the variable name), the other one the passed arguments (on the right side, with the argument’s name). If an object is instrumented, it can be expanded to display the instance variables. Thus each line represents an object: these lines can be inspected or used for the object history over the context menu. If an object is an instance variable of an instrumented object, the setter methods of this instance variable and the object it belongs to can be highlighted in the method trace using the context menu. This enables to quickly see where this instance variable
Figure 2: The user interface of the Unstuck Debugger.
changed. We can step through these highlighted methods in the method trace, or use the stepping functions provided by the UI: step to the next/previous/first/last value of this instance variable to navigate through the variable’s assignments. Source code (3). This view displays the source code of the current selected method in the method trace. Here the source mapping of the events is used to highlight the current event. Normal debugging steps are provided to step through the source code (respectively through the events). The user can select source code and inspect it. He can also change manually the current focus in the execution trace. The object history can display the history for the current selected object. This view is used to program, i.e., the source code can be edited and recompiled. Object history (4). This view displays every occurence of a user-selected object in the trace. The events are message reception by the object, object passed as argument, object state change, object’s variable assignment or object returned from a method. This is useful for backtracking an object, because if we have an occurence in the trace, we can go backwards through the trace with this object. Back to a previous occurence, see what happend to the object. We see where it was passed as an ar-
Variable event send return varAccess instVarAccess tempVarAccess
Search domain All events Events representing a method send Events representing a method’s return Events representing a variable store (instance or local) Events representing only an instance variable store Events representing only a local variable store Table 1: Predefined search variables
gument, thus we know from where it came, finally arriving at the first occurrence (normally its creation). Searching (5). This pane consists of a simple search field, where the user can query the events. The method trace (1) highlights the found events. Section 3.3.1 presents this functionality in more detail.
3.3
Additional User Interface Features
We need supplementary features to locate interesting events and to mark interesting objects that will help finding bugs. In the following sections we describe the searching and coloring functions. 3.3.1
Simple Searching
Searching is important and thus should be simple. This is realized in the following manner: there is only one search field where the programmer can provide a boolean expression to identify specific events. Some predefined variables are available: event for searching in all the trace events (variable access or message send), send for searching only message send events. Table 1 presents the predefined variables that the programmer can used. In the current version, it is not possible to define other variables. Appropriate accessor methods are available for the events to access the collected runtime data (as shown in Table 2). The expression is used as the selection criteria on the adequate events. The result of the search is a set of events, which are then highlighted in the method trace. The search expression is expressed in the implementation language, here Smalltalk. With this approach users are familiar with the search language, they can access the needed data using a known language. In addition, they have full access to the domain objects (via e.g., event sender). Thus it is easy to add methods to the domain classes to simplify the more complex queries.
Query send selector = #foo varAccess newValue class = Foo return returnValue > 4 events isSend & (event arg1 = 4) & (event arguments size = 1)
Result All the executed methods named ”foo” Every variable assignment, where the assigned object’s class is Foo All returns with a return value greater than 4 Only methods which have exactly one argument, which was 4
Table 2: Some search expression examples
3.3.2
Coloring
Coloring is a useful tool for the developer: it enables tracking objects. The user can assign a color for an object in the trace. Various views (method trace, object views, object history) highlight the object with the assigned color. So it is easy to see if that object was passed as an argument, or was the receiver of a message or the instance variable of another object. For an example see Figure 2. In the method trace an object (“a RBMethodNode”) is colored. The user can easily detect the object in the trace and quickly see when it was the receiver of a message, an argument or the returned value.
4
Finding our Bug with the Unstuck Debugger
Coming back to the problem we presented in Section 2, here is how we solve it with the Unstuck Debugger: • Start the Unstuck Debugger. • Select the class Foo and provide the code to start the execution (Foo new start). • The Unstuck Debugger instruments the bytecode of the methods of Foo, starts the program and collects the execution trace and presents it in the main user window. • The error is already visible and it is obvious that nil received the message size. • We want to see the code with the call of the message size, thus we step one back in the source view. The source code shows now that var2 received the message size • Select var2 in the source code or in the object view. • Highlight the modifiers of var2 (see Figure 3). • There are two modifiers: one in the initialize method and one in beforeBar, which is the faulty one. • Another possibility is to highlight var2 in the object view and use the stepping functions for the modifiers.
Figure 3: Left: highlight the modifiers of a variable over the context menu in the source view. Right: the result of the action made on the left side: highlighted methods in which var2 was modified (i.e., changed the value)
The Unstuck Debugger offers us with the information we needed: the modifiers of var2. They are only available because the old state and the execution trace are not lost. We do have to think about breakpoints but instead can directly navigate to the source of the bug.
5
Implementation
U NSTUCK is implemented in Squeak, the open-source Smalltalk distribution [IKM+ 97]. U NSTUCK is based on the TraceLibrary which offers execution trace infrastructure. Basically the debugger collects the events, orders them and prepares the state reconstruction. To generate events (method invocation, variable access and method return), the methods are instrumented using B YTE S URGEON which is a high-level library to manipulate method bytecodes [DDT06]. Figure 4 shows the different layers. The following subsections describe each layer and how they work together. Trace
* 1..*
Debugger uses
Event timestamp depth sourceRange method
Trace Library uses ByteSurgeon
MessageSend selector receiver arguments definitionClass
Access varName newValue
Return returnedValue
Figure 4: Left: the TraceLibrary is built on top of B YTE S URGEON and the Unstuck Debugger is build on top of the TraceLibrary. Right: the Trace and Event model.
5.1
Trace Library
The TraceLibrary supports the generation of execution traces from a set of classes and the code to start the program. B YTE S URGEON instruments the methods of the given classes to generate the events at runtime. During the execution, a collector gathers these events and forms the program trace. 5.1.1
The Trace and Event Model
A trace is composed of events, depending on the situation the events are holding different information depending of the kind of events they represent and also whether the method execution terminated or not: • An event representing a message sent describes the selector, the receiver, the arguments, as well as the definition class of the method, i.e., the class which defines the method and holds the source code. • When the method returns, a return event is generated with the returned value. • When the value of a variable (instance or temporary variable) is changed, a write access event is generated holding the variable name and the new value. Additionally every event holds a source range, the mapping between the bytecode and the sourcecode. The depth of an event and the timestamp are added when the collector collects the events. Figure 4 shows an UML diagram of the model: a trace consists of several Events. There are specific events, which are containing different information as mentioned before. The non-specific Event class shows which information is common to all events. For optimizing the model, a tree is built: an Event belongs to one MessageSend, thus a MessageSend can have multiple Events. 5.1.2
Event Processing
A collector, a TraceCollector, collects these events at runtime and processes them to define an order, to optimize the data structure and to prepare state reconstruction of the objects (receiver, variables and arguments) participating to the trace. Order Definition. The collector has the responsibility to define the order of the event it receives, events are tagged with a timestamp. The depth of the event is also calculated by collector. Data structure optimization. We create an event tree from a sequence of events, using the return events as marker of the end of a method execution. Back pointers to navigate from the subevents to the parent events are also managed as part of this process.
State reconstruction preparation. The collector handles every occurrence of objects in the trace for later state reconstruction. By state reconstruction we mean the ability to reconstruct the exact state of an object at any point in time as we will explain in Section 5.1.3. We distinguish three cases for treating all the objects participating into an event (i.e., receiver, arguments, variables): objects that are instances of instrumented classes, instances of other classes and collection instances. • Instrumented objects: they do not need any special handling. The collector gets the state changes of such objects from instance variable write access events. With these changes we are able to provide the state of these objects at any time by applying the latest change before that point in time. • Non instrumented objects: to remember their state the collector copies these objects. • Collections: because a collector does not get any events for changes in a collection, a copy of a collection is saved with the current timestamp. Basically a collector creates a new collection of the same kind and processes every object of the collection as if it would be in the trace, i.e., recursively apply the same process: check if the object is instrumented or not, if it is a collection and process them as described above. To support object identity checks, each event has a pointer to the original object and in addition for non instrumented objects to their copy. When a collector gathers an event from an instance variable write access, then the new value represents a state change of an instrumented object. This change is tied with the current timestamp and the variable name to the corresponding object. This is useful for later state reconstruction, because we do not have to go through the whole trace and collect the needed changes. Note that the previous behavior is not necessary since we could walk over the trace and collect all changes belonging to an object. Here they are just ordered at runtime and acts as a cache. 5.1.3
State Reconstruction
State reconstruction is the process of reverting an object’s state to any desired point in time in the trace. As explained above a collector prepared the state reconstruction. Depending on the type of objects, the reconstruction is different: • Instrumented objects: for every instance variable we take the latest change before the desired time and apply this change. The applied value is reverted to the desired time, too. • Non instrumented objects: no reconstruction needed, we just take the copy the collector has made and associated with the event. • Collections: we take the last occurence of the collection in the trace and every object inside is reverted to the desired time.
The following examples show the special handling of collections: the first example adds a collection to the receiver which is aCollection too. Let’s assume that the method addAll: is not instrumented but the expression is inside an instrumented method. ... aCollection addAll: anotherCollection ... ˆ someExpression
When the collector treats the MessageSend for the method addAll:, it processes the two collections (because they were involved in the method’s execution, as the receiver and as an argument). The collector creates a new collection with the current objects inside to remember which ones were in the collection at this time and handles each object inside as it would be an object in the trace (as described in Section 5.1.2). The same happens when the collector receives a Return event. To get the state of a collection right before this method was executed, we take the new collection created by the collector and reconstruct the state of the objects inside. To get the state of the collection after this method was executed, we take the second collection the collector created when it was treating the return event. This collection includes the newly added objects, thus we get the right state back. ... aCollection foo: otherCollection ... ˆ someExpression
with foo defined as: foo: collection collection removeFirst
Similarly to the previous example, let’s assume that the method foo: is not instrumented. In addition, let’s assume that we have two objects inside otherCollection, one instrumented and other not. After the execution of foo:, the collector creates a new collection. The instrumented object is put in it, and a copy of the not instrumented one. Thus we remark that the otherCollection has changed. To get the state at the end of the method’s execution, we take the newly created collection and put the two following objects inside: the reverted instrumented one (by applying the latest changes) and the copy of the not instrumented object. 5.2
Event Gathering Using B YTE S URGEON
B YTE S URGEON [DDT06] is a tool for transforming Smalltalk bytecode at runtime. It provides high-level abstractions, thus developers do not need to program at bytecode level. Bytecodes are low-level instructions for the Virtual Machine stack machine. B YTE S URGEON can insert code before, after or for an instruction. This code is passed in form of
a string of Smalltalk code. If we insert code after an instruction, it will be executed right after the execution of the instruction. Additionaly B YTE S URGEON provides the same functionality for methods instead of instructions. For accessing runtime information (such as the receiver of a message, the passed arguments), B YTE S URGEON provides meta variables. They have a special syntax () and can be added to the string that represents the code to insert. B YTE S URGEON provides the receiver, the arguments and the returned value of a message send, the variable name and the new value of a write access to a variable. The IRInstruction (an intermediate representation, which represents a bytecode instruction) delivers the static information, i.e., the selector and the definition class of a message send and the source range of all events. As an example we describe how to generate the method send events of a method: B YTE S URGEON iterates over the IRInstructions, thus we work with an IRSend, which represents a message send at bytecode level. It provides the static information (selector, source range, definitionclass). B YTE S URGEON provides the runtime information over meta variables (the receiver is accessible with , the arguments with ). B YTE S URGEON takes a string to insert code, thus we generate the string as follows: ’TraceCollector default take: (MessageSend withSelector: ’, instr selector printString ,’ withArguments: withReceiver: withSourceRange: ’, instr sourceRange printString , ’ class: ’, instr superOf printString,’)’
// include the selector // include the arguments // include the receiver // include the source range // include the definition class
This generates our needed event and the collector stores it. Then we instrument every send in a method with the following code: aCompiledMethod instrument: [:instr instr isSend ifTrue: [instr insertBefore: theString]].
6
Evaluation and Discussion
For evaluating the practicality of our Unstuck Debugger implementation, we provide three benchmarks: the simple example shown in Section 1, then a bug of the Squeak abstract syntax tree (AST) that results in a slightly larger trace. The third case study (Pier) is the trace resulting from running the tests of a larger system. We show the number of events, the slowdown compared to a simulated run in the standard Debugger and memory usage.
Simple Example AST Bug Pier Trace
Number of events 74 2725 389689
Slowdown 6 3.8 248
Memory usage (kb) 16 800 88800
With a slowdown of 4-6 times, the program is still usable for debugging, but as soon as the traces get large, runtime degrades. Memory grows linearly, as expected. This suggests runtime as the main focus for future research (see Section 8).
7
Related work
Whyline [KM04] implements Interrogative Debugging for Alice a 3D world [Ali]. Here the focus lies on providing an interface to ask questions such as why or why not things are happening in an Alice world. Thus this debugging facilities are totally tied to the, quite simple, domain model of Alice. Such an approach does not scale when the domain is more complex as in normal development. Visualising debuggers can work directly via instrumentation on the program being executed, or are based on post-mortem traces [CM93, LN95]. Visualisation of dynamic information is also related to our work in the sense that it is based on a program trace. DePauw et al. [DPLVW98] and Walker et al. [WMFB+ 98] use program events traces to visualise program execution patterns and event-based object relationships such as method invocations and object creation. Query-based debugging [LHS97,LHS99] use logic programming to express complex queries over a large number of object. Some queries are triggered at run-time while the program is running. The logic queries act as clever program probes. Here the intention is different, in our approach we navigate the history of the program. Caffeine [GDJ02] is a Java-based tool that uses the Java debugging API to capture execution events and uses a Prolog variant to express and execute queries on a dynamic trace. Caffeine does not support state history access. TestLog [DGW06] which uses a logic engine to query the trace of object-oriented applications, is much closer to Unstuck Debugger since it offers the possibility to query the previous state of objects. However, no user interface is provided. OPIUM [Duc99b] is a tool that allows a user to debug Prolog program using a set of debugging queries on event traces. Prolog is used as a base language and as meta language to reason about events. The main usage scenario of OPIUM is the implementation of a high level debugger for Prolog that allows forward navigation to the next event that satisfies a certain condition. Coca [Duc99a] supports the debugging of C programs based on events. Opium and Coca are mainly used to show the values of variables. In addition, both Opium and Coca do not support object-oriented programming. In addition, the history of object state is not available. Auguston [Aug98, Aug95] also uses a trace composed of event models and test programs. However it is based on procedural programming languages and does not take into account the specific behavioural aspects of object-oriented languages such object creation and the
state of objects. Lewis in [Lew03] proposes to merge the approach of omniscient debuggers which collect all the run-time information and supports the exploration of the history and event-based tools that monitors program execution and allow queries. It however it is limited to java and instrumentation is done at bytecode load time. ZStep [LF98] provides a back-in-time debugger for Lisp. The focus of this research was to provide a environment that allows reversing both program state and the side effects of GUI output to understand the correspondence between static program code and dynamic program execution.
8
Conclusion and future work
In many cases the Unstuck Debugger provides an improvement over conventional debugging: if we have a faulty value it is easy to find the place where it was set uncorrectly. The bug can be chased in the program history. Such a kind of behavior is not possible in a normal debugger where this work has do be done manually using multiple restart and breakpoints. When we select a message send in the Unstuck Debugger it is like we stopped the program there with a breakpoint. We have the same information, but there is no need to put a new breakpoint for stopping the program in another situation. In the debugger we can just go there. Completed with backtracking and searching functions the debugger helps us finding bugs much faster. To have all this information available there is a price to pay: a slow down of application runtime. But this needs to be compared to the time won when finding bugs. Up until now the Unstuck Debugger has been working on limited but still challenging case studies such as debugging abstract syntax tree and compiler internals. An application to larger systems has shown that both execution speed and memory consumption need to be analyzed and improved. In addition as Smalltalk offers a dynamic programming style with on the fly recompilation, we plan to investigate if it is realistic to instrument the complete environment and be able to debug any application without having to provide a program seed. Other possible enhancements are support for threads and the ability to restart execution in the past: the Unstuck Debugger should be able restart the execution trace from any point in the past but this would require to recreate stack execution on the fly. Acknowledgments. We acknowledge the financial support of the Swiss National Science Foundation for the project “A Unified Approach to Composition and Extensibility” (SNF Project No. 200020-105091/1, Oct. 2004 - Sept. 2006) and the french ANR project “Cook: R´earchitecturisation des applications industrielles objets” (JC05 42872)
References [Ali]
Alice. http://www.alice.org.
[Aug95]
M. Auguston. Program Behavior Model Based on Event Grammar and its Application for Debugging Automation. In 2nd International Workshop on Automated and Algorithmic Debugging, Saint-Malo, France, May 1995.
[Aug98]
M. Auguston. Building program Behavior Models. In European Conference on Artificial Intelligence ECAI-98, Workshop on Spatial and Temporal Reasoning, Brighton, England, August 1998.
[CM93]
Mariano P. Consens and Alberto O. Mendelzon. Hy+: A Hygraph-based Query and Visualisation System. In Proceeding of the 1993 ACM SIGMOD International Conference on Management Data, SIGMOD Record Volume 22, No. 2, pages 511–516, 1993.
[DDN02]
Serge Demeyer, St´ephane Ducasse, and Oscar Nierstrasz. Object-Oriented Reengineering Patterns. Morgan Kaufmann, 2002.
[DDT06]
´ Tanter. Runtime Bytecode TransformaMarcus Denker, St´ephane Ducasse, and Eric tion for Smalltalk. Journal of Computer Languages, Systems and Structures, 32(23):125–139, July 2006.
[DGW06]
St´ephane Ducasse, Tudor Gˆırba, and Roel Wuyts. Object-Oriented Legacy System Trace-based Logic Testing. In Proceedings 10th European Conference on Software Maintenance and Reengineering (CSMR 2006), pages 35–44. IEEE Computer Society Press, 2006.
[DPLVW98] Wim De Pauw, David Lorenz, John Vlissides, and Mark Wegman. Execution Patterns in Object-Oriented Visualization. In Proceedings Conference on Object-Oriented Technologies and Systems (COOTS ’98), pages 219–234. USENIX, 1998. [Duc99a]
Mireille Ducass´e. Coca: An Automated Debugger for C. In International Conference on Software Engineering, pages 154–168, 1999.
[Duc99b]
Mireille Ducass´e. Opium: An extendable trace analyser for Prolog. The Journal of Logic programming, 1999.
[GDJ02]
Yann-Ga¨el Gu´eh´eneuc, R´emi Douence, and Narendra Jussien. No Java without Caffeine: A Tool for Dynamic Analysis of Java Programs. In ASE, page 117. IEEE Computer Society, 2002.
[IKM+ 97]
Dan Ingalls, Ted Kaehler, John Maloney, Scott Wallace, and Alan Kay. Back to the Future: The Story of Squeak, A Practical Smalltalk Written in Itself. In Proceedings OOPSLA ’97, ACM SIGPLAN Notices, pages 318–326. ACM Press, November 1997.
[KM04]
Andrew J. Ko and Brad A. Myers. Designing the whyline: a debugging interface for asking questions about program behavior. In Proceedings of ACM CHI 2004 Conference on Human Factors in Computing Systems, volume 1, pages 151–158, 2004.
[Lew03]
Bill Lewis. Debugging Backwards in Time. In Proceedings of the Fifth International Workshop on Automated Debugging (AADEBUG 2003), October 2003.
[LF98]
Henry Lieberman and Christoper Fry. ZStep 95: A reversible, animated source code stepper. In John Stasko, John Domingue, Marc H. Brown, and Blaine A. Price, editors, Software Visualization — Programming as a Multimedia Experience, pages 277–292, Cambridge, MA-London, 1998. The MIT Press.
[LHS97]
Raimondas Lencevicius, Urs H¨olzle, and Ambuj K. Singh. Query-Based Debugging of Object-Oriented Programs. In Proceedings OOPSLA ’97, ACM SIGPLAN, pages 304–317, October 1997.
[LHS99]
Raimondas Lencevicius, Urs H¨olzle, and Ambuj Kumar Singh. Dynamic QueryBased Debugging. In R. Guerraoui, editor, Proceedings ECOOP ’99, volume 1628 of LNCS, pages 135–160, Lisbon, Portugal, June 1999. Springer-Verlag.
[LN95]
Danny Lange and Yuichi Nakamura. Interactive Visualization of Design Patterns can help in Framework Understanding. In Proceedings ACM International Conference on Object-Oriented Programming Systems, Languages and Applications (OOPSLA 1995), pages 342–357, New York NY, 1995. ACM Press.
[RD99]
Tamar Richner and St´ephane Ducasse. Recovering High-Level Views of ObjectOriented Applications from Static and Dynamic Information. In Hongji Yang and Lee White, editors, Proceedings IEEE International Conference on Software Maintenance (ICSM 1999), pages 13–22, Los Alamitos CA, September 1999. IEEE Computer Society Press.
[WMFB+ 98] Robert J. Walker, Gail C. Murphy, Bjorn Freeman-Benson, Darin Wright, Darin Swanson, and Jeremy Isaak. Visualizing Dynamic Software System Information through High-Level Models. In Proceedings OOPSLA ’98, pages 271–283. ACM, October 1998.