Available online at www.sciencedirect.com
ScienceDirect Procedia Technology 17 (2014) 542 – 549
Conference on Electronics, Telecommunications and Computers – CETC 2013
Design and Implementation of a Wireless Multiparameter Patient Monitoring System João Martinhoa, Luís Pratesa, João Costaa,b* b
a ADEETC, ISEL, Rua Conselheiro Emídio Navarro 1, Lisbon, 1959-007, Portugal CTS-UNINOVA, Quinta da Torre, Monte da Caparica, 2829-516, Caparica, Portugal
Abstract In this paper we describe the design and successful implementation of a remotely operated physiological monitoring device. The prototype performs acquisition of three types of physiological measurements: electrocardiography, finger photoplethysmography, and blood pressure plethysmography. Various components are shared in the acquisition of the three signals, such as the microcontroller, the communication module and part of the analog front-end to achieve a low cost integrated device. The waveforms are sent to a remote backend server using a Wi-Fi internet connection. The system is designed so that the device can be controlled remotely without the patients’ intervention. © ©2014 2014The TheAuthors. Authors.Published Publishedby byElsevier ElsevierLtd. Ltd.This is an open access article under the CC BY-NC-ND license (http://creativecommons.org/licenses/by-nc-nd/3.0/). Selection and peer-review under responsibility of ISEL – Instituto Superior de Engenharia de Lisboa. Peer-review under responsibility of ISEL – Instituto Superior de Engenharia de Lisboa, Lisbon, PORTUGAL. Keywords: ECG; blood pressure; oximetry; biotelemetry
1. Introduction Major advances in the field of telecommunications have led to widespread availability of packet data services in urban areas. There is growing expectation that such communication networks will have an impact in the way health care is provided to the population. The interest is further motivated by the social relevance of the topic and the huge potential market represented by the ageing population of developed countries.
* Corresponding author. Tel.: +0-000-000-0000 ; fax: +0-000-000-0000 . E-mail address:
[email protected]
2212-0173 © 2014 The Authors. Published by Elsevier Ltd. This is an open access article under the CC BY-NC-ND license (http://creativecommons.org/licenses/by-nc-nd/3.0/). Peer-review under responsibility of ISEL – Instituto Superior de Engenharia de Lisboa, Lisbon, PORTUGAL. doi:10.1016/j.protcy.2014.10.261
João Martinho et al. / Procedia Technology 17 (2014) 542 – 549
543
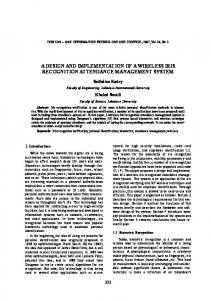
On the other hand, microelectronics has also evolved and we are now at a point where low cost and low power embedded microcontrollers have performance characteristics that allow acquisition, control, and communication of multiple biomedical signals in real time. The microcontroller units can be integrated with external network modules to take advantage of the infrastructure of modern communication networks. Unsurprisingly a number of portable and wireless devices for electrocardiography (ECG), blood pressure plethysmography and pulsed oximetry have been proposed for remote physiological monitoring [1-10]. Shih et al [1] have proposed a telemedicine system based on an 8-bit microcontroller for monitoring the ECG signal of elderly patients. One interesting feature is that radio frequency technology was incorporated to avoid the problem of mistaken identity. Ken et al. [2] presented a description and system architecture for a telecardiology monitoring system based on the Wi-Fi network. In [3] the authors developed a single lead system for on line acquisition of the ECG signal where processing is accomplished using a MATLAB™-based Graphical User Interface. The authors in [4] reported an Holter system based on communication via Multimedia Messaging Service (MMS). In [5] the authors presented a prototype for monitoring the user’s ECG and physical activity using accelerometer data. In this case data is first transmitted to a handheld device using Bluetooth and then forward to a backend server using the cellular network. In [6] there is a description of a multiparameter medical monitoring and alert system capable of measuring blood pressure, oxygen saturation in blood (SpO2), and the ECG signal. The device includes a GSM transceiver for sending and receiving data through mobile networks. All the interest in multiparameter monitoring is justified not only because of the obvious advantage of added functionality but also due to the potential to combine multiple signals to obtain more reliable physiological measurements. In fact, Spulak et al. [7] combined ECG and photoplethysmography (PPG) to compute the pulse arrival time between the heart and finger which provides an alternative approach to estimate mean blood pressure. Other studies have used a combination PPG signals to estimate mean blood pressure [8], [9]. In this article we focus on the development of a portable device for electrocardiography, finger photoplethysmography, and blood pressure plethysmography. In comparison with other works [6], [10] we focus on an inexpensive and low-complexity device. The signals are sent to a remote backend server, so no signal processing is done on the portable unit, which is controlled by a simple 8-bit microcontroller. Part of the analog front-end is shared between several signals and the communication sub-system is based on the popular IEEE 802.11 (Wi-Fi) protocol. In fact the unit includes a network adapter module which connects to an access point. While other works have focused mainly on generic hardware integration [11] this paper details the design of various sub-systems at the circuit level. The proposed design was fully implemented in printed circuit board and the results are reported here. This document is structured as follows. We first present an overview of the device and the operation scenario. Then we describe the implemented circuits and the communication sub-system. Finally we present results of signals acquired and transmitted to a remote PC and summarize the conclusions. 2. System Overview and Methods The system block diagram is illustrated in Fig. 1. The biomedical signals are acquired by the wireless measurement unit and sent to a remote computer with an internet connection. A graphic application running on the remote PC is used to visualize the signals and to issue commands, such as to start or stop signal acquisition. Signal conditioning is critical since the amplitude of the original physiological signals may be in the millivolt range.
544
João Martinho et al. / Procedia Technology 17 (2014) 542 – 549
Fig.1 -System block diagram. A remote PC unit is used to command and visualize the acquisition of the photoplethysmographic signal (PPG signal), the electrocardiographic signal (ECG signal) and the blood pressure plethysmographic signal (BP-PG signal).
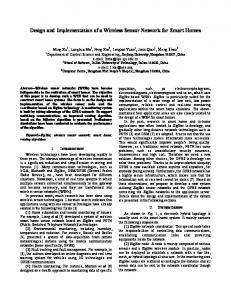
2.1. Microcontroller Unit The microcontroller unit (MCU) at the heart of the device is an atmega328 (Atmel Corporation, USA) with 32 kB flash memory and an integrated 10 bit ADC. As represented in Fig.2 the clock signal is generated by an external 16 MHz crystal. The MCU performs several key functions such as: sampling of analog signals; serial communication to the Wi-Fi module via UART TTL (5V); switching on and off the air pump, pressure valve; red and infrared LEDs and control of switches which allow reconfiguration of the analog front-end. In Fig.2 components IC2 and IC3 are voltage regulators for 5V and 3.3V, respectively. The latter is necessary to supply the Wi-Fi module. The circuit also includes a push-button (S1) to reset the device and one header for in circuit serial programming. The MCU can be programed in C using the programming tools provided by Atmel or even the popular Arduino software using a USB to serial converter.
Fig. 2–Schematic of the MCU unit and Wi-Fi module. For clarity only the most relevant connections to the MCU are shown.
João Martinho et al. / Procedia Technology 17 (2014) 542 – 549
545
2.2. Blood Pressure Plethysmogram The blood pressure plethysmogram is obtained based on the oscillatory method. The signal is measured using an arm cuff and a semiconductor pressure sensor integrated in a wheatstone bridge (US916, Unisense, Denmark). The circuit is represented in
Fig 3. The cuff is inflated by an air pump motor, and deflated by a pressure valve, both under the control of the MCU. In Fig. 3 T1 and T2 are transistors to switch on and off the air pump and the valve respectively.
Fig.3 –Schematic of the blood pressure plethysmogram circuit
The first stage of amplification is implemented with the instrumentation amplifier IC3 which is necessary to measure the floating voltage provided by the pressure sensor. The high pass filter C2 and R5 with cutoff at 0.48Hz removes the dc offset before further amplification by an adjustable non-inverting amplifier comprising IC2, R6 and R7. Finally R9 and C3 provide an adjustable low pass filter. The role of IC1 is to provide a reference voltage above ground level. 2.3. Electrocardiogram and Photoplethysmogram The PPG light sources are LEDs with peak wavelengths in the red (650 nm) and infrared (950nm) region. LED frequency can be adjusted by software and is set by default to 33 Hz. Light crosses the finger and is detected with a silicon photodiode on the opposite side. From the different absorption characteristics of oxygenated and deoxygenated hemoglobin it is possible to estimate oxygen saturation in blood. A transimpedance amplifier (IC9 and associated components in Fig.4) converts the photocurrent to voltage. Next a high pass filter with cutoff frequency at 0.16Hz removes the DC component and an amplifier/low pass filter with cutoff at 234 Hz removes high frequency noise and avoids aliasing.
546
João Martinho et al. / Procedia Technology 17 (2014) 542 – 549
Fig.4 –Schematic of the ECG and PPG circuits.
A single lead ECG acquisition circuit with one reference electrode was implemented (see Fig.4). Amplification and filtering with high pass filter cutoff at 0.16Hz and low pass filter at 103Hz was implemented. The amplification can be adjusted with a potentiometer. Depending on the switch configuration (IC6) either the ECG or PPG signal is applied to the notch filter to remove the 50 Hz power line interference. After the filter the signal is sampled by the analog to digital converter integrated in the MCU. 2.4. Communication and User Interface The wireless communication is based on IEEE's 802.11b wireless local-area networking standard, known also by the commercial trademark Wi-Fi. A small Wi-Fi module (WiFly, Roving Networks, US) is integrated in the measurement device to allow secure authentication and TCP/IP networking. Wi-Fi is an interesting solution because of the increasing number of hotspots available in urban areas. In addition to the hotspots offered directly by telecommunication operators in public places, connectivity is also provided by broadband residential customers who share their surplus bandwidth for being part of hotspot communities. The measurement unit makes connection to a remote TCP/IP server with a fixed IP address where a graphical user interface developed in JAVA has been installed. From the application the operator may initiate measurements and visualize the results. 3. Results and Conclusions We present a few examples of physiological signals obtained using the device. In Fig. 5 and Fig. 6 the red and infrared curves from PPG are presented. As expected the signals have the heart rate frequency and display the typical systolic and diastolic phases. The dicrotic notch is clearly visible, a hallmark of good blood perfusion.
João Martinho et al. / Procedia Technology 17 (2014) 542 – 549
547
Fig.5 –Red LED photoplethysmogram
The red and infrared photoplethysmograms are obtained by alternating illumination with the red and infrared LEDS for15 ms intervals. This is necessary to compare the curves on the same cardiac cycle.
Fig.6 –Infrared LED photoplethysmogram
In Fig. 7 the typical ECG signal can be observed. This was obtained with dry clamp electrodes located on the wrists. The T wave and the QRS complex associated with ventricle contraction are clearly visible.
Fig.7 –ECG signal
Fig. 8 shows the blood pressure plethysmographic signal. The figure displays a time window where the signal is in synchrony with the cyclic expansion and contraction of the brachial artery. As the cuff deflates from high pressure the amplitude of oscillations first increases and then decreases. Interestingly we also observe a lower frequency modulation signal that can be present due to respiration [12].
548
João Martinho et al. / Procedia Technology 17 (2014) 542 – 549
Fig. 8 –Blood pressure plethysmogram signal
Finally Fig. 9 is an image of various components of the measurement unit, including the printed circuit boards, the electrodes and the arm cuff .
Fig. 9 –Components of the measurement device
In conclusion, a remotely operated device for physiological measurements was presented. We have focused on a low-cost device supported by a common 8-bit microcontroller and simple hardware modules. The increasing number of hotspots available in urban centers has motivated us to use IEEE's 802.11 wireless local-area networking standard. Future work will be directed to the backend server where digital signal processing and calibration tables may be used to extract various useful parameters from the acquired signals, such as mean blood pressure and SpO2. References [1] H. C. B. L. S. L. D.H. Shih, “An embedded mobile ECG reasoning system for elderly patients,” IEEE Trans. Inf. Technol. Biomed, 2010., vol. 14, pp. 854-865. [2] C. Ken and L. Xiaoying, “Development of WI-FI Based Telecardiology Monitoring System,” in 2nd International Workshop on Intelligent Systems and Applications (ISA), 2010. [3] J. B. M. M. R. Gupta, “ Development of an embedded system and MATLAB-based GUI for online acquisition and analysis of ECG signal,” Measurement, 2010, vol. 43, pp. 1119-1126. [4] M.-F. Y. K.-C. C. R.-G. L. C. Wen, “Real-time ECG telemonitoring system design with mobile phone platform,” Measurement, 2008, vol. 41, pp. 463-470. [5] J. Healey and B. Logan, “Wearable Wellness Monitoring Using ECG and Accelerometer Data,” in In Proceedings of the Ninth IEEE International Symposium on Wearable Computers (ISWC '05), Washington, DC, USA, 2005. [6] U. Anliker, J. A. Ward, P. Lukowicz and Troster, G.; Dolveck, F.; Baer, M.; Keita, F, “AMON: a wearable multiparameter medical monitoring and alert system,” Information Technology in Biomedicine, IEEE Transactions on, 2004 , vol. 8, no. 4, pp. 415-427.
João Martinho et al. / Procedia Technology 17 (2014) 542 – 549 [7] D. Spulak, R. Cmejla and V. Fabian, “Parameters for mean blood pressure estimation based on electrocardiography and photoplethysmography,” in 2011 International Conference on Applied Electronics (AE), 2011. [8] J. S. H. G. A. Fé, “Development of a pulse oximeter and blood pressure measurement device.Proceedings of Biodevices - 5th International Conference on Bio-Inspired and Signal Processing,” in Biodevices 2012, Vilamoura, Portugal, 2012. [9] M. Asif-Ul-Hoque, M. Ahsan and B. Mohajan, “Measurement of Blood Pressure Using Photoplethysmography,” in 13th International Conference on Computer Modelling and Simulation (UKSim), 2011. [10] P. M. R. S. Y.Gaikwad, “Blood Pressure and ECG Monitoring System Based on the Internet,” Journal of Engineering Research and Studies, 2011, vol. 2, no. 4, pp. 120-125. [11] E. G.-P. V. A.-C. a. E. C.-P. J. M. Cano-García, “ A PDA-based portable wireless ECG monitor for medical personal area networks,” in IEEE MELECON, Málaga, Spain, 2006. [12] K. S. a. S. C. a. H. R. D. a. M. B. a. V. Groza, “Augmented blood pressure measurement through the noninvasive estimation of physiological arterial pressure variability,” Physiological Measurement, 2012, vol. 33, no. 6, p. 881.
549