45
Design and implementation of an intermodal trip planner Bradley Casey, Ashish Bhaskar, Hao Guo and Edward Chung
Abstract The introduction and high usage of mobile devices in the last decade has encouraged the development of applications to assist travellers in the planning and completion of their journeys, and providing them with directions to get them to their destination as quickly as possible. However, the majority of these journey planners focus on generating trips that utilise either public transport or private vehicle for the entirety of the journey, but not both together. This paper presents details on the design and implementation of an intermodal trip planner for South-East Queensland that produces integrated journey plans that combine private automobile legs and public transport legs via the use of park’n’ride facilities. The method proposed for searching through these two different networks allows for the tailoring of search algorithms to the specific networks, as well as minimising the overall search space and the visits to a node as much as possible.
INTRODUCTION
Peer reviewed paper This paper has been critically reviewed by at least two recognised experts in the relevant field. Originally submitted: August 2014.
Traffic congestion is an important emerging issue, both in Australia and overseas. It has adverse effects on both the economy and the environment. Encouraging the use of multimodal transport, such as public transport, active transport and park’n’ride, has been identified by traffic operators as a good strategy to combat the issue of congestion and its detrimental effects. A real-time intermodal trip planner can provide commuters with the flexibility of various multimodal options based on their priorities, and has the potential to reduce congestion, both on a temporal and a spatial scale. This paper aims to present details on the design and implementation of the Intermodal Trip Planner (IMTP) named A2B, that combines public transport and private vehicle legs into a single journey via park’n’ride facilities. The standard shortest path problem has many papers published on its solution, dating back to the
Vol 24 No 4 December 2015 Road & Transport Research
Design and implementation of an intermodal trip planner
46 late 1950s (Bellman 1958; Dijkstra 1959). However, the research in intermodal trip planning, integrating both public transport and private vehicles into a single trip, has only begun in earnest in the last few years. Bousquet, Constans and El Faouzi (2009) presented a dynamic label-setting algorithm to compute a one-way multimodal shortest path and proposed a strategy for solving the two-way problem. Khani et al. (2012) propose a simple but efficient algorithm to find the optimal path in an intermodal urban transportation network. As part of this algorithm, they use a Trip-Based Transit Shortest Path algorithm that takes advantage of the transit schedule and the hierarchical property of transfer stops to find the shortest path faster than general labelling algorithms. Nassir et al. (2012) presents an efficient ‘Iterative Labelling’ algorithm to find the intermodal optimal tour (origin-to-origin) in a time-dependent transportation network for a traveller with a sequence of destinations to visit. This can implicitly solve the park’n’ride facility choice problem. These papers have taken different approaches towards optimising intermodal trip planning, and each has advantages and disadvantages. The approach used by Bousquet et al. (2009) is to perform the search on a single multi-layered network that is efficient, as it minimises the number of times a node is encountered in the search. However, the algorithm that is used to search this network is more complex than other approaches, as it must consider the different types of nodes and arcs that will be encountered during the search; this may cause implementation issues with upgrading it with faster search algorithms as they become available. The approach that is proposed in this paper keeps the two networks separate while treating the connections between them programmatically in a multi-step algorithm, and this allows for different search algorithms to be used for each network, tailoring them specifically to search those networks efficiently. This also provides benefits with greater ease of upgrading the search algorithms as faster methods are designed and implemented. Khani et al. (2012) use a similar approach to the algorithm proposed in this paper; however, they perform the steps of the search in reverse, with the transit network search earlier in the overall algorithm, before the search on the road network. This approach may consider more park’n’ride facilities in the search than is necessary. The approach proposed in this paper performs the search on the road network for the automobile leg first, and constrains the search area based on the road-only journey from the origin to the destination,
Vol 24 No 4 December 2015 Road & Transport Research
and then performs the public transport search using stops within walking distance of the smaller set of park’n’ride locations. The paper is structured as follows. First, the data requirements for the IMTP are presented, followed by the details of the data structures and algorithms for the proposed IMTP. Thereafter, the testing methodology is discussed and finally results are presented and analysed and the paper is concluded.
DATA REQUIREMENTS The most important component of the IMTP is the data that is used to compute trips for users. There are a number of different data sources that can be used, and these are categorised into two groups: mandatory data that is required for the basic functionality of the trip planner, and optional data that is useful for providing extra functionality to the user.
Mandatory data In order to perform the basic functions of a trip planner, there are several sources of data that need to be obtained, both from the end-user and from back-end databases. This section will outline these data sources, as well as specifying details of the South-East Queensland (SEQ) data. The end-user must input several pieces of information in order to produce a basic trip plan that caters to their needs: •• The origin and destination locations These can be provided in three different ways: (1) latitude and longitude coordinates (which can be obtained from a GPS device or by using an interactive map within the GUI); (2) street address; or (3) landmark name. Ways (2) and (3) can then be geocoded to provide their coordinates. •• The choice/s of transport mode for the trip The user can choose one or more of the available transport modes, such as Car, Bus, Train, Ferry, Bicycle or Walking. The trip planner can then use these choices to plan optimised alternatives, using either a solo mode of transport, or by combining several modes. •• The time of departure or time of arrival The user must choose to enter one of these times, depending on whether they need to arrive at a destination at a certain time, or leave from their current location at a certain time.
Design and implementation of an intermodal trip planner
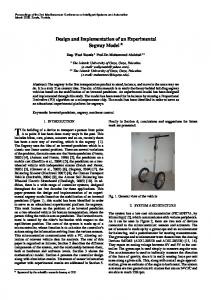
47 •• Average walking and cycling speeds, and maximum walking and cycling distances, if applicable In order to calculate the time taken to travel by foot or bicycle during a journey, an estimate of the average speed must be provided by the user. This can be either input as a specific speed value, or chosen from a selection of pre-set choice values (e.g. slow, medium or fast). The maximum distance the user is willing to walk or cycle in a single journey leg must also be provided, particularly when used in conjunction with public transport, in order to constrain the number of possible stops to search to and from. Once the information above has been obtained from the user, the trip planner requires access to a number of data sources from back-end databases in order to calculate an optimal trip for the user. These include: •• A geocoding service This provides an algorithm and/or a database for finding a location’s coordinates given a street address. This is necessary for calculating the ‘last mile’ of the journey, both from the origin and destination, where the user will only travel a certain distance along the first and final link of their trip. There are commercial services and open sources available that can perform the geocoding function, such as the Google Geocoding API (https://developers.google. com/maps/documentation/geocoding/) •• Road network as a graph data structure This consists of two groups of data that relate to each other: intersection data and road data. Intersection data include latitude and longitude coordinates and turning restriction information, such as no-right-turn, no-left-turn or permitted U-turn. Road data includes the name or description of the road, the identifiers of the start and end intersections for the road (which can be used to indicate direction), and data that can be used to calculate the travel time along the road. This can be either the length of the road plus the speed limit or the measured free-flow speed along the road, which can be used to calculate the travel time, or alternatively, real-time and historical travel time data, which can be used to provide a predicted, time-dependent travel time along the link. The SEQ road network that is used in the IMTP has approximately 150 000 intersections and 194 000 roads, covering an area of approximately 33 000 km2. Figure 1 shows the coverage and density of this network.
•• Public transport network as a graph data structure This data is more complex than for the road network, and consists of several related groups of information. First, the physical locations and descriptions of transit stops and stations are required, so they can be integrated with other modes of transport. Second, information about the routes is required, including a description and the list of stops that the vehicles visit along each route. Finally, schedule information is required to provide estimated times that the vehicles will visit each stop along their routes. The SEQ public transport network is based on the GTFS files that the transit authority Translink provides publically (Translink (Online)), and consists of 12 339 stops and 639 routes, with a total of 42 712 individual services along those routes, and over a million individual stop-times for these services. •• Park’n’ride data In order to calculate intermodal trips that combine both public transport and private vehicle legs, the locations of these dedicated parking facilities are required. The IMTP has data on 97 park’n’ride locations in the SEQ region. •• Bicycle and walking data This includes information about dedicated tracks and additional information for the road network indicating where walking and cycling are allowed.
Optional data This section will outline the useful information that can be used to provide extra features to the IMTP. The end-user must provide preferences for the extra features through choices made via the user interface. These may include: •• Maximum number of transfers between modes •• Objective choice Possible objectives can include quickest journey, cheapest journey, safest journey, most environmentally friendly journey, or the least number of transfers. •• Return trip computation Additional information is required, such as the time of arrival or departure for the return journey. This feature is important for intermodal trips, as the return journey must take into consideration where the user’s car was parked in the initial
Vol 24 No 4 December 2015 Road & Transport Research
Design and implementation of an intermodal trip planner
48
Figure 1 Road network of South East Queensland used in the IMTP
journey, so the public transport leg of the return journey will return them to that location. In order to provide results based on the user specified preferences, other sources of data are required for these extra features. They include the following: •• Cost information For public transport, this includes zone and fare information. The costs for automobiles include fuel prices and consumption per kilometre, car parking location and cost, and toll information. Other costs associated with automobiles, such as registration, insurance and maintenance costs are important to vehicle owners; however, they would not be included in costs specific to a trip, as the owner must incur those costs regardless of whether they use the vehicle on their trip. Bicycle hiring costs are useful for cities with public bicycle hiring schemes, such as Brisbane’s City Cycle.
Vol 24 No 4 December 2015 Road & Transport Research
•• Environmental impact This is primarily represented by the emissions produced along a journey. For the purpose of the IMTP, an approximate quantity of emissions per kilometre for the type of vehicle is satisfactory, as opposed to more detailed information based on the exact model and make of vehicle, driver behaviour and so on. The main purpose of this objective is to provide a comparison between different transport modes, as opposed to providing exact emissions produced on a certain journey. Once the emission produced per kilometre has been found, it should be divided by the average number of occupants for that mode, so that an emissions value is found for the individual. This is because a bus may produce more emission than a single car, but it is usually transporting more people than a car, and therefore riding on the bus will produce fewer emissions than driving for that individual.
Design and implementation of an intermodal trip planner
49 •• Safety classification of roads This is primarily for walking and cycling purposes. For example, the links of the road network can include an attribute indicating a safety classification, such as dedicated walk– cycle track = safest, low traffic suburban street = safe, arterial road = less safe, highway = restricted/ no access, etc. When calculating the ‘safest’ path, the length of the links would be weighted by the safety classification, for example, safest = 1, safe = 2, less safe = 3, so that a longer trip along a dedicated track has priority over a shorter one via an arterial road, but only to a certain extent. An alternative method would involve crowdsourced information, where users can grade the various roads that they encounter, or they could be tracked (with permission) to find the most popular paths that are used. •• Elevation information This is used for walking and cycling trips, as an objective option to calculate the journey with the least energy output. It can also be used as a visualisation of elevation change along the journey. •• Temporary obstruction information This can include information on road works or track work, traffic accidents, as well as natural disaster information, such as flooding or bushfires.
Issues with data availability One of the major issues with developing the IMTP is the availability of the data. Information about road infrastructure and sensor data for calculating predicted travel times, as well as route and schedule information for public transport, could be scattered across various local, state and federal transport authorities, and one of the difficulties that has been encountered is combining all of this disparate information into a re-useable data source. Therefore, one of the major projects at the Smart Transport Research Centre (STRC), Queensland University of Technology, has been the development of a modelfree network for a Transport Data Hub (Miska et al. 2013), commercially named as the ‘Jellyfish’, which provides the backbone on which the IMTP can operate, as well as other transport applications.
DATA STRUCTURES AND ALGORITHMS The two main data sources that are used in the IMTP are the road network and the public transport network. The two graph networks are similar in the respect that they consist of a set of nodes and arcs
Figure 2 Road network graph data structure representation
that connect neighbouring nodes together; however, they are different both from a conceptual point of view and for practical implementation purposes. The nodes and arcs within the road network represent physical entities that are geographically separated, while the nodes and arcs within the public transport network represent temporal events and the possible connections allowed between these events.
Road network The graph data structure that is used in the IMTP for the road network is depicted in Figure 2. Each node represents either an entry into, or exit from, a specific intersection. The directed arcs that connect two nodes together can be of two types: •• road segment – an arc that starts from an exit node of one intersection, and ends at an entry node of a different intersection •• turning action – an arc that starts from an entry node of an intersection, and ends at an exit node of the same intersection, and represents a valid turning action that can be performed at the intersection, such as turn left, turn right, U-turn or straight-through.
Public transport network The IMTP uses the Time-Expanded Approach (TEA) (Schulz 2005) to represent the public transport network. In the TEA, each node represents a specific event in time at a specific stop. There are three types of events that can occur: •• Arrival event – This event represents a transit vehicle arriving at the stop.
Vol 24 No 4 December 2015 Road & Transport Research
Design and implementation of an intermodal trip planner
50 •• Departure event – This event represents a transit vehicle departing from the stop. •• Transfer event – This event allows for transfer connections between services. There are four types of arcs that connect pairs of event nodes together: •• Service link – This arc connects arrival and departure events, and represents either the transit vehicle moving from one stop to the next stop, or the vehicle sitting stationary at the stop between its arrival and departure events. •• Transfer link – This arc connects arrival events to transfer events, and represents the ability for a passenger to disembark from the transit vehicle to either transfer to another service, or to complete their public transport journey. Additionally, the transfer link can connect an arrival event in one stop to a transfer event in another stop, which represents the passenger disembarking from the transit vehicle and walking to a nearby stop to board another service. •• Boarding link – This arc connects transfer events to departure events, and represent the ability for a passenger to board a transit vehicle. •• Waiting link – This arc connects consecutive transfer events within a stop, and represents the waiting time that a passenger spends until their chosen service arrives for boarding.
Figure 3(a) Public transport network graph data structure representation (Schulz 2005)
Figure 3a depicts the TEA approach in which A, B and C are the stops, links x and z are service links from stop C to stop B, links u, v and w are service links from stop A to stop B, and link y is a service link from stop B to stop A. The vertical links within each stop are the waiting links between events at that stop. Figure 3b shows a more detailed representation of the data structure within a specific stop in which the arrival, departure and transfer nodes can be seen separately, along with the connections between them. Transfer and boarding arcs can be omitted between certain nodes to represent situations where only boarding and disembarking is allowed at a stop for a particular service. However, service and waiting arcs are mandatory between consecutive events for a service and within a stop, respectively.
Shortest-path algorithms Two shortest-path algorithms have been implemented for the IMTP, Dijkstra’s algorithm and the A* heuristic algorithm.
Figure 3(b) Detailed representation of the public transport graph data structure within a stop (Schulz 2005)
Dijkstra’s algorithm is the classical label-setting shortest-path algorithm proposed by Edsger Wybe Dijkstra (Dijkstra 1959). It is a one-to-all shortest-path algorithm that finds the minimum
cost from the origin node to all other nodes in the graph. The original Dijkstra’s algorithm did an unordered search when finding the next candidate
Vol 24 No 4 December 2015 Road & Transport Research
Design and implementation of an intermodal trip planner
51 node, and has been shown to have a complexity of O(n2), where n is the number of nodes. Various improvements have been made to the performance of the algorithm by storing candidate nodes in a heap or priority queue structure, and retrieving the node at the front of the queue as the next current node, which speeds up the node selection and has a complexity of O(m log (n)) (Johnson 1972), where m is the number of arcs. This is the approach that has been used in the IMTP. Other improvements include the S-bucket algorithm (Dial 1969) and an algorithm that uses a Fibonacci heap. This last algorithm has a complexity of O(m + n log (n)) (Ahuja et al. 1990). The A* heuristic algorithm (Hart, Nilsson & Raphael 1968) improves upon Dijkstra’s algorithm for one-to-one shortest-path problems, as it takes into consideration the location of the destination node. Rather than sort candidate nodes in the order of their cost from the origin node, A* uses an estimate of the cost to travel from the candidate node to the destination node, plus the calculated cost from the origin node to the candidate node, and orders the nodes based on this sum. It has been proven that if the estimate always underestimates the actual cost of travelling from the candidate node to the destination, the heuristic is admissible and will always calculate the optimal shortest path. Another group of shortest-path algorithms are the Bidirectional methods, such as Bidirectional Dijkstra (Dantzig 1960; Nicholson 1966) and Bidirectional A* (Pohl 1969). These methods adapt the unidirectional algorithms to search from both the origin and destination nodes at the same time, which reduces the overall search space compared to the original algorithms. Finally, there are more sophisticated algorithms, such as the hierarchical methods, which require varying amounts of pre-processing. These methods include ALT (A* Landmarks with Triangle inequality). Goldberg and Harrelson (2005), and Fu, Sun and Rilett (2006) provide a comprehensive overview of many of the hierarchical methods available. The main reasons that the Dijkstra and A* algorithms have been chosen for this research are that they are well-tested and shown to produce optimal results, and the ease of implementation, so that the research could focus more on the method of integrating the road and transit networks together.
Integrating road and public transport networks In the process of designing the IMTP, two methods have been proposed for integrating the road and
public transport networks together when performing an intermodal search. These approaches are the multi-level network approach and the multi-step algorithm approach. The multi-level network approach constructs a single graph data structure in which each different mode of transport is on a separate level, and connections are made between nodes in different levels where transitions between the modes occur, such as at park’n’ride locations between automobiles and public transport. The multi-step algorithm approach, however, keeps the two graph data structures separate, and generates an overall journey by performing the following algorithm: 1. Find the park’n’ride locations with a specified distance from the origin (based on the cost of driving from the origin to destination by automobile only). Calculate the shortest path to drive by automobile from the origin to each of these park’n’ride locations. 2. For each of the park’n’ride locations, find the stops within a specified walking distance of the location. Calculate the shortest path to walk from the park’n’ride location to each of its neighbouring stops. 3. Find the stops within the specified walking distance of the destination. Calculate the shortest path to walk from each of the neighbouring stops to the destination. 4. Using the stops surrounding the park’n’ride locations as origin stops, and the stops surrounding the destination as destination stops, calculate the shortest paths via public transport from the set of origin stops to the set of destination stops. Figure 4 illustrates the multi-step algorithm and its use of the input data from the user. The fourth step, in which the public transport legs are calculated, makes use of a modified version of the Dijkstra’s algorithm that takes as input a set of origin stops along with their cost from the actual origin, and a set of destination stops along with the cost to the actual destination. Conceptually, it is similar to a 1-to-1 search, and this illustrated by Figure 5. Each of the origin nodes are set as visited nodes with their label values set to the costs input into the algorithm. If a destination stop is reached during the search, the node is saved in a list, and the algorithm terminates when either a specific number of nodes
Vol 24 No 4 December 2015 Road & Transport Research
Design and implementation of an intermodal trip planner
52
Figure 4 Overview of the calculation of intermodal results
have been saved to the list, or there are no more nodes in the unvisited set. This approach improves on a brute-force approach in which shortest-path searches are performed separately for each pair of origin and destination stops, as it ensures that each node in the network is visited only once overall in the multi-step algorithm approach. There are also additional constraints that are checked when visiting neighbours of the current node in the public transport search. These include a maximum period of time that is allowed to pass between the start of the journey and the time of the current event node, and a maximum number of transfers that cannot be exceeded. This reduces the overall search space covered by the algorithm, therefore improving computation time.
TESTING METHODOLOGY A testing methodology plan has been developed in order to produce results that can be analysed Vol 24 No 4 December 2015 Road & Transport Research
and from which conclusions can be made on the computational performance of the IMTP algorithms. The methodology plan is detailed in this section. First, a list of suburbs in the SEQ region is chosen. The distribution of the suburbs can be seen in Figure 6, and have been coloured by their category. They are in the following four categories: •• Major destinations: central business district (CBD), airport (Pinkenba), Fortitude Valley •• Suburbs with major shopping centres: Chermside, Indooroopilly, Carindale, Upper Mount Gravatt, Strathpine •• Suburbs at the extremities of the SEQ region: Ipswich, Southport, Coolangatta, Maroochydore, Caboolture •• Metropolitan suburbs: New Farm, St Lucia, Redcliffe, Wynnum, Samford Village, Albany Creek, Forest Lake, Graceville
Design and implementation of an intermodal trip planner
53
Figure 5 Illustration of public transport search using multiple origin and destination nodes
The major destinations and shopping centre suburbs have been chosen because the performance of searches to and from these locations are important, as it is likely that many requests will involve one of these suburbs. The suburbs at the extremities of the SEQ region have been chosen to test the performance of long-distance journeys, which are the worst-case scenarios for the IMTP. The other suburbs have been chosen for a number of reasons. New Farm, St Lucia and Graceville are relatively close to the CBD; however, a direct straight-line trip is not possible due to the curves of the Brisbane River, so they should produce more interesting journey plans. The other metropolitan suburbs have been chosen to produce results in a number of different cardinal directions. Tests are run using each of these suburbs as an origin, excluding the CBD, and the CBD as the destination. The tests with each suburb pair is run using automobile only, public transport only, and intermodal mode choices. For the public transport only and intermodal choices, tests are performed for 4 time periods: morning peak (6 a.m.–9 a.m.), afternoon peak (4 p.m.–7 p.m.), interpeak period (9 a.m.–4 p.m.) and evening–early morning (7 p.m.– 6 a.m.). Fifty tests are run for each combination of (suburb, CBD) origin–destination, transport mode and time period, with a random origin and
destination coordinate chosen from within the respective suburbs. The following parameter values are set for the tests: •• •• •• •• •• ••
Objective type: travel time Query type: depart after Maximum number of transfers: 3 Maximum walking distance: 1500 m Maximum transfer distance: 400 m Maximum number of itineraries to be returned: 1
The road network that is used in the tests, based on the SEQ region, has 778 392 nodes and 1 519 862 arcs. The public transport network that is used in the tests, using the TEA data structures, has 3 648 055 event nodes and 6 007 864 connection arcs. For the park’n’ride tests, the 97 locations are used.
RESULTS AND ANALYSIS This section presents a collection of the test results that have been obtained by following the aforementioned testing methodology. These tests have been performed on a desktop computer with an Intel Core I5 650 processor operating at 3.2 GHz, 16 GB of RAM and Windows 7 64-bit as the operating system. For readability and space purposes, a selection of the suburbs is presented in the graphs in Figure 7a, b and c.
Vol 24 No 4 December 2015 Road & Transport Research
Design and implementation of an intermodal trip planner
54
Figure 6 Geographical distribution of test suburbs
Figure 7a presents the computational times for the road-only searches. A relationship can be seen between the travel time and the computational time required to complete the search. This is because the computational time is directly related to the number of nodes that are searched, and the longer the journey, the more nodes will be visited. A* performs better than Dijkstra’s algorithm in all cases, and the difference in this performance increases as the travel time increases. It is interesting to see the similarities in computation time of the Southport and Maroochydore searches, although the travel times are greater for Maroochydore than for Southport. This is most likely due to the density of nodes encountered in the searches, as the road network is denser travelling north from Southport to the CBD, compared with travelling south from Maroochydore to the CBD. Figure 7b presents the computational times for the public transport only searches. A relationship
Vol 24 No 4 December 2015 Road & Transport Research
between travel time and computation time cannot be seen clearly in this data, and this is because the nodes in the public transport graph represent events that occur at transit stops and are not directly related to distance or travel time. As opposed to the roadonly searches, using Dijkstra for the shortest-path searches between the origin/destination and their surrounding stops performs markedly better than using A*. This is because a single Dijkstra 1-tomany search was utilised, as opposed to having to use separate 1-to-1 A* searches for each stop, and thus the nodes in the network are only visited once in the overall search. Figure 7c presents the computational times for the intermodal searches. These results provide for conclusions similar to those made for the public transport only searches. The use of single Dijkstra 1-to-many searches for the road and walking legs performs considerably better than the use of many
Design and implementation of an intermodal trip planner
55
Figure 7(a) Road only search computation time
Figure 7(b) Public transport only search computation time
Figure 7(c) Multimodal search computation time
1-to-1 A* for each individual stop–park’n’ride combination. The main difference between Figure 7c and Figure 7b is that there is some relationship between computation time and travel time. This is due to the driving legs of the intermodal journey, and is most visible in the A* searches. Although it is not clearly visible in Figure 7b, the computation time of the Dijkstra searches does increase slightly with respect to the travel time.
The practical use of these algorithms within a trip planner application must also be considered. Most users will be expecting a result within a few seconds of their request, therefore the average and worst case of computation time must be analysed. For road-only searches, the IMTP performs adequately, producing results within a second for almost all searches, including the worst case scenarios of travelling from Maroochydore to the CBD. Vol 24 No 4 December 2015 Road & Transport Research
Design and implementation of an intermodal trip planner
56 For public transport only searches, using Dijkstra as the shortest-path algorithm produces adequate results, with the average search completing within 5 seconds, with a few outliers that take around 10 seconds. These outliers are actually due to memoryallocation issues caused by using C#, which takes care of recovering memory itself via a garbage collector. Therefore, implementing the IMTP in C++, where the memory allocation is coded explicitly, may remove this issue and these outliers. A* is clearly not viable in practice, with the minimum computation time required at 15 seconds, and varies considerably depending on the specifics of the request. For intermodal searches, the average time required for a search when using Dijkstra is less than 10 seconds, with the worst cases taking under 20 seconds to complete. This is on the borderline of what would be acceptable by a user of the application; however, this computation time can be improved by modifying various input parameters to the search, such as maximum number of transfers, maximum transfer distance between nearby stops, and the maximum time allowed for the journey to take. Again, the performance of A* would not be viable in practice. It should be noted that these tests were performed for academic research purposes on a desktop computer (specifications listed at the start of the results section), and the computation times may not necessarily reflect the performance when the IMTP is operating on a more capable server processor. Further tests are required to be performed in a server environment to measure the capability of the IMTP in an operational environment.
APPLICATION OF THE MODEL The data structures and algorithms described in this paper have been implemented and used as the back-end engine of the mobile application ‘A2B’. This application allows the user to input their origin and destination, either via a text field or by placing pins on a map, choose their time of arrival or time of departure, and pick the modes of transport that they will allow to be included in the calculation of the journey. Once all of this information has been input, they press the ‘go’ button, which sends a request to the server to calculate a set of journey plans for the user. These journey plans are then presented to the user in a summarised form, showing icons of each of the legs in each journey, along with start and end times and a duration of the journey. This summarised form allows the user to quickly compare their options and pick the one that is most preferable to them. They then select this journey
Vol 24 No 4 December 2015 Road & Transport Research
which will bring up a screen with more detailed information about the journey, including directions for walking and car trips, and the routes and stops relevant to the public transport legs of the journey. A map of the journey is also displayed by swiping left on the detailed journey screen, which will show each leg of the journey on the map. As an example, Figure 8 presents screen-shots from A2B, in which a user selects an intermodal trip (with park’n’ride) option for a trip from Hamilton road, Moorooka, to 126 Margaret Street, Brisbane. The corresponding screenshots for travel options, trip details, and map of the journey are also included in the figure.
CONCLUSIONS AND FUTURE WORK This paper has presented the work that has taken place in the design and implementation of the IMTP, including the collection of data sources required for practical operation of the trip planner, the design of an efficient algorithm and data structures for performing the shortest-path search through both networks, and the development of a testing methodology that allows for the computational performance of the algorithms to be analysed. The multi-step algorithm that has been proposed in this paper keeps the searches through the two different networks separate, thus allowing for the use of efficient search algorithms that are tailored for each type of network, as well as providing for future upgrading of these search algorithms. It also aims to minimise the search space that is covered by the overall search algorithm, as well as minimising duplication of searches in which nodes are visited several times over the course of the calculations. This is why a single cost-restricted Dijkstra search used in the automobile leg search and the modified Dijkstra search for the public transport leg provide better performance than using A* for multiple 1-to1 searches within each of these legs. However, more sophisticated 1-to-1 search algorithms that use pre-processing may provide better performance than using Dijkstra, and will be the focus of future research. Future work that is to be performed on the IMTP is the modification of the data structures and algorithms to use real-time and historical data so more accurate trip plans can be calculated. Interested readers can refer to Casey et al. (2014) for a critical overview of the time-dependent shortestpath algorithms for the development of IMTP with real-time and dynamic travel time. The addition of more objective costs is also planned, including financial cost and environmental impact. Finally, the IMTP can be used as part of a more complex application that produces results for travelling salesman and vehicle-routing type problems.
Design and implementation of an intermodal trip planner
57
Figure 8 Screenshots from A2B mobile app for an intermodal trip planning from Hamilton road, Moorooka to 126 Margaret Street, Brisbane
REFERENCES Ahuja, RK, Mehlhorn, K, Orlin, J & Tarjan, RE 1990, ‘Faster algorithms for the shortest path problem’, Journal of the Association for Computing Machinery, 37, 213–23. Bellman, RE 1958, ‘On a routing problem’, Quarterly of Applied Mathematics, 16, 87–90. Bousquet, A, Constans, S & El Faouzi, N-E 2009, ‘On the adaptation of a label-setting shortest path algorithm for one-way and two-way routing in multimodal urban transport networks’, Proc. International Network Optimization
Conference 2009, available at http://www.di.unipi.it/ optimize/Events/proceedings/. Casey, B, Bhaskar, A, Guo, H & Chung, E 2014, ‘Critical review of time dependent shortest path algorithms, an intermodal trip planner perspective’, Transport Reviews: A Transnational Transdisciplinary Journal, DOI: 10.1080/01441647.2014.921797. Dantzig, GB 1960, ‘On the shortest route through a network’, Management Science, 6, 187–90.
Vol 24 No 4 December 2015 Road & Transport Research
Design and implementation of an intermodal trip planner
58 Dial, RB 1969, ‘Algorithm 360: shortest-path forest with topological ordering [H]’, Communications of the ACM, 12, 632–33. Dijkstra, EW 1959, ‘A note on two problems in connexion with graphs’, Numerische Mathematik, 1, 269–71. Fu, L, Sun, D & Rilett, LR 2006, ‘Heuristic shortest path algorithms for transportation applications: State of the art’, Computers and Operations Research, 33, 3324–43. Goldberg, AV. & Harrelson, C 2005, ‘Computing the shortest path: A search meets graph theory’, Proc. 16th Annual ACM-SIAM Symposium on Discrete Algorithms, Society for Industrial and Applied Mathematics, 156–65.
Research Record: Journal of the Transportation Research Board, No. 2284, 40–46. Miska, MP, Nantes, A, Torday, A, Jin, H & Chung, E 2013, ‘Model-free networks as basis for transport data hub’, Transportation Research Board 92nd Annual Meeting, Compendium of Papers, Paper 13-3481. Nassir, N, Khani, A, Hickman, M & Noh, H 2012, ‘Algorithm for intermodal optimal multidestination tour with dynamic travel times’, Transportation Research Record: Journal of the Transportation Research Board, No. 2283, 57–66. Nicholson, TAJ 1966, ‘Finding the shortest route between two points in a network’, The Computer Journal, 9, 275–80.
Hart, PE, Nilsson, NJ & Raphael, B 1968, ‘A formal basis for the heuristic determination of minimum cost paths’, IEEE Transactions on Systems Science and Cybernetics, 4, 100–07.
Pohl, I 1969, Bi-directional and Heuristic Search in Path Problems. Department of Computer Science, Stanford University.
Johnson, EL 1972, ‘On shortest paths and sorting’, Proc. ACM Annual Conference 1972 – Volume 1, Boston, Massachusetts, United States, pp. 510–17.
Schulz, F 2005, Timetable Information and Shortest Paths. PhD Dissertation, Karlsruhe Univ.
Khani, A, Lee, S, Hickman, M, Noh, H & Nassir, N 2012, ‘Intermodal path algorithm for time-dependent auto network and scheduled transit service’, Transportation
Translink (Online), Translink Public Transport Performance Data - General Transit Feed Specification Translink, Brisbane. Available at: http://translink.com.au/about-translink/ reporting-and-publications/public-transport-performancedata.
Bradley Casey
Dr Bradley Casey is a Systems Engineer (Heuristics and Prediction) at netBI, which specialises in providing Business Intelligence and Data Warehousing solutions to transport agencies and operators. He obtained his PhD from Queensland University of Technology, where he specialised in Operations Research, and then served as a Postdoctoral Research Associate with the Smart Transport Research Centre, QUT. Ashish Bhaskar
Dr Ashish Bhaskar is a senior lecturer at the Queensland University of Technology (QUT), Brisbane, Australia and a research domain leader at Smart Transport Research Centre (QUT). He holds a PhD degree from the Swiss Federal Institute of Technology, Lausanne, Switzerland (EPFL); Masters’ degree from The University of Tokyo, Tokyo, Japan; and Bachelors’ in Civil Engineering from the Indian Institute of Technology, Kanpur, India. Hao Guo
Hao Guo is a lead developer at Smart Transport Research Centre (STRC), Queensland University of Technology (QUT), Brisbane, Australia. He holds a Masters’ degree in Information Technology from QUT. His research interests include human computer interaction, intelligent transportation system and mobile technology.
Edward Chung
Prof Edward Chung is a Professor at the Queensland University of Technology, Brisbane, Australia and the Director of Smart Transport Research Centre, QUT. He holds BSc with Honours and PhD from Monash University, Melbourne, Australia. CONTACT
Dr Ashish Bhaskar Smart Transport Research Centre Queensland University of Technology (QUT), Brisbane Email:
[email protected] Vol 24 No 4 December 2015 Road & Transport Research