Design and Implementation of LPWA-based Air Quality Monitoring System Kan Zheng∗ , Senior Member, IEEE, Shaohang Zhao∗ , Zhe Yang∗ , Xiong Xiong∗ , Wei Xiang† , Senior Member, IEEE ∗
Intelligent Computing and Communication (IC2 ) Lab Key Lab of Universal Wireless Communications, Ministry of Education Beijing University of Posts & Telecommunications Beijing, China, 100088 † College of Science Technology & Engineering Division of Tropical Environments and Societies James Cook University Cairns QLD 4870 Australia Contact email:
[email protected]
Abstract Increasing attention has been paid to air quality monitoring with a rapid development in industry and transportation applications in the modern society. However, existing air quality monitoring systems cannot provide satisfactory spatial and temporal resolutions of the air quality information with low costs in realtime. In this paper, we propose a new method to implement the air quality monitoring system based on state-of-the-art Internet-of-Things (IoT) techniques. In this system, portable sensors collect the air quality information timely, which is transmitted through a low power wide area (LPWA) network. All air quality data are processed and analyzed in the IoT cloud. The completed air quality monitoring system including both hardware and software is developed and deployed successfully in urban environments. Experimental results show that the proposed system is reliable in sensing the air quality, which helps reveal the change patterns of air quality to some extent. Index Terms– Internet-of-Things (IoT), air quality monitoring, PM2.5 , LPWA, IEEE 802.15.4k
2
I. I NTRODUCTION With the rapid development in industry and transportation, air pollution has recently become a serious problem for developing countries, which has been paid increased attention to by both governments and the public. It is well-accepted that the people exposed to air pollutants for long periods of time are more likely to suffer from severe respiratory diseases [1]. If air quality continues to deteriorate, the cost of pollution harness may become a heavy burden for governments. Thus, air quality monitoring systems are very useful in effectively monitoring air pollution before the situation becomes worse. Traditionally, air quality monitoring stations are usually of large sizes and high costs for installation and maintenance, which limits its potential in dense deployment in cities [2]. Furthermore, although the precise measurement results can be produced, time-consuming procedures are needed offline. Thus, air quality data cannot be provided in real time by this way. However, air quality information data of both high spatial and temporal resolution in both the spatial and temporal dimensions is highly desired, which is the focal point of this paper [3]. Thanks to the rapid development of Internet-of-Things (IoT) technology, the air quality can be sensed and the corresponding data transmitted to the servers through wireless networks such as the wireless sensor networks (WSNs) [4] [5] [6] [7]. Various portable air quality sensors with acceptable costs have been used. One of the main air pollution sources is the tiny particles with an aerodynamic diameter of less than 2.5 micrometer, i.e., Particulate Matter (PM) 2.5, which can attach various poisonous chemicals and be breathed into human lungs. Thus, the PM sensor is a good choice for providing reliable measurement data on the air dust level in cities [8] [9]. Without a complicated process, the sensor can measure the air quality in seconds. Although the accuracy of these sensors might not be as good as traditional air quality monitoring devices, it is fair enough to show the trend of the changing air quality. Next, the air sensing information needs to be transmitted and processed in time. It is well known that as a shortrange transmission technique, WSNs can only provide very limited coverage, which cannot meet the communication requirements of a massive number of air quality sensors over a large sensing area. To address the above problems, low power wide area (LPWA) technology, an emerging Machine-toMachine (M2M) communications technique may be used. It is specifically designed to provide ubiquitous
3
coverage, low energy consumption and costs for devices that infrequently send or receive messages with limited data rates [10] [11] [12] [13]. In general, an LPWA network can provide suburban and rural ranges of over 20 kilometer (km), and a typical urban range of around 5 km. Moreover, LPWA technology can also enable devices to operate with a long battery life for over ten years. These features of LPWA technology are particularly attractive for typical smart city applications such as urban air quality monitoring. Through integrating LPWA technology with the air quality monitoring system, air quality monitoring nodes can be widely scattered across every corner of the urban areas to greatly improve the spatial and temporal resolutions of monitoring. Furthermore, the star topology and long battery life of LPWA networks can also reduce maintenance and deployment costs of the air quality monitoring system. To the best of our knowledge, there are very few studies on LPWA-based IoT applications in the existed literatures [14]. This paper proposes an air quality monitoring system based upon LPWA networks. Firstly, we briefly present the architecture of the proposed system. Then, the hardware and software designs are discussed in detail. The LPWA access point (AP) is implemented on an open-source soft-defined radio (SDR) platform. The air quality monitoring node consists of sensors, microcontroller unit (MCU), battery and so on, which are developed by ourselves. In order to process and analyze the sensed data, the IoT cloud with different types of servers has been established. The users can access the air quality information either through a website or a mobile application (APP). The proposed air monitoring system has been deployed and operated, which demonstrates the effectiveness of the proposed system in urban environments. II. S YSTEM A RCHITECTURE As illustrated in Fig. 1, a three-tier hierarchical IoT architecture is adopted in the proposed air quality monitoring system, i.e., the sensing layer, network layer and application layer. A. Sensing layer This is the foundation of the entire air quality monitoring system, which is mainly responsible for air quality sensing and data reporting. As the main entities of the sensing layer, the air quality monitoring nodes are battery powered and widely installed across a large geographical area. Thus, large-scale air quality data can be collected by these nodes. The details of the monitoring node are provided in the next section.
4
Application layer API
API
Data Processing Server
Web
HTTP Server
Storage Server
APP
Cloud API
Network layer
USRP
GPP
LPWA AP
USRP
GPP
LPWA AP
USRP
GPP
LPWA AP
Sensor layer
Monitoring Node
Fig. 1. Architecture of the LPWA-based air quality monitoring system.
B. Network layer An LPWA network based on the IEEE 802.15.4k specification is employed to provide ubiquitous connectivity between the monitoring nodes and the Access Point (AP). To achieve excellent coverage performance, a particular direct sequence spread spectrum (DSSS) technique is adopted in the physical layer (PHY), which uses a large spreading factor (SF) to achieve excellent receiver sensitivity. In our system, the AP is developed based on open source software-defined radio (SDR) due to its flexible and
5
inexpensive rapid prototyping.
C. Application layer The application layer is imperative for processing sensed data and providing interactive services to users. It can be divided into two parts, i.e., IoT cloud, and client applications. Once the AP receives the air quality data reported from the sensor nodes, it firstly stores the data in the database of the IoT cloud. Then, the collected air quality data are aggregated, processed and analyzed in the IoT cloud. Moreover, the IoT cloud also supports information delivery and service creation, which can be triggered by client applications, either a computer-based web display system or smartphone-based mobile APP, via the application programming interfaces (APIs). With the aid of client applications, users can easily obtain the air quality information from the IoT cloud. III. S YSTEM I MPLEMENTATION A. Hardware Implementation The hardware of the system mainly includes: 1) Monitoring Node; 2) Access Point (AP) Node. Monitoring node is used to collect real-time air quality data and transmit these data to the AP through wireless channel. The AP is responsible for receiving wireless signals and detecting the air quality data accurately. Detailed introduction about these two components is presented as follow. 1) Monitoring Node: As shown in Fig. 2, each monitoring node consists of four functional components, i.e., the sensor module, controller module, LPWA transmitter module and power module. The sensor module is used to sense air quality information and transfer them to the controller module through the Universal Synchronous/Asynchronous Receiver/Transmitter (USART) interface. Then, the controller samples the air quality data and transmits them via the radio-front (RF) module, whose baseband signal processing procedures are implemented according to the IEEE 802.15.4k specification [15]. Also, it is responsible for performing all the control workflow in the node. The monitoring node is powered by a solar battery system that supports long-term use. a) Sensor Module: It is usually composed of several typical sensors including the particulate matter sensor, and the temperature and humidity sensors. Compared to the ultra-red types, the laser PM2.5 air
6
Battery Solar Panels
Solar Charge Controller
LPWA Tx Module RF CC1125
Power Module
Control Functions
Baseband Signal Process Functions
Controller Module PM Sensor
Humidity sensor
Temperature Sensor
Sensor Module Fig. 2. Main functional components of the monitoring node.
particle/dust sensor is of high precision and can be easily used without calibration. Thus, the PMS5005 sensor is chosen in our monitoring node. When particles go through the detecting area in the PMS5005 sensor, light scattering is induced and the scattered light is transformed into electronic signals. Then, the signals are amplified and processed to obtain the number and diameter of the particles, which have certain correlation with the signal waveform [16]. SHT20 is optionally used, which has a capacitive-type humidity sensor, a band-gap temperature sensor, and specialized analog and digital integrated circuits. It can provide calibrated, linearized sensor signals in digital I2C format. b) Controller Module: All control functions in the control module are implemented in the STM32F103RC Microcontroller Unit (MCU), which is an ARM 32-bit Cortex-M3 micro-controller operating at 72 MHz frequency, high-speed embedded memories (Flash memory up to 512 Kbytes and SRAM up to 64 Kbytes), and an extensive range of enhanced I/Os and peripherals connected to two APB buses [17]. This MCU offers three 12-bit ADCs, four general-purpose 16-bit timers plus two PWM timers, as well as standard and advanced communications interfaces, i.e., up to two I2Cs, three SPIs, two I2Ss, one SDIO, five USARTs, one USB and one CAN. These features make STM32F103RC suitable for our proposed systems. The monitoring node is in the RUN mode after power on or reset. In order to reduce power consumption, it usually stays in the low power mode until woken up either periodically or event-evoked, and then enters the RUN mode. There are usually three low power consumption modes, i.e., the SLEEP, STOP and
7
STANDBY modes. In the SLEEP and STOP modes, all I/O pins keep the same state as those in the RUN mode, and the contents in the SRAM and register are kept, which consumes power to a certain extent. Moreover, the STANDBY mode needs the least power but loses the contents stored in the SRAM and register, which is preferred to be used in our design. On the other hand, it may take much time and power consumption to calculate the spreading sequences with the SF up to 32768 for transmission in an LPWA system. After the node is powered on, the spreading sequence is only calculated once with the given user identification and then stored in the flash memory, whose contents can be kept in any mode. Then, after the node is woken from the STANDBY mode, the spreading sequences can be read for use without additional computation. To further save the energy, adaptive duty cycle adjustment is employed in the node. Since the air quality usually does not vary too much, the node is woken to sense the air quality and transmit data every ten minutes by default. If the difference between two successive blocks of sensing data is larger than the given threshold, the duty cycle is lowered so as to monitor the air quality in time. Otherwise, the sleeping duration may be increased to the default value. c) LPWA Transmitter Module: The baseband signal processing functions of the LPWA transmitter are first programmed in the MCU. Next, the GFSK modulated signal is transmitted through the RF chip, i.e., Texas Instruments (TI) CC1125 chip, which is a fully integrated single-chip radio transceiver designed for high performance operations with very low-power and low-voltage. It has very excellent receiver sensitivity, i.e., -129 dBm at 300 bps, -123 dBm at 1.2 kbps and -110 dBm at 50 kbps, respectively. The ISM band of 433 MHz is used for transmission with a maximal transmit power of 15 dBm [23]. d) Power Module: The node is lithium battery powered, which can be recharged via a solar panel. One of the problems with solar power is that the output voltage of the solar panel is often variable and too large for charging the battery. The solar charge controller is responsible for reducing the voltage and storing the electric energy in the battery safely. Furthermore, it can also monitor the battery level in real time so as to protect the battery from over-charging or over-discharging. With the help of the solar charge controller, the battery can provide a safe and stable power supply for each module of the monitoring node.
8
Parallel Processing
Convolutional Decode
DeInterleaver
De-Spreading Preamble Detection
CRC Check
Demodulator USRP B210
Timing Recovery PC
Fig. 3. Functional diagram of the AP.
2) Access Point (AP) Node: As shown in Fig. 3, the AP in the network layer is implemented by using a general purpose processer (GPP) based open source SDR platform, which consists of a common computer and a universal software radio peripheral (USRP). An Ettus USRP B210 is chosen as the general RF unit due to its wide frequency range from 70 MHz to 6 GHz covering all the operating frequency bands of IEEE 802.15.4k. After down frequency conversion and digitization in USRP B210, the received signal is transferred to the common computer with GPP via the USB 3.0 interface. Then, the baseband signal processing functions of the receiver are realized using the real-time GNU radio-based signal processing framework. At the receiver, non-coherent detection is first used for symbol demodulation to eliminate the effect of the frequency and phase offsets. Next, a parallel preamble detection scheme is adopted to handle concurrence data transmission from a massive number of monitoring nodes [10]. In each processing thread, a fast Fourier transform (FFT)-based algorithm is employed to implement the correlation process for preamble detection, and a dynamic timing adjustment algorithm is used to track the optimal sampling time [24].
B. Software Implementation As shown in Fig. 1, a large number of software programs are required for not only in the IoT cloud but also the client so as that users can make the full use of the services provided by the processed system. 1) Server: There are mainly three servers in the IoT cloud with different functions, i.e., •
Data Processing Server The sensed air quality data arrive at the IoT cloud continuously. Raw data cannot be directly utilized due to the presence of possible transmission errors and machine failures. Specific pre-processing procedures are needed to detect and filter out “dirty” data so as to ensure data integrity and reliability.
9
Next, the filtered data are analyzed to reveal the air quality trend by the data processing server. For example, when a user wants to know the air quality information of a particular geographical location during the past one week or even one month, the processed data may be sent instead of the raw data. By this way, a small amount of data is needed for transmission to reduce latency. •
Storage Server Not only the filtered raw data but also the analytical results are stored in the database of the storage server. Moreover, there is a trigger function in the storage server to notify the user when new analytical results become available. As soon as new sensing data arrive at the cloud, new analytical results will be generated by the data processing server and stored in the database. Meanwhile, it is also sent to the active user with the WebSocket protocol. WebSocket is applied in order to provide efficient and reliable communication between the server and clients. Without repeated HTTP headers, the transmission delay of air quality data can be reduced to a certain extent [18]. In this way, the server is able to update the air quality information in real time while avoiding too many simultaneous requests.
•
HTTP Server The HTTP protocol is used to provide services to users, and thus an HTTP server is developed using Servlet and JSP (JavaServer Pages) [19]. It is deployed in a web container, i.e., Tomcat, which is responsible for managing the lifecycle of servlets. The HTTP server interacts with clients through a two-way Request-Response mode, namely POST and GET. Also, it provides APIs for clients to request the air quality information by using a web browser or a mobile APP.
2) Display Applications: As aforementioned, either a website or a mobile APP can be used to display the air quality information to end users. Our homepage is developed using HTML, JavaScript and CSS, and an Android APP is also provided. Fig. 4(a) and Fig. 4(b) illustrate the GUI interfaces of the website and the mobile APP, respectively. Through the display applications, the air quality information can be shown in real-time, e.g., •
Current Air Quality Indicator (AQI);
•
AQI trend of the present day;
•
AQI trend in last week/month.
10
(a) Webpage.
(b) Mobile APP. Fig. 4. Examples of GUI interface in the air quality monitoring system.
IV. E XPERIMENTAL R ESULTS AND A NALYSIS A. Experimental Configurations Our experiments are carried out in a typical urban environment. The wipe antenna of the AP is installed on the roof of a 15-floor building at the center of the university campus. The received RF signal is fed to USRP B210 located in the room through a 10-meter cable. The main system parameters in field tests are listed in Table I. Our LPWA-based air quality monitoring system is deployed using a star topology as illustrated in Fig. 5(a), which consists of five monitoring nodes distributed over an area of around a radius of 3 km from the center of university campus. The photo of a monitoring node is shown in Fig.
11
TABLE I M AIN PARAMETERS OF THE LPWA NETWORK . Parameters PHY Mode Modulation scheme GFSK deviation Carrier frequency Symbol rate Preamble PSDU Spreading factor (SF) Transmit power Number of Sensing nodes
Value DS-SS GFSK 100 kHz 433 MHz 200 ksym/s 4 bytes 16 bytes 32768 5 dB, 15 dB 5
5(b). Both the AP and monitoring node operate at the frequency band of 433 MHz with a symbol rate 200 Kbps. In each packet sent by the monitoring node, the physical protocol data unit (PPDU) that consists of a 4-octet preamble and a 16-octet physical service data unit (PSDU) is spreaded by the Gold code with an SF of 32,768. Each monitoring node is powered by a solar panel and reports the collected air quality data to the LPWA AP every 10 minutes. As a metric to indicate air quality, the Air Quality Index (AQI) α is calculated through measuring six major air pollutants, i.e., PM2.5 , PM10 , carbon monoxide (CO), sulfur dioxide (SO2 ), nitrogen dioxide (NO2 ), and ozone (O3 ) [20]. The higher the AQI, the greater the level of air pollution and as well as the health concern. The level of each pollutant, i.e., Individual Air Quality Index (IAQI), is computed as
ip =
Ahigh − Alow (βp − Blow ) + Alow , Bhigh − Blow
(1)
where ip is the IAQI of the pth pollutant, βp is the concentration of the pth pollutant, Bhigh is the nearest concentration point larger than βp , Blow is the nearest concentration point smaller than βp , Alow is the IAQI point corresponding to Blow , and Ahigh is the IAQI point corresponding to Bhigh . The critical points for six air pollutants are given by China’s Ministry of Environmental Protection in [20]. For example, the critical points for PM2.5 and PM10 are listed in Table II, which are the only two metrics concerned in our air quality monitoring system. Then, the AQI can be given as the highest value of all the measured IAQIs, i.e.,
12
Node 3 [5 dBm]
3 km
2 km
Node 2 [5 dBm]
1 km
Node 1 [5 dBm]
Node 5 [15 dBm]
Node 4 [15 dBm]
AP
Node
(a) Location of the monitoring nodes in the field trial.
Solar Panel
Monitoring Node
(b) Photo of the monitoring node. Fig. 5. Deployment of the LPWA-based air quality monitoring system in the field trial.
α = max{i1 , i2 , ..., in }.
(2)
13
TABLE II C ONCENTRATION POINTS FOR PM2.5 IAQI 0 50 100 150 200 300 400 500
PM2.5 (µm/m3 ) 0 35 75 115 150 250 350 500
AND
PM10 .
PM10 (µm/m3 ) 0 50 150 250 350 420 500 600
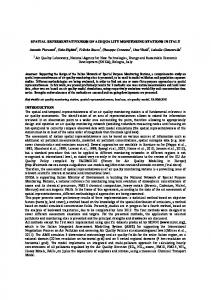
B. Results and Analysis To evaluate the performance of the LPWA network, we utilize the carrier-to-interference (C/I) value of received packets as the performance metric, which is defined as the ratio of the maximum of normalized correlation values calculated in the preamble detector to the received signal power. When a node is deployed, its transmit power is configured according to its distance to the AP, e.g., 5 dBm for the distance within 0.5 km, and 15 dBm for the distance between 0.5 km to 3 km. Thus, without excessive power consumption, the C/I values of all the nodes are almost larger than -30 dB, which is the C/I threshold to ensure that the received packets are decoded successfully [10]. Meanwhile, the impact of the near-far effect can be mitigated too. In order to demonstrate the effectiveness of our system design, Fig. 6 plots the average C/I value of the received packets from different monitoring nodes, where the average C/I values of all the nodes are higher than the C/I threshold. As can be seen from Fig. 6, for N odes 1, 3, 4, and 5, the average C/I value gradually decreases with the increase of the node’s distance to the AP. It is because a longer distance generally results in a larger path loss, which has an immediate effect on the computation of the correlation values in the preamble detector of the AP. Although N ode 2 and N ode 3 are deployed in nearly the same distance to the AP with the same transmit power, N ode 2 has a much lower average C/I value than N ode 3 by 20 dB. This is because a building is located along the direct path between N ode 2 and the AP, so that N ode 2 suffers from more severe channel fading. Air quality data are collected through the LPWA system and used for further analysis. Only the measured data from April 1-14, 2016 are chosen for the sake of illustration. Air quality data including PM2.5 , PM10 and AQI is provided in Fig. 7. In order to verify the reliability of this air quality monitoring system, another set of data is obtained from a well-known PM2.5 historical database, i.e., the Young-0.com [22].
14
5
Node 1
C/I
Node 3
0
C/I (dB)
-5 -10
Node 4
-15 Node 2
-20 Node 5
-25 Threshold= -30 dB
-30 0.0
0.5
1.0
1.5
2.0
Distance (km) Fig. 6. Transmit power and C/I value of each node. 300
PM2.5 PM10 AQI
200
3
Air Quality (ug/m )
250
150
100
50
0 Apr. 1st
3
5
7
9
11
13
15
Fig. 7. Air quality data including PM2.5 , PM10 and AQI.
The two datasets are compared in Fig. 8. It is evident that the trends of the two lines well coincide, and the discrepancy may be due to the different measurement locations. Therefore, the air quality data obtained by the proposed system can satisfy both the accuracy and reliability requirements. PM2.5 concentration is highly related to some meteorological features such as the temperature, humidity and wind speed, whose data can be obtained from a meteorological data sharing website [21]. As an example, Fig. 9 plots the relationship between PM2.5 and the wind speed. From April 3-7, 2016, the PM2.5 concentration increased gradually with the wind speeds slower than 4 m/s, and reached the peak
15
350
Measured Data Reference Data 300
3
PM2.5 (ug/m )
250
200
150
100
50
0
Apr. 1st
3
5
7
9
11
13
15
Fig. 8. Comparison between the measured and reference data on PM2.5 concentration. 8
240 PM2.5 Wind Speed
7
200 6 160 3
PM2.5 (ug/m )
4
120
3 80
Wind Speed (m/s)
5
2 40 1 0
0 Apr. 1st
3
5
7
9
11
13
15
Fig. 9. Relationship between PM2.5 concentration and the wind speed.
on the noon of April 7, 2016. Then, it dropped rapidly below 20 µg/m3 and kept low during April 8-11, 2016, which was due to the dispersal of air pollutants by strong winds. Thus, it can be concluded that air quality depends on the variation of the wind speed somehow. V. C ONCLUSION We have implemented an air quality monitoring system by using the advanced IoT techniques in this paper. With the aid of the LPWA network, the air sensing data over a large coverage area is collected and transmitted to the IoT cloud in time. The portal monitoring nodes are developed for easy deployment
16
and can work all day with a battery or a solar panel. All the functions of the AP are implemented on a GPP-based SDR platform. The sensed data are stored in the database and analyzed in the IoT cloud. A plenty of experiments have been carried out in the urban environments to validate the reliability of the proposed system. Some interesting facts have been revealed when comparing the air quality trend and other similar data. It is believed that long-term and large-scale air monitoring can greatly help us understand air pollution and find a way to solve the problem of air pollution at least partially. VI. ACKNOWLEDGMENT This work was supported by the National High-Tech R&D Program (863 Program 2015AA01A705), the National Key Technology R&D Program of China under the grant 2015ZX03002009-004, the China Natural Science Funding under the grant 61271183, and the Fundamental Research Funds for the Central Universities under grant 2014ZD03-02. R EFERENCES [1] E. Fotopoulou, A. Zafeiropoulos, D. Papaspyros, P. Hasapis, G. Tsiolis, T. Bouras, S. Mouzakitis, and N. Zanetti, “Linked data analytics in interdisciplinary studies: the health impact of air pollution in urban areas,” IEEE Access, vol. 4, pp. 149-164, Mar. 2016. [2] K. B. Shaban, A. Kadri, and E. Rezk, “Urban air pollution monitoring system with forecasting models,” IEEE Sensors Journal, vol. 16, no. 8, pp. 2598-2606, Apr. 2016. [3] W. Li, K. Lo, and M. Terrence, “A survey of wireless sensor network based air pollution monitoring systems,” Sensors, vol. 15, no. 12, pp. 31392-31427, Dec. 2015. [4] C. Peng, K. Qian, and C. Wang, “Design and application of a VOC-monitoring system based on a ZigBee wireless sensor network,” IEEE Sensors Journal, vol. 15, no. 4, pp. 2255-2268, Apr. 2015. [5] S. He, J. Chen, X. Li, X. Shen, and Y. Sun, “Mobility and intruder prior information improving the barrier coverage of sparse sensor networks,” IEEE Transactions on Mobile Computing, vol. 13, no. 6, pp. 1268-1282, Jun. 2014. [6] J. Chen, W. Xu, S. He, Y. Sun, P. Thulasiraman, and X. Shen, “Utility-based asynchronous flow control algorithm for wireless sensor networks,” IEEE Journal on Selected Areas in Communications, vol. 28, no. 7, pp. 1116-1126, Aug. 2010. [7] L. Lei, Y. Kuang, X. Shen, K. Yang, J. Qiao, and Z. Zhong, “Optimal reliability in energy harvesting industrial wireless sensor networks,” IEEE Transactions on Wireless Communications, doi: 10.1109/TWC.2016.2558146. [8] Y. Ma, S. Yang, Z. Huang, Y. Hou, L. Cui, and D. Yang, “Hierarchical air quality monitoring system design,” in Proc. IEEE 2014 International Symposium on Integrated Circuits (ISIC), Singapore, Dec. 2014, pp. 284-287. [9] Y. Yang and L. Li, “A smart sensor system for air quality monitoring and massive data collection,” in Proc. IEEE 2015 International Conference on Information and Communication Technology Convergence (ICTC), Jeju, South Korea, Oct. 2015, pp. 147-152. [10] X. Xiong, K. Zheng, R. Xu, W. Xiang, and P. Chatzimisios, “Low power wide area machine-to-machine networks: key techniques and prototype,” IEEE Commun. Mag., vol. 53, no. 9, pp. 64-71, Sep. 2015. [11] Sigfox, Sigfox - One network a billion dreams, Whitepaper. [12] 3GPP RAN Tdoc RP-151621, “New WI proposal: narrow band IOT,” approved in RAN plenary #69 meeting, Sep. 2015. [13] L. Lei, Y. Kuang, N. Cheng, X. Shen, Z. Zhong, and C. Lin, “Delay-optimal dynamic mode selection and resource allocation in deviceto-device communicationspart II: practical algorithm,” IEEE Transactions on Vehicular Technology, vol. 65, no. 5, pp. 3491-3505, May 2016. [14] S. Andreev et al., “Understanding the IoT connectivity landscape: a contemporary M2M radio technology roadmap,” IEEE Commun. Mag., vol. 53, no. 9, pp. 32-40, Sep. 2015. [15] “IEEE Standard for Local and metropolitan area networks Part 15.4: Low-Rate Wireless Personal Area Networks (LR-WPANs) Amendment 5: Physical Layer Specifications for Low Energy, Critical Infrastructure Monitoring Networks,” IEEE Std 802.15.4k-2013, Aug. 2013. [16] X. Li, E. Iervolino, F. Santagata, J. Wei, C. A. Yuan, P. M. Sarro, and G. Q. Zhang, “Miniaturized particulate matter sensor for portable air quality monitoring devices,” in Proc. IEEE SENSORS 2014 Proceedings, Valencia, Nov. 2014, pp. 2151-2154. [17] Alldatasheet.com, “STM32F103RC Datasheet(PDF) STMicroelectronics,” 2016. [Online]. Available: http://www.alldatasheet.com/datasheet-pdf/pdf/231959/STMICROELECTRONICS/STM32F103RC.html. [Accessed: 05- May- 2016].
17
[18] V. Pimentel and B. G. Nickerson, “Communicating and displaying real-time data with WebSocket,” IEEE Internet Computing, vol. 16, no. 4, pp. 45-53, Aug. 2012. [19] Tomcat.apache.org, “Servlet and JavaServer Pages API documentation,” 2016. [Online]. Available: https://tomcat.apache.org/tomcat4.1-doc/servletapi/. [Accessed: 30- Apr- 2016]. [20] People’s Republic of China Ministry of Environmental Protection, “People’s Republic of China Ministry of Environmental Protection Standard: technical regulation on ambient air quality index,” pp. 2, Feb. 2012. [21] Rp5.ru, “Weather for 243 countries of the world,” 2016. [Online]. Available: http://rp5.ru/Weather in the world. [Accessed: 30- Apr2016]. [22] Young-0.com, “China PM2.5 report,” 2016. [Online]. Available: http://www.young-0.com/airquality. [Accessed: 30- Apr- 2016]. [23] Ti.com, “CC1125 online datasheet,” 2016. [Online]. Available at: http://www.ti.com/product/CC1125/datasheet. [Accessed 15- Jun2016]. [24] X. Xiong, T. Wu, H. Long, and K. Zheng, “Implementation and performance evaluation of LECIM for 5G M2M applications with SDR,” in Proc. IEEE 2014 Globecom Workshops (GC Wkshps), Austin, TX, Dec. 2014, pp. 612-617.