To prevent air pollution we have to provide real time monitoring of all polluted materials at proper ... Key Words: Air Quality, Monitoring, Measuring Station, Real Time. INTRODUCTION ..... media (TV, radio or news boards). Weekly and monthly ...
FACTA UNIVERSITATIS Series: Working and Living Environmental Protection Vol. 4, No 1, 2007, pp. 55 - 64
IMPLEMENTATION OF AIR QUALITY MONITORING SYSTEM UDC 504.06.677 Viša Tasić1, Dragan Milivojević1, Nenad Živković2, Amelija Đorđević2 1
2
Copper Institute Bor Faculty of Occupational Safety Niš
Abstract. The present state of the air quality control in almost all industrial centers in our country is based on taking samples one or few times a day, which means that there is no information about time distribution of polluted materials intensity during day. This is the main disadvantage of such control, having in mind often changes of meteo conditions. Most of the systems for the air quality monitoring in West European countries work on real time bases. To prevent air pollution we have to provide real time monitoring of all polluted materials at proper locations by using distributed (real time) air quality monitoring systems. Key Words: Air Quality, Monitoring, Measuring Station, Real Time
INTRODUCTION In many Serbian cities, the air is polluted by emissions from sources such as cars and trucks, power plants, and manufacturing processes. When gases and particles from those activities accumulate in the air in high enough concentrations, they can be harmful for human health and the environment. Often, terrain and meteorological conditions complicate air quality issues in the area. Although the national trend is toward better outdoor air quality, there are some urban areas in which no improvement has taken place. In those areas, the concentration of pollutants such as carbon monoxide, sulphur dioxide, groundlevel ozone, and particulate matter (dry particles and liquid droplets emitted by sources such as vehicles, factories, and construction activities) in the air is increasing. Concentrations of outdoor air pollutants vary from day-to-day and even during the course of a day. For health protection, the public needs timely information about air quality and other factors (e.g., weather conditions) that affect it. An access to air quality forecasts allows residents to reduce their exposure when the pollutant concentrations are high. This is im-
Received November 05, 2007
56
V. TASIĆ, D. MILIVOJEVIĆ, N. ŽIVKOVIĆ, A. ĐORĐEVIĆ
portant particularly to people who are sensitive to certain pollutants’ harmful effects. For example, people with asthma may be sensitive to ground-level ozone and sulphur dioxide. To design an air quality monitoring system, we must first identify the purpose of the monitoring. The reasons may be one or more of the following: to improve public awareness of air pollution, reduce health risks from air pollution, or develop ways to reduce air pollution, to identify current and potential air pollution problems, to monitor trends or changes in air quality, to gather information for the design of pollution prevention projects, to monitor pollution reduction activities and determine if the goals of specific programs are being met, to develop emergency response plans for accidental emission releases. After we identify the purpose of the air quality monitoring program, we have to consider the following factors in designing the program: What area do we want to include in the program? Are there already air monitors in place? What are air pollution sources in area? Which parameters should we measure? How often should we measure the parameters? Bor is an industrial town situated in the southeast of the Republic of Serbia. Town area, with its population of more than 50000 inhabitants, is under constant influence of air pollution as the consequence of technological processes in the Copper Smelting Plant. For the sake of better measuring efficiency, engineers from the Copper Institute, Department for Industrial Informatics, developed, produced and put into operation the automatic meteorological measuring station. That station has been working since 1997. On the bases of positive experience in work with the automatic station we insisted on system enlargement with equipment for waste gas concentration monitoring (first of all for SO2). CHOOSING LOCATIONS FOR MONITORING EQUIPMENT The bases for meteorological data, otherwise collected for more than 20 years, are established for sample-taking on the locations suitable for it. Those locations for setting fixed monitoring stations are chosen after the air pollution emission modeling. The most important parameters that have to be taken in account for air pollution emission modeling are of course: wind speed, wind direction, pressure, temperature gradient and topography. The air simulation modeling provides a rational (scientifically based) method for estimating source contributions, which can be then used to determine the effectiveness of emission reduction alternatives. The method can also be applied many times to answer “what if” question for future year emission changes. The screening techniques are simplified calculation procedures designed with sufficient conservatism to allow for clear determination of whether the given source is or is not a potential threat to the air quality, which should be examined with more sophisticated estimation techniques or measurements [1]. Screening estimates of SO2 (obtained by the usage of TSCREEN model), represent maximum short-term ground level concentration estimates from a meteorological perspective. Because of the simplifying assumptions inherent in these screening methods (assume that the toxic air contaminant is non-reactive and non-depositing, all release calculations assume ideal conditions for gas and liquid flows, the influence of obstructions such as buildings and topography on denser-than-air releases and releases close to the
Implementation of Air Quality Monitoring System
57
ground are not included, etc.), which are specifically aimed at decreasing the amount of information required from the user. The process of air pollution modeling includes the four stages (data input, dispersion calculations, deriving concentrations, and analysis), as we can see in Figure 1. The accuracy and uncertainty of each stage must be known and evaluated to ensure a reliable assessment of the significance of any potential adverse effects. Currently, the most commonly used dispersion models are the Gaussian-plume models. These are based on mathematical approximation of plume behavior and are the easiest models to use. The Gaussian-plume models are widely used, well understood, easy to apply, and until more recently have received international approval. The Gaussian-plume models play a major role in the regulatory arena. The Gaussian-plume formula is derived assuming the ‘steady-state’ conditions. The meteorological conditions are assumed to remain constant during dispersion from source to receptor, which is effectively instantaneous. For example, for a point source, the user will be asked to provide the following inputs: emission rate (g/s), stack height (m), stack inside diameter (m), stack gas exit velocity (m/s) or flow rate (m3/s), stack gas temperature (K), ambient temperature (K) (293 K if not known), receptor height above ground (may be used to define flagpole receptors) (m), urban/rural option (U = urban, R = rural), etc. The Gaussian model equations and interactions of the source-related and meteorological factors are described in [2]. The basic equation for determination the ground-level concentrations under the plume centerline is: X = Q/(2πusσyσz) ⋅{exp[-½((zr-he)/σz)²] + exp[-½((zr+he)/σz)²] + k
+
∑
[exp[-½((zr-he-2Nzi)/σz)²] + exp[-½((zr+he-2Nzi)/σz)²] + (1)
N =1
+ exp[-½((zr-he+2Nzi)/σz)²] + exp[-½((zr+he+2Nzi)/σz)²] ] } Where: X Q π us σy σz zr he zi k
3 − concentration (g/m ), − emission rate (g/s), − 3.141593, − stack height wind speed (m/s), − lateral dispersion parameter (m), − vertical dispersion parameter (m), − receptor height above ground (m), − plume centerline height (m), − mix height (m), − summation limit for multiple reflections of plume off of the ground and elevated inversion, usually ≤ 4. For stable conditions and/or mixing heights greater than or equal to 10000 m, unlimited mixing is assumed and summation term is assumed as zero.
58
V. TASIĆ, D. MILIVOJEVIĆ, N. ŽIVKOVIĆ, A. ĐORĐEVIĆ
Fig. 1 Overview of the Air Pollution Modeling Procedure [3] Concerning the atmospheric pollution, the major environmental issues in the Bor area include annual emissions to the atmosphere of up to 250000 tonnes of sulphur dioxide and up to 1300 tonnes of particulate contaminated with heavy metals. The weather is monitored using a conventional mechanical system and traditional measurements of humidity, temperature, rainfall and maximum/minimum temperatures. Wind speed and direction indicate environmental risk areas affected by major pollution sources. From the obtained meteorological data, the prevailed winds were found to be predominantly from west - northwest and therefore tend to carry the pollution away from the main centers of population. During the rainy periods, the typical east or southeast winds are of more concern. Light and variable winds are likely to cause very highly-localized concentrations of vapors. Inversions may also occur in these situations thus causing increasing vapors in general area. The background data indicate that sulphur dioxide, particulate and arsenic from the Smelter Complex and particulate (which also include arsenic) from windblown unstable dam material are the major atmospheric pollutants in the mining and processing areas of Bor. The pollutants may have a severe effect on the local population health. According to the data for last few years provided by the Copper Institute Bor, both Serbian 24 hour limit (150 µg/m3) and EC 24 hour limit (125 µg/m3) were exceeded during calm weather days.
Implementation of Air Quality Monitoring System
59
Short term (1-hour average) SO2 concentrations results obtained by TSCREEN model, (Figure 2) for the worst case of weather and emission rate condition shows a good correlation in comparison with measured values obtained by UK standard 8 port samplers that measure sulphur dioxide.
Fig. 2 1-hour Average SO2 Concentrations Modeled by TSCREEN [5] Based on the modeling results, the locations for the real time air quality monitoring equipment setting were determined. As part of the UNOPS project YUG 00-R71 CleanUp of Environmental Hotspots, two fixed stations for SO2 monitoring arrived in Bor in the summer of 2003. One fixed station for SO2 concentration monitoring was situated in the Town Park, and other at Jugopetrol Warehouse (see Figure 3). The locations were intended to allow the monitoring of sulphur dioxide concentrations downwind from the smelter source during the two prevailing wind directions.
60
V. TASIĆ, D. MILIVOJEVIĆ, N. ŽIVKOVIĆ, A. ĐORĐEVIĆ
Fig. 3 Locations for Setting the Real Time Air Quality Monitoring Equipment (1- Town Park, 2- Jugopetrol Warehouse) [4] CONTINUOUS AIR QUALITY MONITORING The type of air quality monitoring that we do and the monitoring equipment we select as well as the locations of the monitors depend on our project’s objectives. Monitoring can either be done continuously or for a discrete period. When the operator retrieves and analyzes data collected at a location different from the monitoring site itself, the monitoring is called remote. This paper discusses the equipment needed for continuous air quality monitoring and the location of the air monitoring equipment. As we can see in Figure 4, the typical air quality monitoring network consists of a few measurement points (fixed or mobile) with automatic analyzers otherwise connected to the servers in the control center by modem devices. In case of the monitoring system applied in Bor there are two fixed stations for SO2 concentration monitoring. The station in Town Park is equipped with meteo sensors. Meteorological parameters are also measured at the Copper Institute by automatic fixed station. Measuring concentrations of flying particles (dust monitoring), at proper locations, happens occasionally, which depends on wind direction and other meteo conditions. For communications between the fixed station and the PC in the control center (situated in the Copper Institute) we use classical switched telephone lines. There are asynchronous modems in both fixed stations and on the PC in the control center. The mobile station uses direct connection with PC for data downloading. The
Implementation of Air Quality Monitoring System
61
existing automatic meteorological station is also a part of new monitoring system. Figure 5 shows configuration of the air quality monitoring system in Bor.
Fig. 4 Overview of the Air Quality Monitoring Network All measuring stations are microprocessor-controlled devices with local displays and function keyboards. Every station has auto calibration function, and the possibility for local or remote user define adjustment of measuring, average, and storage intervals. On the PC in the control center (which run under Windows XP) the program Contact is set up for interactive work with the fixed stations. In addition, the same PC has another program set up, WinLoad, for transferring of measurement results from the fixed stations to the PC. The measurement results are stored in text files (one file per station). For downloading of the results from the mobile stations to the PC we use another program AirQ32. Data transferring form stations to PC occurs periodically, programmed and completely controlled by PC. For the real time monitoring of air quality some special tasks were created (running every xx minutes). Graphic data presentation occurs with control of Visual Basic modules in Excel. It was agreed that average values from the fixed stations have to be transferred to the PC (situated at the control center in the Copper Institute) every 15 minutes, so new data values taken from text files appear in worksheets every 15 minutes.
62
V. TASIĆ, D. MILIVOJEVIĆ, N. ŽIVKOVIĆ, A. ĐORĐEVIĆ
Fig. 5 Configuration of Air Quality Monitoring System in Bor [5]
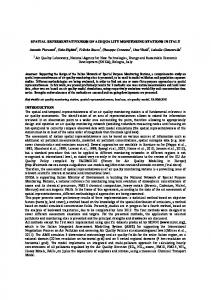
Fig. 6 Fixed Station with SO2 Analyzer and Meteo Station at Town Park in Bor [5] On the bases of long-term experiences in the air quality control, the way of operation, forms and contents of reports are established. Figure 7 shows part of the monthly report provided by the monitoring system. The reports are for public use by means of local media (TV, radio or news boards). Weekly and monthly reports consist of tables with statistical presentations of air quality on each measure point, a ‘rose of winds’ for time interval of concern, as well as graphic comparison of production of SO2 in Copper Smelting Plant, and concentrations of those gases at the measuring points in town.
Implementation of Air Quality Monitoring System
63
Monthly air quality report for Bor town area (sulphur dioxide part) February 2004 Measuring results for SO2 Wind rose m/s
0N
7 6
315
5
Limit value GVI ( µg/m3)
Location
Above limit value ( %)
45
4 3 2 1
W
0
270
90
1
Town Park
350
3.0
Jugopetrol
350
18.1
2 3 4 5 6
225
135
7 180
S
Graphical presentation of measured values of SO2 (hourly average values)
Graphical presentation of production of SO2 in Smelting Plant
Fig. 7 An Example of Monthly Report (SO2 part) [5]
64
V. TASIĆ, D. MILIVOJEVIĆ, N. ŽIVKOVIĆ, A. ĐORĐEVIĆ
CONCLUSION This paper describes system for air quality monitoring applied at Bor. Some specific details of hardware and software realization are noted. The process of installation, testing and system calibration was quite troublesome. Quite unexpectedly, the organization problems were much more serious than technical ones. After few months of experimental work, the monitoring system was put into operation. Until today the system has shown good stability and repeatability. Comparing of the system results to the ones obtained by the classical methods shows their good agreement. REFERENCES 1. OEHHA, Technical Support Document for Exposure and Stochastic Analysis, www.oehha.ca.gov/air/hot_spots/pdf/chap2.pdf, California, 2000. 2. U.S. EPA, SCREEN3 Model User’s Guide, EPA-454/B-95-004, Research Triangle Park, NC, 1995. 3. Ministry for the Environment Manatū Mō Te Taiao, Good Practice Guide for Atmospheric Dispersion Modelling, www.mfe.govt.nz, ISBN: 0-478-18941-9 ME:522,Wellington, New Zealand, 2004. 4. UNEP&LEAP Bor, Local Ecological Action Plan, Municipality of Bor, Serbia, 2003. 5. Viša Tasić, Distributed Monitoring Systems and Air Pollution Risc, PhD. Theses, Faculty of Occupational Safety, Niš, Serbia, 2007..
PRIMENA SISTEMA ZA MONITORING KVALITETA VAZDUHA Viša Tasić, Dragan Milivojević, Nenad Živković, Amelija Đorđević Aktuelni način kontrole kvaliteta vazduha u većini industrijskih centara u našoj zemlji baziran je na dnevnom uzorkovanju (jednom ili nekoliko puta u toku dana). To znači da uglavnom ne postoji informacija o vremenskoj raspodeli intenziteta zagađujućih materija u toku dana, što predstavlja i najveći nedostatak ovakve kontrole. Imajući u vidu promenljivost emisije zagađujućih materija u toku dana, kao i česte promene meteoroloških parametara, većina sistema za kontrolu kvaliteta vazduha u zemljama Zapadne Evrope zasniva se na radu u realnom vremenu. Članak sadrži opis načina za izbor lokacija za instaliranje stacionarnih mernih uređaja, kao i prikaz rezultata dobijenih primenjenog distribuiranog sistema za monitoring kvaliteta vazduha u Boru. Ključne reči: kvalitet vazduha, monitoring, merna stanica, realno vreme