BERLIN UNIVERSITY OF APPLIED SCIENCES (HTW)
Design and implementation of web-based navigation concepts for a multi-dimensional product catalog
by Daniel Senff
Supervisor: Prof. Dr. Kai-Uwe Barthel Examiner: Prof. Dr. Klaus Jung
A thesis submitted in partial fulfillment for the degree of Master of Science
in the Internationale Medieninformatik Master / Media and Computing Master Berlin University of Applied Sciences (HTW)
April 2013
“Benefits of familiarity with a physical store do not always outweigh the rapid retrieval and aggregation abilities afforded by hypermedia.”
Stephen Hughes, 2002
BERLIN UNIVERSITY OF APPLIED SCIENCES (HTW)
Abstract Internationale Medieninformatik Master / Media and Computing Master Berlin University of Applied Sciences (HTW) Master of Science by Daniel Senff
Hardware-supported high-performance 3D graphics in modern web browsers are about to gain widespread support with the advent of WebGL. The new HTML5 specification brings cross-platform 3D to the Web and opens new opportunities by embedding 3D within the website. Use of three-dimensional environments in the Web has been proposed numerous times before. Especially in the context of e-commerce, 3D was always regarded with high potential for recreating the real-live shopping experience in Virtual Reality stores. This metaphor was suggested and implemented multiple times, but did not result in established successful systems. The hypertext-media Web formed user experiences and expectations in usability, performance and interconnectedness, Virtual Reality could not fulfill. Transforming the convenience shop paradigm and integrating it with the Web failed. However use of 3D in the Web is not limited to Virtual Reality. Web3D still bears potential for visualization and interaction. For e-commerce, one new approach is to lose the metaphor of the convenience store and embrace the hypertext media the 3D environment is embedded in. This thesis will present an implementation of a web application showcasing modern web technologies. It will provide interactive 3D visualization experiments of product catalog data. Navigation concepts through the catalog will be analyzed and implemented. A special focus will be on integration with the website and retaining hypertext funcitonality lost in previous installments of 3D in the browser. The 3D graphics provided in this application will follow the Imperative 3D approach of procedural graphics programming in JavaScript. Differences to the alternative Declarative 3D approach often deployed for Web3D will be worked out and a unique combination of both will be provided using CSS-transforms.
Acknowledgements First and foremost, I would like to thank Prof. Dr.-Ing. Kai Uwe Barthel, for enabling me to write my thesis on this topic, for his valuable ideas and his constant support throughout the work on this thesis. I am also grateful having Prof. Dr. Klaus Jung as my co-examiner. I thank David Fichtm¨ uller, Brian N¨ urnberg and Daniel Fredrich for proof-reading this thesis and general moral support. Thank you! I also want to thank everyone, who tried the software, listened to my premise, asked the right questions and gave me valuable feedback to improve upon. Thanks to David Beckstein at pixolution for answering my questions about the system. I would like to thank the three.js-community, who helped me when I had questions. I hope my patches and feedback help the project. Special thanks to my sister Ulrike for her support and reliability. Thank you, Nora for shaking things up, keeping me honest and being a close and dear friend. And to Laura, Sarah, Anne, Anika, Steffi, Asmus, Sven and to the music - I owe you all. Finally I would like to thank my family, friends and colleagues for their patience and support. The past months, I was not available as often as I would have liked. Thank you for your considerations and for being available on short notice when I really needed a break. Thank you!
iii
Contents Abstract
ii
Acknowledgements
iii
List of Figures
vii
List of Listings
ix
List of Tables
x
Abbreviations
xi
1 Introduction 1.1 Outline . . . . . . . . . . . . . . . . . . . . . . . . . . . . . . . . . . . . . 1.2 Motivation . . . . . . . . . . . . . . . . . . . . . . . . . . . . . . . . . . . 2 Background information 2.1 e-commerce . . . . . . . . . . . . . . . . . . . 2.1.1 Definition . . . . . . . . . . . . . . . . 2.1.2 e-commerce in WWW . . . . . . . . . 2.2 Visualization . . . . . . . . . . . . . . . . . . 2.2.1 Graphical data representation . . . . . 2.2.2 Spatial data visualization . . . . . . . 2.3 3D User Interfaces . . . . . . . . . . . . . . . 2.3.1 Virtual Reality . . . . . . . . . . . . . 2.3.2 Skeuomorphism . . . . . . . . . . . . . 2.3.3 Information-rich Virtual Environments 2.4 Technologies . . . . . . . . . . . . . . . . . . . 2.4.1 HTML . . . . . . . . . . . . . . . . . . 2.4.2 JavaScript . . . . . . . . . . . . . . . . 2.4.3 CSS . . . . . . . . . . . . . . . . . . . 2.4.4 Web3D . . . . . . . . . . . . . . . . . 2.4.5 WebGL . . . . . . . . . . . . . . . . .
. . . . . . . . . . . . . . . .
. . . . . . . . . . . . . . . .
. . . . . . . . . . . . . . . .
. . . . . . . . . . . . . . . .
. . . . . . . . . . . . . . . .
. . . . . . . . . . . . . . . .
. . . . . . . . . . . . . . . .
. . . . . . . . . . . . . . . .
. . . . . . . . . . . . . . . .
. . . . . . . . . . . . . . . .
. . . . . . . . . . . . . . . .
. . . . . . . . . . . . . . . .
. . . . . . . . . . . . . . . .
. . . . . . . . . . . . . . . .
. . . . . . . . . . . . . . . .
. . . . . . . . . . . . . . . .
1 1 2 3 3 3 4 6 6 7 8 10 13 16 16 17 17 20 20 23
3 Concept/Analysis 25 3.1 Goal . . . . . . . . . . . . . . . . . . . . . . . . . . . . . . . . . . . . . . . 25 iv
Contents 3.2
3.3
3.4
3.5 3.6
Navigation concepts . . . . . . . . . . . . 3.2.1 Web and e-commerce taxonomy . . 3.2.2 Search based navigation . . . . . . 3.2.3 Browse based navigation . . . . . . 3.2.4 Hypertext features . . . . . . . . . 3.2.5 Aesthetics . . . . . . . . . . . . . . 3.2.6 Customization . . . . . . . . . . . Requirements . . . . . . . . . . . . . . . . 3.3.1 Data set and backend . . . . . . . 3.3.2 e-commerce frontend . . . . . . . . 3.3.3 Deployment . . . . . . . . . . . . . 3.3.4 Browser support and compatibility 3.3.5 Visualization . . . . . . . . . . . . 3.3.6 Requirements table . . . . . . . . . Previous implementations . . . . . . . . . 3.4.1 Virtual Reality . . . . . . . . . . . 3.4.2 3D web shops . . . . . . . . . . . . Excluded requirements . . . . . . . . . . . Proposed project . . . . . . . . . . . . . .
4 Implementation/Realization 4.1 System architecture . . . . . . . . . . . . 4.1.1 Data backend . . . . . . . . . . . . 4.1.2 Data set . . . . . . . . . . . . . . . 4.1.3 Library . . . . . . . . . . . . . . . 4.1.4 Dependencies . . . . . . . . . . . . 4.1.5 Application structure . . . . . . . 4.1.6 Frontend . . . . . . . . . . . . . . 4.1.7 Deployment . . . . . . . . . . . . . 4.2 WebGL toolkit . . . . . . . . . . . . . . . 4.2.1 three.js . . . . . . . . . . . . . . . 4.2.2 sim.js . . . . . . . . . . . . . . . . 4.2.3 Other considered WebGL toolkits . 4.3 Rendering modes . . . . . . . . . . . . . . 4.3.1 WebGLRenderer . . . . . . . . . . 4.3.2 CSS3DRenderer . . . . . . . . . . 4.4 Data flow . . . . . . . . . . . . . . . . . . 4.5 Navigation . . . . . . . . . . . . . . . . . . 4.6 Spatial data organization . . . . . . . . . 4.6.1 Visual arrangements . . . . . . . . 4.6.2 Camera and controls . . . . . . . . 4.6.3 DragSurface . . . . . . . . . . . . . 4.6.4 Customization . . . . . . . . . . . 4.7 History and persistence . . . . . . . . . . 4.8 Tracking and adaptive techniques . . . . . 4.9 Encountered challenges . . . . . . . . . . . 4.9.1 Infinite Wrapping Grid . . . . . . .
v . . . . . . . . . . . . . . . . . . .
. . . . . . . . . . . . . . . . . . . . . . . . . .
. . . . . . . . . . . . . . . . . . .
. . . . . . . . . . . . . . . . . . . . . . . . . .
. . . . . . . . . . . . . . . . . . .
. . . . . . . . . . . . . . . . . . . . . . . . . .
. . . . . . . . . . . . . . . . . . .
. . . . . . . . . . . . . . . . . . . . . . . . . .
. . . . . . . . . . . . . . . . . . .
. . . . . . . . . . . . . . . . . . . . . . . . . .
. . . . . . . . . . . . . . . . . . .
. . . . . . . . . . . . . . . . . . . . . . . . . .
. . . . . . . . . . . . . . . . . . .
. . . . . . . . . . . . . . . . . . . . . . . . . .
. . . . . . . . . . . . . . . . . . .
. . . . . . . . . . . . . . . . . . . . . . . . . .
. . . . . . . . . . . . . . . . . . .
. . . . . . . . . . . . . . . . . . . . . . . . . .
. . . . . . . . . . . . . . . . . . .
. . . . . . . . . . . . . . . . . . . . . . . . . .
. . . . . . . . . . . . . . . . . . .
. . . . . . . . . . . . . . . . . . . . . . . . . .
. . . . . . . . . . . . . . . . . . .
. . . . . . . . . . . . . . . . . . . . . . . . . .
. . . . . . . . . . . . . . . . . . .
. . . . . . . . . . . . . . . . . . . . . . . . . .
. . . . . . . . . . . . . . . . . . .
. . . . . . . . . . . . . . . . . . . . . . . . . .
. . . . . . . . . . . . . . . . . . .
. . . . . . . . . . . . . . . . . . . . . . . . . .
. . . . . . . . . . . . . . . . . . .
. . . . . . . . . . . . . . . . . . . . . . . . . .
. . . . . . . . . . . . . . . . . . .
. . . . . . . . . . . . . . . . . . . . . . . . . .
. . . . . . . . . . . . . . . . . . .
26 28 29 30 31 32 33 34 34 35 35 36 37 38 38 40 45 49 49
. . . . . . . . . . . . . . . . . . . . . . . . . .
51 51 52 54 55 56 57 59 62 63 63 64 64 66 67 68 69 71 73 73 75 76 77 78 80 81 81
Contents 4.9.2
vi Viewport projection . . . . . . . . . . . . . . . . . . . . . . . . . . 84
5 Results/Evaluation 5.1 Project evaluation . . . . . . . . . 5.1.1 Implementation . . . . . . . 5.1.2 Virtual environment . . . . 5.1.3 Navigation & Visualization 5.2 Requirements evaluation . . . . . . 5.2.1 Usability . . . . . . . . . . 5.2.2 Performance . . . . . . . . 5.2.3 IRVE . . . . . . . . . . . . 5.2.4 Requirements assessment . 5.3 Development potential . . . . . . . 5.3.1 Features & Enhancements . 5.3.2 Graphics & Aesthetics . . . 5.3.3 Technology . . . . . . . . .
. . . . . . . . . . . . .
6 Conclusion
. . . . . . . . . . . . .
. . . . . . . . . . . . .
. . . . . . . . . . . . .
. . . . . . . . . . . . .
. . . . . . . . . . . . .
. . . . . . . . . . . . .
. . . . . . . . . . . . .
. . . . . . . . . . . . .
. . . . . . . . . . . . .
. . . . . . . . . . . . .
. . . . . . . . . . . . .
. . . . . . . . . . . . .
. . . . . . . . . . . . .
. . . . . . . . . . . . .
. . . . . . . . . . . . .
. . . . . . . . . . . . .
. . . . . . . . . . . . .
. . . . . . . . . . . . .
. . . . . . . . . . . . .
. . . . . . . . . . . . .
. . . . . . . . . . . . .
88 88 89 89 90 91 91 92 93 94 95 95 96 97 99
A Code examples
101
B Contents of CD
102
C Stand-alone HTTP server
103
D XML communcation to backend
104
E Code examples of Infinite Wrapping
105
Bibliography
107
Declaration of Authorship
112
List of Figures 2.1 2.2 2.3 2.4 2.5 2.6 2.7 2.8
Types of commerce [1] . . . . . . . . . . . Screenshots of amazon.com and ebay.com Illustration of Object and Viewport space Calculator UI layout . . . . . . . . . . . . Screenshot of iOS calendar app . . . . . . Screenshot of Windows8’s Modern UI . . Declarative and Imperative 3D in the Web Web technologies available on platform . .
. . . . . . . .
. . . . . . . .
. . . . . . . .
. . . . . . . .
. . . . . . . .
. . . . . . . .
. . . . . . . .
. . . . . . . .
. . . . . . . .
. . . . . . . .
. . . . . . . .
. . . . . . . .
. . . . . . . .
. . . . . . . .
. . . . . . . .
. . . . . . . .
. . . . . . . .
. . . . . . . .
3 6 9 14 15 15 21 24
3.1 3.2 3.3 3.4 3.5 3.6 3.7 3.8 3.9
Screenshot of 3D City World . . . . . . . . Screenshot of 3D City World . . . . . . . . Screenshot of Soonique . . . . . . . . . . . . Screenshots of enjoy3D . . . . . . . . . . . . Screenshot of esimple.it demo . . . . . . . . Screenshot of Shop3D Categories View . . . Screenshot of Shop3D Product View . . . . Screenshot of WebGL Bookcase Experiment Screenshot of WebGL Bookcase Experiment
. . . . . . . . .
. . . . . . . . .
. . . . . . . . .
. . . . . . . . .
. . . . . . . . .
. . . . . . . . .
. . . . . . . . .
. . . . . . . . .
. . . . . . . . .
. . . . . . . . .
. . . . . . . . .
. . . . . . . . .
. . . . . . . . .
. . . . . . . . .
. . . . . . . . .
. . . . . . . . .
. . . . . . . . .
41 41 42 43 44 46 46 48 48
4.1 4.2 4.3 4.4 4.5 4.6 4.7 4.8 4.9 4.10 4.11 4.12 4.13 4.14 4.15 4.16 4.17 4.18 4.19
Original ColorViewCanvas example . . . . . . . . . Web service communcation . . . . . . . . . . . . . Component hierarchy of original ColorViewCanvas Component hierarchy of new ColorViewCanvas . . Web application architecture . . . . . . . . . . . . Screenshot of development installment . . . . . . . Screenshot of ColorViewCanvas example . . . . . . Screenshot of Balcony installment . . . . . . . . . . CSS renderer and WebGL renderer . . . . . . . . . Asynchronous search process diagram . . . . . . . Items in ball arrangement . . . . . . . . . . . . . . Items in helix arrangement . . . . . . . . . . . . . Items in surface arrangement . . . . . . . . . . . . DragSurface both Surface and Data mountain . . . Canvas based infinite wrapping . . . . . . . . . . . Calculating array coordinates within window . . . Calculating World coordinates for Item . . . . . . Visualization of camera frustum . . . . . . . . . . . Visualization of Viewport projection . . . . . . . .
. . . . . . . . . . . . . . . . . . .
. . . . . . . . . . . . . . . . . . .
. . . . . . . . . . . . . . . . . . .
. . . . . . . . . . . . . . . . . . .
. . . . . . . . . . . . . . . . . . .
. . . . . . . . . . . . . . . . . . .
. . . . . . . . . . . . . . . . . . .
. . . . . . . . . . . . . . . . . . .
. . . . . . . . . . . . . . . . . . .
. . . . . . . . . . . . . . . . . . .
. . . . . . . . . . . . . . . . . . .
. . . . . . . . . . . . . . . . . . .
. . . . . . . . . . . . . . . . . . .
51 53 57 58 60 60 61 61 67 70 74 74 75 76 81 83 84 85 85
vii
List of Figures
viii
4.20 Visualization artifacts . . . . . . . . . . . . . . . . . . . . . . . . . . . . . 87 C.1 Component diagram of ClayServer . . . . . . . . . . . . . . . . . . . . . . 103 C.2 Screenshot of the ClayServer UI . . . . . . . . . . . . . . . . . . . . . . . . 103
Listing 2.1 2.2 2.3 4.1 4.2 4.3 4.4 4.5 A.1 A.2 D.1 D.2
Instantiating person-object by Hash-notation . . . . . . . . . . . . . . . . 18 Creating a Person-class and instantiation by Hash-Function-notation . . . 19 Creating a Person-class and instantiation by Prototype-notation . . . . . 19 Extract of the response sent by the backend server on a search request. . 53 Example use of tween.js . . . . . . . . . . . . . . . . . . . . . . . . . . . . 71 Example of the use of history.js . . . . . . . . . . . . . . . . . . . . . . . . 79 Calculating intersection with XY-plane by using THREE.Ray class. . . . 86 Calculating intersection with XY-plane by using THREE.RayCaster class. 86 Example of HTML5 markup. . . . . . . . . . . . . . . . . . . . . . . . . . 101 Example of geometry definition in X3D . . . . . . . . . . . . . . . . . . . 101 Example of an XML request to receive a new random result set. . . . . . 104 Example of an XML request to receive a result set based on color and ID criteria. . . . . . . . . . . . . . . . . . . . . . . . . . . . . . . . . . . . . . 104 D.3 Example of an XML response by the backend. . . . . . . . . . . . . . . . . 104 E.1 Translate window from World coordinates to Array coordinates. . . . . . 105 E.2 Translate Slot coordinate to World coordinates within window. . . . . . . 106
ix
List of Tables 3.1 3.2
List of criteria . . . . . . . . . . . . . . . . . . . . . . . . . . . . . . . . . . 39 Table of browsers used for evaluation . . . . . . . . . . . . . . . . . . . . . 40
4.1
Table of additional meta fields
5.1 5.2
Table of browser performance . . . . . . . . . . . . . . . . . . . . . . . . . 93 List of fulfilled criteria . . . . . . . . . . . . . . . . . . . . . . . . . . . . . 94
. . . . . . . . . . . . . . . . . . . . . . . . 55
x
Abbreviations AI
Artificial Intelligence
AJAX
Asynchronous JavaScript And XML
API
Application Programming Interface
B2B
Business to Business
B2C
Business to Customer
CBR
Content Based Retrieval
CDN
Content Delivery Network
CSS
Cascading Style Sheets
DoF
Degrees of Freedom
DOM
Document Object Model
ECMA
European Computer Manufacturers Associations
ERP
Enterprise Resource Planning
FOV
Field Of View
fps
Frames Per Second
GPU
Graphics Processing Unit
HCI
Human Computer Interface
HTML
Hyper Text Markup Language
HTTP
Hyper Text Transfer Protocol
HUD
Head Up Display
IRVE
Information-rich Virtual Environment
ID
Idendifier
JS
JavaScript
JSON
JavaScript Object Notation
MVC
Model- View Controller
OS
Open Source xi
Abbreviations
xii
OS
Operating System
POI
Point Of Interest
REST
REpresentationial State Transfer
SEO
Search Engine Optimization
SOA
Service Oriented Application
SFOV
Software Field Of View
SVG
Scalable Vector Graphic
UI
User Interface
URL
Uniform Resource Locator
UX
User Experience
VE
Virtual Environment
VR
Virtual Reality
VRML
Virtual Reality Markup Language
W3C
World Wide Web Consortium
WASD
W forward, A left, S back, D right
WWW
World Wide Web
XML
eXtensible Markup Language
Chapter 1
Introduction 1.1
Outline
The browser has developed from a simple document viewer to a runtime environment. HTML5 specifies a multitude of programming APIs supporting cross-platform application development. With the specification and release of WebGL, a common 3D API emerged with support for hardware-accelerated graphics in the browser. The idea of using 3D to provide interactive Virtual Environments has been proposed for years. Especially in the context of e-commerce, Virtual Reality was seen as the technology with the potential of finally bringing the same shopping experience known from conventional stores into the browser. Systems have been developed, but failed to gain attention and vanished. This thesis proposes a different approach of using 3D environments in a web store, without exploiting the metaphor of a Virtual Store and instead focusing on a close integration of the product data visualization in 3D space with the actual shop website. A software will be developed for experimentation with various data arrangements and interaction controls. The hypothesis formulated for this implementation is that the created 3D environment could be more effective in providing overview and insight, than a conventional 2D representation of the same dataset. Chapter 2 will provide all background information and basics required for this thesis. It will lay the ground about e-commerce, Virtual Reality and the related metaphors as well as the technologies deployed. The goal for the software implementation will be set in Chapter 3. It defines the framework and the requirements. It formulates taxonomies of use and actions for the Web and web shops and the resulting navigation concepts for product catalogs and data in 3D. 1
Chapter 1. Introduction
2
Previous implementations are discussed in 3.4. Lastly the project to be implemented is specified. The actual implementation is detailed in Chapter 4. The basic system architecture is explained, the system’s foundations and its dependencies. Navigation concepts theorized in the requirements are implemented. Explanations on the use of visualization and interaction in Virtual environments in the hypertext-media Web are provided. Chapter 5 provides the final project evaluation and an assessment against the requirements set in 3.3.6. This chapter evaluates the technologies deployed, the potential in future development and provides insight into note-worthy aspects of the thesis. A conclusive summery is given in Chapter 6.
1.2
Motivation
Ever since the WebGL specification was released, I was curious about the potential the new technology holds for the Web. For two years I build several prototypes to assess the maturity of frameworks and in early 2012 I found an inspiring eco-system with excellent reference implementations. For my masters thesis, I wanted to capture the current state of technology as it matures - not yet widespread enough for production use, but stable for quick prototyping and on the verge of bringing new opportunities besides tech demos, games and music videos. The topic of this thesis was developed with Prof. Dr. Kai-Uwe Barthel and gave an opportunity to apply the new technology in a new context: online e-commerce solutions with three-dimensional elements integrated with the website. So far the focus of research in web-based Virtual environments mostly focused on Virtual Reality solutions and did not include the search for user interaction techniques that are optimal for the hypertextmedia Web. The first goal of this thesis was to provide a critical analysis on the failure of Virtual Reality solutions, as scientific literature omitted this subject so far. Instead solutions should be provided to counteract the loss of hypertext functionality of prior implementations. The second goal became the development of an alternative shop frontend featuring navigation through three-dimensional visualizations. While it would be opinionated to compete with established shop user interfaces that developed best-practices for 10 years, it was interesting to assess potential for using the new technology in visualization and data organization of online shops provided today.
Chapter 2
Background information 2.1 2.1.1
e-commerce Definition
Commerce is defined by Chan, Lee and Chang (2001) as a basic economic activity involving trading or the buying and selling of goods. These commercial transactions and business functions can be carried out electronically. E-commerce is about the sale and purchase of goods or services by electronic means, particularly over the Internet or the World Wide Web. [1]
Figure 2.1: Types of commerce [1]
As illustrated in 2.1 e-commerce can be defined as a subset of e-business, however a clear separation of definitions has been proven difficult. [2] E-commerce can be divided into business-focused commerce (Business-to-Business (B2B)) and consumer-focused commerce (Business-to-Customer (B2C)). 3
Chapter 2. Background information
4
Different models were proposed to describe the different aspects of e-commerce. Chan, Lee and Chang (2001) provide the following functional layers, originally based on the three-layer model by Zwass (2000).
Technical infrastructure The Internet and the World Wide Web as communication infrastructure. Secure messaging services Protocols for data communication. Supporting services Payment options, purchase processing and delivery. Commercial products, services and systems The actual goods to sell. Electronic marketplace The platform on which the goods are marketed and sold.
Of these features only technical infrastructure and electronic market place are in focus of this thesis, as these concern the technical foundation and representation of the online shop. Chan describe the online shop as a three-tier system model involving the User interface, Service system, and Backend system. The User Interface is the web site visited by the customer and main topic of this paper. [1] E-commerce is not only characterized by purchase and financial transaction, but also by customer interaction such as information gathering or information requests. [3] Taxonomy of the web and of e-commerce stores in particular will be analyzed in 3.2. For a company creating new e-commerce stores it is required to transform the business to the new media, rather than translate it. New business strategies need to be adopted. The customer’s expectations of the media have to be recognized and dealt with to create a successful web shop. Successful by leveraging the strengths of the media and being intuitively understood by the users. This transformation brought forth a generation of 2D based web stores heavily influenced by the hypertext paradigm the World Wide Web centers around. [1] 3D based solutions have been proposed in academics and tried in real life, but did not establish itself for various reasons that will be elaborated in 2.3.1 and 3.2.4
2.1.2
e-commerce in WWW
The core of the shop is the backend system dealing with combining all infrastructure for data stock management, purchase, payment, delivery, transaction handling and customer-relationship-management. The focus of this thesis is on the frontend representation - the user interface to the customer. Customers can search for products
Chapter 2. Background information
5
without limitations across borders and independent of opening time. By using search engines or search agents, consumers can easily compare products across shops, to find the best offers. Competition is hard and it is important to stand out and build a good reputation. A good user interface, that is enjoyable to use, visually appealing and quick to navigate is essential. Presenting the products, classifying and visualizing the relationship between products are ways to help the users explore the items in the shop and engage with the brand. [1] [2] Over the past decade, web-based retail shops have been well-established and a large set of best-practices developed around the hypertext paradigm of the World Wide Web. The contents of the web shop are delivered by the server as a structured HTML document, styled with Cascading Style Sheets (CSS) with additional interactivity through JavaScript and viewed in a web browser by the user. These is the same basic recipe for all websites. More about the basic technologies of the Web in 2.4. These technologies define how the users receive the website, how they interact and navigate with it through the products, how they can search, browse, compare and filter to find what they are looking for. The interface helps or hinders in their tasks. Common taxonomies of customers in web shops are later defined in 3.2.1. The typical example is a B2C e-commerce store in which a business sells already manufactured products to the consumers directly on the Web. To facilitate customers’ ease of use of the web shop a common interface paradigm for shop websites was established. Shop items are categorized in hierarchical categories. Users can either click through categories, until they find the series of items they are looking for or they are offered a search to quickly jump to the suggested results. Categories or search results are presented either as a list or table. Layout, styling as well as sort and filter criteria vary significantly depending on the shop implementation. [1] The product list is usually containing at least the product name, price, preview and a hyperlink opening a product page for each item. This detail page contains all meta information, description, technical specifications, seller information, additional illustrations, semantical data like related items and social elements like comments, ratings and reviews. On this page the item can be added to the shopping cart or the bookmark list. The actual checkout is handled from the shopping cart view, which lists all items to purchase. This default setup is used throughout the Web by major retailing websites like amazon 1 or ebay 2 as well as most e-commerce shop solutions. 1 2
Website of amazon.com: http://www.amazon.com Website of ebay.com: http://www.ebay.com
Chapter 2. Background information
6
Figure 2.2: Screenshots of the search results view of amazon.com and ebay.com
2.2 2.2.1
Visualization Graphical data representation
Visualization is a technique for communication of information through graphical representation. Graphical representation of abstract data can be processed and interpreted quicker by the human brain than textual representation. It allows for a different perspective on data, is more descriptive than word-based alternatives and is independent of language. [4] Visualization is also the process of mapping information to visual properties. Generally speaking, it is a technique for generating images, diagrams or animations based on structured data with the purpose of interpretation, exploration and analysis. [5] Abstract properties are spatially represented and projected into perceptual qualities (e.g. shape, color size, motion, . . . ) and can reveal trends (e.g. spatial groupings, clusters) not visible in the original data set. [6] Good visualization follows certain rules first defined by E. R. Tufte. Next to general Gestalt-laws and the basics of sensory interpretation, Tufte defined the Principles of Graphical Excellence, which are most interesting in regards to aesthetics and comprehension in the scope of this thesis. [7] Graphical excellence defines well-designing the presentation of interesting data. Finding the right visualization based on substance, statistics and design. Finding the best way to communicate complex ideas with clarity, precision and efficiency. [7] Graphical excellence is which gives to the viewer, the greatest number of ideas in the shortest time with the least ink in the smallest place. (Tufte, 1983) [7] Representing multidimensional data sets in static images is difficult and inflexible. Visualization is not only the aspect of generating graphics, but also includes interface design to allow interaction with the data. The definitions of Graphical Excellence can also be applied to user interfaces, relating to the complexity, ease-of-use and quality of representation, in order to empower the user to explore the data and engage the audience to discover meaning. [5] In a well-crafted interface, with the right balance of visual appeal
Chapter 2. Background information
7
and pragmatic functionality, data exploration can feel like playing a game and thus even embrace audiences not accustomed to complex visualization. Graphical representation of data is a wide topic as different kinds of data require different approaches of visualization. Any domain can profit from visualization to assist analysis and communication. The topic of this thesis is not about visualization of mathematical, statistical or scientific data, but about data from multidimensional product catalogs. A finite set of items, interconnected by similarity across multiple dimensions, possibly within a categorization tree. Visualizing this data set is not for the purpose of scientific comparison, but rather to give customers a quick and valuable way of browsing through the catalog, finding relations and patterns in the data and accessing the products on multiple levels of detail. All this together with an enjoyable user experience. Various ways of representing product data have been proposed. Most common, as elaborated in the previous section, are tabular and list views with an illustration of the product and selected meta data. These visualizations map the relevance of the items based on a set of criteria (search query, order). Excluding the possibilities of displaying the product itself as a 3D model, product visualization becomes interesting by mapping the relationships between products. Relations in the sense of data similarity or by semantical mappings like the paradigm people, who bought this, also bought that. Speaking about the use of 3D in visualization in this paper, usually refers to 2D perspective projections of 3D environments displayed on a monocular screen. These 2D projections may also include other pictorial depth cues such as shading etc.
2.2.2
Spatial data visualization
Having the availability of a three-dimensional environment, it is valuable to look at the potential advantages of data visualizations within this space. A topic of research addresses how spatial positioning affects the cognitive process and the ability to navigate and interact in spatially organized data and what effect it has on memory recollection. Experiments by Tavanti and Lind (2001) established that processing spatial locations of objects in reality is an effortless and unintentional process and can therefore be categorized within Preattentive Sensory Processing. [8] Cockburn wrote several studies in 2002-2004 on the benefits of leveraging the human’s ability for Spatial memory in document organization. He argues, that with a good user interface, 3D is a valuable feature. To what extend Spatial memory is used in the performance depends on the given task, the graphics rendering and the structure of the data displayed in the studies. Users were given the task for sorting and organizing documents in various three-dimensional
Chapter 2. Background information
8
spaces (free 3D, constraint, data mountain). The study and its re-evaluation months later showed, that spatial organization alone is not helpful and needs to be combined with semantic labeling for structuring effects. However, due to the evaluation cost, the described effort to organize and find the bookmarks, the location was learned better and was easier found on the retrial months later. Cockburn describes Spatial memory as one aspect among many to promote spatial 3D data organization. Study participants were quoted preferring the cool looks. [9] [10] Tavanti and Lind (2001) describes three-dimensional representations as abstract and unintuitive in that they require the user to learn certain conventions for interaction. 3D offers room for better representation of hierarchically structured data. By arranging icons in 3D space, this can form visible clusters and display the connectedness of the data. This can be particularly exploited with large data sets, where the subject can gain a better global view on the data. This can enhance the user’s spatial performance, but it remains difficult to comprehend patterns in 3D. Tavanti attributes a significant role to Spatial memory in the performance of information storage and retrieval. This is in disagreement to Cockburn, who attributes the enhanced performance not to Spatial memory, but to the additional effort of organizing data in 3D space by the subject. [8] Other studies come to the conclusion, that 3D has no effect on the effectiveness of Spatial memory when used with monocular static displays. Using three-dimensional display setups, subjects would leverage 3D, to get a better feeling of the depth within the 3D scene, as head movement influences the line of sight. This however does not imply, that Spatial memory can be applied for 2D and 3D displays. There has been no conclusive work comparing between different qualities of 3D representation and how realistic 3D graphics influence the performance of Spatial memory. [10] Lastly, it has been argued by Polys, Kim and Bowman (2005), that Spatial data organization can hurt comparison tasks (especially those on spatial criteria), as they may suffer under visual distortion. [11]
2.3
3D User Interfaces
Within the field of human-computer-interaction, 3D user interfaces have always been topic of research. This includes a wide array of research areas not only including 3D graphics and interaction, but also research on input/output devices and interaction design. The success of User Interfaces (UI) and User Experience (UX) depends on those fields acting in concert, leveraging technology and cognition research. [12] Every UI is designed within the constraints of the requirements by hardware, software and
Chapter 2. Background information
9
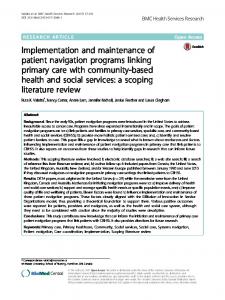
other stakeholders. The scope of this thesis is limited to the visual and navigational aspects for data display in three-dimensional environments, particular on the Web. The design relies on two-dimensional projection of a three-dimensional environment on a 2D monocular display. Although a variety of 3D input devices can be used, the setup assumes common pointing devices such as 2D mouse, touch-pad or touch-screen. Also excluded from the scope of this thesis is the use of other multimedia elements like 3D sound. On the subject of 3D UIs, only limited research has been done, that is not related to Virtual Reality, the simulation of an interactive reality in a 3D environment. However, only because the user interaction is within a three-dimensional spatial context, does not automatically imply the use of Virtual Reality. For a long time, games have been in the fore-front of graphical evolution and testing UI concepts in practice. Informationrich Virtual Environments are one approach to combine 3D interfaces with other data visualization and management techniques. This paper tries to work out how different approaches to the use of 3D environments may open new opportunities in user interface design, in particular for the Web. 3D UIs are based on the combination of 2D and 3D UI elements within the environment. Polys characterizes different Layout Spaces, in which text and images are placed. [11] In our focus, Object space and Viewport space are relevant. Object space describes the local coordinate system of an object in the 3D scene. UI elements, widgets or annotations in Object space are displayed in relation to this object within the 3D environment. Viewport space displays these UI elements on a plane infront of the viewport outside the 3D space. It appears overlayed on top of the virtual world’s projection. Also called Heads-Up-Display (HUD), these widgets are always visible regardless of the user’s position and view orientation in the 3D space. Both Object and Viewport space are interesting in our observation, because these are embedded within the layout of the website. [11] Optimal use of each space for UI depends on the actual visualization and its interaction. Both spaces can provide strong association cues in Gestalt law terms.
Figure 2.3: The example shows an interactive molecule visualization. Left attaches labels in Object space, right displays labels in Viewport space. (Source: [11])
Chapter 2. Background information
10
The viewport is the camera into the 3D environment. This camera can be orthographic or perspective in nature. As the viewport is limited by the dimension of the display screen, the Field Of View (FOV) is essential. For desktop displays we can describe at least two important types of FOVs:
Display Field Of View DFOV is the FOV a user has in front of the display. This is defined by the number of screens, placement, sizes and the seating position of the user. Software Field of View SFOV describes the view angle of the camera in the virtual environment.
In the remainder of the paper whenever it is talked about FOV, SFOV is what is refered to. Little research on the effects of SFOV in virtual environments has been done, however, studies showed users were experimenting with SFOV settings and using SFOV as a means of detail zoom, if given the possibility in the user interface. [11]
2.3.1
Virtual Reality
In academics, the most research in regards of 3D user interfaces has been done in relation to Virtual Reality. [12] Virtual Reality defines a digital interactive 3D scene, in which the user becomes a part. A 3D world is displayed on conventional 2D screen without the need for additional equipment. More elaborate Virtual Reality setups are possible, but not discussed in the scope of this thesis. Movement in the virtual environment is performed by interactive means mapped to default input devices such as mouse and keyboard. [3] Aukstakalnis and Blatner (Aukstakalnis et al., 1992) define Virtual Reality: Virtual Reality is a way for humans to visualize, manipulate and interact with computers and extremely complex data.” [13] Sherman and Judkins (Sherman et al., 1992) give the defintion: VR allows you to explore a computer generated world by actually being in it. [14] Uses of Virtual Reality were proposed in many contexts such as e-learning, interactive museums, architecture, historical recreation and e-commerce. The latter being the focus of this thesis by analyzing implementations of Virtual Stores (VS). By Virtual Store, this paper refers to e-commerce stores based on a virtual representation of a traditional convenience store, market or a shopping mall. This can either
Chapter 2. Background information
11
be an interface for actual Business-to-Customer e-commerce or a tool for market research, where virtual stores are used for store layout optimization and evaluation by test subjects. [15] The claim Virtual Stores and avatar-based Virtual Reality as the next logical step in Web-based e-commerce can be found in scientific literature dating back into the mid1990s. [16] [3] [17] [18] The common assumption is, that realistic 3D representations would allow for more direct connections between the information environment and its electronic representation. In case of Virtual Stores, the metaphor of a store would be used to transport the abstract product information by drawing on the experience and expectations users have from conventional stores. 3D spaces are designed with cues to trigger natural cognition and actions performed in a Virtual Store. In order to minimize training for two-dimensional handling, special attention to navigation and steering is important. [8] Many ways are described, in how B2B e-commerce could benefit from the use of Virtual Stores. [3] First and foremost is the store metaphor, that implies a shopping experience close to real world shopping to create familiarity to the customer. The interaction possible in the VS also extends this, by providing the same actions like walking, looking, taking and turning objects. This would give the customers actually the chance to view and try products online, thereby increasing the chance of successful purchases. [3] Capturing the users’ attention and keeping them immersed and engaged in the shop experience is the general goal. By integrating multi-user interaction, even social needs among other emotional needs like immersion and interaction - could be provided. [18] Gaining customers confidence was studied by Papadopoulou in 2007. Trust was defined as the combination of benevolence, competence, integrity and predictability of the evendor. Empirical studies showed increased trust by subjects in the store on use of social elements in the VR environment, however it was not explained why the proposed techniques increased trust gain. [19] Later studies build similar conclusions, that Virtual Reality shops increase shop reputation, but miss empirical evidence entirely or do not construct a generalized theory. [20] [16] Opposite to the benefits is a series of disadvantages cited for Virtual Stores. [3] Designing and constructing Virtual Stores requires additional expenses in development, content production, marketing and maintenance. Additional work is required to create the store environment and the visual representations of the offered product. Support for authorship of Virtual Reality across disciplines comes short on the limitations of current software, variety of file formats and platform dependencies. Lastly, not every kind of
Chapter 2. Background information
12
product is suitable for this kind of representation. Systems have been proposed to create a declarative or generative approach for managing the store configuration. [18] Another detrimental factor is the quality expectation of the user of a Virtual Shop implementation. Accustomed to realistic high-end graphics in computer and console games, shop developers have to ensure high visual appeal and realism in the implementation. This is a problem many implemented shops have, which makes them look sterile, unappealing, uninteresting and quickly out-of-date. [12] Virtual Stores also have several unique technical requirements implementations failed to take into account. The runtime environment of the 3D interface has been a big issue, requiring support for multiple platforms and operating systems. Until the specification of WebGL, which will be discussed in 2.4.5, there was no way of displaying GPU-accelerated 3D graphics in the browser without third-party plugins like Flash or Unity3D. Availability of these plugins can not be assumed, which makes the web shop unavailable to large groups of customers or requires the implementation of alternative fallback solutions. The way plugins integrate in the website is also a problem, because they create their own runtime environment outside of the context of the web page. The website has the 3D scene embedded via the plugin, but its content is isolated and neither the website can interact with the contents of the 3D environment, nor can the 3D environment access the website. By this isolation several usability issues arise, which break the common user experience of the web. [21] This issue will be discussed in more detail in 3.2.4. Virtual Stores try to leverage the store metaphor, but fail to account for requirements and best-practices of the medium they are presented in. Hughes, Brusilovsky and Lewis (2002) describe this by saying that the benefits of the familiarity to physical stores only go so forth, as the advantages of the hypermedia (data aggregation abilities and rapid information retrieval) are affordable. [17] The Internet as a hypertext media has afforded the user new non-linear ways of data presentation and interaction. Hyperlinks and the ability to search in documents have allowed for new taxonomies, formerly unknown. The ability to share links to contents, copy and save texts and images, to open several manifestations of the website next to each other are just a few examples, on the freedoms users have gained through hypermedia. More details on the web taxonomies will be discussed in Chapter 3 in 3.2.1. With every interactive Virtual environment, steering and movement of the camera and navigation in the scene are important subjects. Locomotion is the task of controlling the degrees of freedom (DoF) a camera has within the 3D environment. The goal is to map user interaction from the input devices to a sensible steering mechanism in the scene by
Chapter 2. Background information
13
providing defined constraints to camera movement. The balance is to provide the user enough freedom to move freely, while ensuring the user does not get lost. Moerman, Marchal and Grisoni (2012) defined context-sensitive and context-insensitive approaches in Locomotion. [22] Navigation concepts such as Attentive Navigation have been developed to help direct the users’ attention to features within predefined structures and to ease complexity of use on the customer. An example of such a feature being an item in a virtual room. This is a context-sensitive approach targeted to give the optimal viewing experience by directing the attention of the user. This is achieved by several means. Direct guidance offers the user purposeful sensible linear camera paths through a scene. Hiding and Sorting limit the navigation options to a subset of navigation choices and help the user to navigate through a scene quickly. Annotations are recommended navigation paths, that give a good default experience. Attentive Navigation is derived from Constrained Navigation. [17] While Virtual Reality has been a subject for research for a long time and practical examples have been tried frequently, it has not caught wide-spread usage. Bowman et al. (2008) summarized, that it is not yet mature enough for productive application. [12] Implementations mostly remained research prototypes or tech demos, as will be shown in 3.4. The basic technology for creating Virtual Realities and Virtual Stores in particular exists and improves, but the appliances often lacked the correct requirements analysis of what users expect and need from such a system to be meaningful and practical.
2.3.2
Skeuomorphism
Originally Skeuomorphism describes the result of faking surfaces to appear more sophisticated by simulating the appearance of more valuable material. At the writing of this thesis, in computer science the term has been adopted to describe the process of adapting visual and functional properties of real-life objects into their digital counterparts. Creating user interfaces on metaphors outside of computer science is a common process. These metaphors not only apply to certain features, but also to UI layout and designs. The metaphors can be distinguished in visual metaphors who call back on familarity to create a visual analogy while behavioral metaphors actually simulate behavior of the original object or process. Figure 2.4 shows two calculators. Both skeuomorphic, as both call back on the default calculator layout established in the industry. The arrangement of the buttons may be pragmatic to the users, as they are accustomed to the layout. The basic principle of typing the digits on a digital key board in a volatile text field only simulates the best that could be done on physical calculators several years ago.
Chapter 2. Background information
14
However, it does not represent the best interface that could be done on a digital screen on the computer. This is a small example, where left-overs from a metaphor do not translate on a new media and thereby prohibiting better usability.
Figure 2.4: Button layout of a calculator application simulating the interface of a conventional calculator. The layout itself is skeuomorphic, not just the visual style. (Source: [23]
Skeuomorphic designs tend to look realistic to make the connection with the original object clear and give the user easy recognition of the metaphor and a sense of familiarity as visual metaphor. The other way around, realistic designs tend to be skeuomorphic as realism would otherwise look out of place. Realism describes the visual quality and appeal of the simulated metaphor. [23] This is a design trend pushed in recent years by Apple and the introduction of the iPhone, whose applications apply skeuomorphism throughout the operating system. Skeuomorphisms does not need to be limited to visual features. For example, smartphones play pre-recorded shutter noises reminiscent of photo cameras. While the metaphors are easy to recognize, they are not without problems. As shortly explained on the example of the calculator, the original metaphor is translated to a new media, without optimization for this new media at hand. Often the metaphor was used for its inherit simplicity without recognizing, that the simplification does not apply on the new media. A famous examples is the calendar application shown in Figure 2.5 that features torn paper and metal rings, thereby calling back to calender books. In design terms, it may look appealing treating one medium (Digital computer), like another (leather handbook). Making something appear like a physical object without addressing the unique properties of the device is at best a lost opportunity, at worst harmful to usability as wrong expectations are created, which are not fulfilled and distract the user from the main content. It is a lost opportunity in that a literal translation keeps the limitations of previous implementations without reason. [23] With the release of Microsoft’s mobile operating system Windows Phone 7 and the introduction of their design approach called Modern UI (formerly Metro UI, renamed after legal issues) illustrated in Figure 2.6, a counter-movement to the stylistic design approach of Skeuopmorphism was identified. Flat style loses shadows, gradients and surface textures to simulate a minimalistic instead of realistic look. This design approach
Chapter 2. Background information
15
Figure 2.5: Screenshot shows iOS calendar app. Leather and paper surface textures display skeuomorphic attempt to leverage the behavioral metaphor of physical calendar books.
embraces visual minimalism, losing textures and lighting effects for simple shapes and flat colors. Taking minimalism too far can also have consequences on usability. Clues need to be given in the user interface for users to recognize certain behavior: for example buttons having a slight gradient and rounded corners to imply pushing them. [23] Interestingly, although the design and user experiences loses many established metaphors, by calling the surfaces on their Application launcher Tiles, Microsoft still calls back to visual metaphors, though they do not simulate behavor.
Figure 2.6: Launcher tiles of the Windows 8 Modern UI design.
The idea behind Modern UI is to embrace digital, to work out advantages of this media and to develop new user experiences focusing on these strengths of being digital and not based on real-life experience. Both the skeuomorphic approach and the flat-pixel approach have the same goal of delivering a user interface, that is intuitive to the user and communicates its functionality in a coherent and relatable model. [24]
Chapter 2. Background information
16
The relation to Virtual Reality is, that in Virtual Stores a behavioral metaphor is used in a skeuomorphic way. A conventional store is simulated in a new media, to leverage known experiences and presumably intuitive functionality. This metaphor fails to account, that the media Web3D, has different affordances as a simple translation of a conventional store into 3D and fails to deliver these new demands. What is required is a transformation of the store to suit the new media. A transformation, that so far resulted in the bestpractice shop solution found in the Web everywhere. This does not mean, that 3D does not bear potential to be applied for online stores, but the approach to leverage this potential needs to be different. Following the flat-pixel counter movement, may be one way to approach the subject.
2.3.3
Information-rich Virtual Environments
While this thesis addresses the topics of spatial data visualization and interaction, it does not take into account the even larger field of Information-rich Virtual Environments (IRVEs). IRVEs are defined as an integration of spatial, abstract and temporal information for the purpose of generating insights into complex multi-scale relationships in heterogeneous data by visualization and exploration. This is achieved by combining the capabilities of virtual environments and information visualization. IRVEs are concerned with information design and interaction techniques for the purpose of enabling independent navigation and comprehension of different types of data. The goal is to provide an intuitive and comprehensive way for users to interact and operate with complex data, spatial objects, their spatial properties and relations after minimal training. [25] [11] Whether this definition of an IRVE can be applied to 3D shop solutions such as the one implemented in this thesis, will be discussed in the Evaluation 5.2.3. Another definition provided by Chen, Pyla and Bowman (2004) describe IRVEs as a Virtual Environment enhanced by the integration of abstract information. This definition is much closer to the Virtual Reality approach discussed above. [26]
2.4
Technologies
So far, e-commerce, implementations of web shops in 3D environments and the use of the store metaphor have been explained. To evaluate the state of 3D user interfaces for item visualization a web application will be developed in this thesis to show-case proposed navigation concepts with state-of-the-art web technologies. The following sections will provide an introduction into the basic technologies deployed.
Chapter 2. Background information
2.4.1
17
HTML
The World Wide Web is a system of interconnected hypertext documents on the Internet. The Web browser (client) communicates with web servers over protocols such as HTTP, requesting and receiving documents. The response contains the website, is processed and displayed by the web browser. Every website is addressed by a unique URL (Unified Resource Locator), indicating the protocol, domain resource and path. [5] The delivered website is written in the Hypertext Markup Language (HTML). HTML is the common markup language for web publishing. Content is hierarchically structured and given semantic meaning, the web browser can parse accordingly. [5] [27] HTML is specified and maintained by the W3C 3 , the current specification is coined under the label HTML5 which defines multiple new modules with functionality to be implemented by the web client, functionality integrated in the Document Object Model. [28] HTML itself only supports the description of text and simple, box-shaped 2D graphics including images and generative graphics. External resources like videos and sounds can be embedded. HTML only serves to structure the content, visual styling is done using CSS, as explained in 2.4.3. Adding interactivity to the static document is possible using the JavaScript scripting language, that will be introduced in 2.4.2. For an example of HTML markup, see Listing A.1 in Appendix A. The Document Object Model (DOM) is the hierarchical structure of the document based on the HTML markup. Its representation is a tree structure that describes relationships between elements of the HTML structure (parent, child, sibling, ancestor and descendant). Its primary use is to address elements in the website, to apply styles and actions. The DOM provides access to the document, to the structural representation of the website and to programing interfaces (APIs) in the browser defined in the official HTML specifications. This API can be accessed by programming JavaScript and thereby enabling the developer to modify its visual presentation of the website, as well as accessing high-level features like offline LocalStorage, History/State APIs, Drag-n-Drop and hardware-accelerated 3D, as detailed in 2.4.5. [5]
2.4.2
JavaScript
JavaScript is an interpreted scripting language, designed to be cross-platform, lightweight and to be embedded in host applications, such as web browsers. It was first developed to add interaction for static HTML websites by enabling to manipulate the sites DOM, but has since grown in capabilities, performance and importance. JavaScript 3
Website of W3C: http://www.w3.org/
Chapter 2. Background information
18
is an implementation of the specification of ECMAScript (in its current version 5.1 as of 2012) by ECMA4 . The language has no standard library, few core objects (e.g. Array, Date or Math) and only the context in which JavaScript is executed defines the richness of its API. [29] Not taking into account JavaScript as an embedded language in various other types of applications, JS for the Web is executed in two contexts: [29]
Client-side JavaScript is embedded in the browser and is executed in the context of a website. Server-side JavaScript is run in the context of a server-based runtime environment such as node.js 5 .
The development of node.js and the use of AJAX are milestones showing JavaScript’s grown significance beyond enabling simple interactivity of websites. It has become one of the most important scripting languages for UI design. Though node.js is a significant new approach and now allows for JS to be run client and server side, but neither has this has a big influence on the standing of JS as a scripting language for the web in general, nor is it the most prominent server side scripting language.] As it was designed as a light-weight, event-based functional language, its strength are in scalability, eventmanagement and parallelization. JavaScript is not typesafe and only defined few primitive data types are implemented. Among them String, Object, Array, Function, Number and Boolean. Objects are always associative arrays in JavaScript, in this paper the term Hash is often used synonymously. Custom Objects can be constructed in various ways either by defining classes, or by static initialization. [30] [29] All kinds of objects are open, properties can be changed and new members can be created dynamically during runtime. 1
var person1 = { name : " Stan " , sayHello : function () { alert (" Hello , I ' m "+ this . name ) ; }
5
}; person1 . sayHello () ; // = > " Hello , I ' m Stan " var person2 = new Object () ; // or just {} person2 . name = " Shelly "; 10
person2 . sayHello = function () { alert ( this . name ) }; person2 . sayHello () ; // = > " Hello , I ' m Shelly "
Listing 2.1: Instantiating person-object by Hash-notation 4 5
Website of ECMA: http://www.ecma-international.org/ Website of node.js: http://nodejs.org/
Chapter 2. Background information
19
Objects created using Hash-notation (also called Object-literal) are static. Listing 2.1 instantiates two new associative array with the fields name and the function sayHello. This object exists only once and features no further abstraction. This notation is the basis for the JSON -data format. Based on a similar notation, the object instantiation can be generalized by wrapping the Hash within a constructor function, as shown in Listing 2.2. 1
var Person = function ( name ) { return { name : name , sayHello : function () { alert (" Hello , I ' m "+ this . name ) ;
5
} }; } var person3 = new Person (" Kyle ") ; 10
var person4 = new Person (" Eric ") ; person3 . sayHello () ; // = > " Hello , I ' m Kyle " person4 . sayHello () ; // = > " Hello , I ' m Eric "
Listing 2.2: Creating a Person-class and instantiation by Hash-Function-notation
Strictly speaking JavaScript has no classes, however class-like object templates can be created using constructor function. The wrapping function serves as a constructor function and returns the instantiated Hash-object. Calling the new operator creates a new Object in whose context the constructor function is executed. In the constructor new properties can be added to this context using the keyword this. This allows to create multiple instances based on the same definition. The second way to construct classes and objects in JavaScript is based on Prototype classes and does not feature a classical inheritance model. An example for this notation is given in Listing 2.3. 1
function Person ( name ) { this . name = name ; } Person . prototype . sayHello = function () { alert (" Hello , I ' m "+ this . name ) ;
5
}; var person5 = new Person (" Butters ") ; person5 . sayHello () // = > " Hello , I ' m Butters "
Listing 2.3: Creating a Person-class and instantiation by Prototype-notation
Prototype-based objects are more powerful than Hash-based objects, as prototyping allows for simple inheritance and polymorphism.
Chapter 2. Background information
20
Client-side JavaScript is executed in the web browser in the context of a website. This context includes the DOM of the website, as explained in 2.4.1. It can be used to manipulate the website, add interactivity and create rich client-side web applications like the one proposed in this thesis.
2.4.3
CSS
As HTML is to give hierarchical structure and semantic meaning to the contents of a website, Cascading Style Sheets (CSS) is designed to define the visual representation of the contents. The aim is to separate content and visual representation. [5] CSS is a plaintext file format for the visual definition of rendering behavior of DOM elements. CSS definitions consists of selectors and properties. Selectors are rules to address HTML elements in the DOM. Properties define the styles to be applied on these elements. Styling includes colors, font styling, position and layout arrangement as well as limited behavioral characteristics. [5] CSS is specified in different version, the current version being CSS3. The CSS3 specification is still in a state of development with many modular extension still being modified. Experimental modules may already be implemented by individual browsers, but can only be applied by using prefixed-properties. Particularly interesting for this thesis is the module CSS3-transforms 6 . CSS-transforms is a way of transforming HTML elements in a three-dimensional space using CSS. This has been introduced in the CSS3 specification, is implemented in the rendering engines of Webkit (Chrome, Safari) and Gecko (Mozilla Firefox) and thus gained a certain degree of distribution on multiple browsers across platforms and devices. The quality of the implementation however varies, performance depends on the implementation of OpenGL in the browser and its use of hardware GPU-acceleration. [28] [31] By applying CSS3-transformations on HTML DOM elements, these can be transformed in a two-dimensional and three-dimensional coordinate system, while retaining all other style features defined with CSS. Note, that the elements themselves are not converted into three-dimensional objects, but exist on a two-dimensional plane (a flat surface) and thus have no depth.
2.4.4
Web3D
Three-dimensional graphics integrated in websites has been a topic for a long time. Having interactive 3D has a lot of potential for interactive visualization and games. For 6
Latest specification of CSS3-transforms: http://www.w3.org/TR/css3-transforms/
Chapter 2. Background information
21
many reasons, the proposed technologies have not caught wide support. This section will give an overview on the classification of the technologies and the short-comings they inhibited. Web3D in the general term for three-dimensional graphics in the Web. It comprises both programming or descriptive languages enabling interactive 3D content. This includes 3D modeling languages (VRML, X3D), closed proprietary APIs (Flash, Silverlight, Java3D, Unity3D) and standardized open APIs (WebGL). [32] The computational power and communication bandwidth needed to generate and support navigation and interaction in web-based 3D environments has become affordable in current hardware and software technology, even for mobile devices. The effectiveness and performance of such representations still needs to be balanced to support the largest range of devices. [33] Compatibility and spread of plugins is still a topic, as standardized interfaces to 3D have only recently been released or are in development. For more on the subject of cross-platform compatibility see the requirements defined in 3.3.4. Web3D is classified into two distinct approaches to generate 3D graphics in the browser. The declarative approach and the API-driven imperative approach. Figure 2.7 shows an illustration by the Declarative 3D for the Web Architecture Community Group classifying the available graphics technologies in relation to each other.
Figure tion to
2.7: other
Declarative and 2D/3D graphics
Imperative technologies
3D of
in the
relaWeb.
(Source: http://www.w3.org/community/declarative3d/wiki/Main Page)
Declarative 3D The declarative approach is having a static interpreted declaration of the 3D environment, interaction and visual representations.
Chapter 2. Background information
22
Imperative 3D The imperative approach features a programming interface to render complex 2D and 3D graphics. This API can be accessed by scripting languages such as JavaScript.
Sons, Klein, Rubinstein, Byelozyorov and Slusallek (2010) describe the imperative and the declarative approach as orthogonal to each other, as both paradigms serve a different purpose. [28] Imperative 3D will be discussed in more detail in 2.4.5. The underlying idea of the declarative approach is to allow for the separation of content and style for 3D contents. This is very much as it is already practiced with HTML and CSS, but not yet possible in a standardized way for embedded 3D graphics. [28] However for Web3D this is work in progress. Within the W3C the Declarative 3D for the Web Architecture Community Group 7 is developing a proposal on how to better integrate Declarative 3D with the existing technology stack. 3.2.4 [34] The long term goal is integrating 3D environments within the DOM, that can be styled by CSS-shaders. Objects are represented in a cross-platform and language-independent file format and specifications are provided on how to add interactivity provided by imperative means through JavaScript on top. [35] The first implementation of Declarative 3D was the 3D file format VRML (Virtual Reality Modelling Language), first introduced in 1994 by Microsoft. Version 2.0 was released in 1997 and became an ISO-standard in the same year. [17] The 3D model’s geometric data are declared in a plain-text file format, which is parsed by the browser and rendered in a 3D viewport integrated within the website. The interactive VRML world supports (scripted) programming. X3D is the successor to VRML and also became an ISO standard in 2004. X3D supports different techniques of data encoding, including XML, backwards compatibility to VRML97 and binary encoding. [34] It provides interactive 3D graphics for the web and is the only standardized 3D deployment format. Listing A.2 in Appendix A shows the minimal declaration for a face in a 3D scene. X3D has a modular structure with additional extensions for multi-stage rendering, realtime lighting, surface, volume and geo-spatial components. X3D thereby provides a foundation for scientific visualization with automatized display of existing data. Interactivity with the website and limited access to the DOM can be leveraged by using JavaScript. 7 Website of the Declarative 3D for http://www.w3.org/community/declarative3d/
Web
Architecture
Community
Group:
Chapter 2. Background information
23
The biggest drawback of VRML and X3D is the browser support. Although both formats are standardized ISO-standards, support was mostly limited to Microsoft’s browser Internet Explorer and failed to gather wide acceptance. X3D is still bound to plugin implementations in the browser from which usability and performance issues arise. As support is not included by default, (proprietary) plugins to execute 3D environment defined in X3D need to be installed manually. These plugins are largely incompatible with each other and installation is often not supported in certain (business) environments, as security issues with third-party extensions arise. [36] [28] Furthermore the 3D environment is decoupled from the actual website. Plugins provide interfaces to access the DOM, however these interfaces are not standardized and each requires a different implementation. [34]
2.4.5
WebGL
As the last section discussed the possibilities for Declarative 3D, the focus moves now to Imperative 3D. The Imperative approach to interactive 3D graphics provides functionality to create procedural graphics within the website. These graphics are drawn in an isolated context e.g. the HTML5 canvas and are not represented in the DOM of the website. Third-party browser extensions offered containers in which procedural 3D graphics could be programmed, but few gained wide-spread usage and acceptance. Issues with performance requirements and platform compatibility always remained. Also being an isolated rendering system within the browser proofed to be disadvantageous, as interaction between the website and the 3D space was limited. [28] At the writing of this thesis, WebGL is becoming the new standard for procedural 3D graphics in the web browser. WebGL is an API specification for HTML5 in the DOM to render GPU-accelerated graphics in the website, proposes and standardizes the JavaScript binding of the browser. WebGL has been specified and is maintained by Khronos Group 8 and signed in 2011. Its implementation is based on OpenGL ES (”embedded systems”) with shader level 2.0 (circa 2003, equivalent DirectX 9). It is regarded as mature technology with little performance overhead. Figure 2.8 shows a simplification of the Declarative 3D technology stack proposed by the Declarative-3D-Community Group at the W3C. It displays the basics of today’s Web3D stack: DOM-manipulation, events and CSS are stable and reliable technologies. CSStransforms is implemented in the CSS-render engine and features a notable support, due to the popularity of the Webkit rendering engine. True, three-dimensional environments can be achieved using W3C’s WebGL interface or through proprietary plugins such as 8
Website of Khronos Group: http://www.khronos.org/
Chapter 2. Background information
24
Flash. These 3D interfaces require OpenGL or a similar graphics interface on the clientside. The declarative format X3D can be displayed using WebGL via JavaScript library. In this regard, WebGL is no rival to X3D, as both follow different paradigms.
Figure WebGL (Based
2.8: Not every specification is fulfilled by the client-side. requires either OpenGL or DirectX support by the browser. on diagram provided by Declarative-3D-Community http://www.w3.org/community/declarative3d/2012/11/27/declarative-3d-breakout-session-at-tpac/ )
Group:
The WebGL context integrates into the website as a native HTML element (usually canvas) and can interact with the rest of the page, as the JavaScript context used to produce the 3D graphics also has access to the rest of the DOM. [37] Interactivity and data exchange between the 3D environment and the website is possible. This allows for the combination of 2D and 3D elements, for example by creating the HUD for a 3D game using HTML elements positioned on top the 3D viewport. The reverse is not yet possible, importing DOM elements into scene graph of a WebGL-context or even having the scene graph as a declaration within the DOM tree. This is an interesting field for future developments, as converging technologies of imperative and declarative approaches currently developed by the Declarative-3D-Community Group will bridge this gap. Being a standardized specification by the W3C, WebGL could quickly gather a growing ecosystem and an active community. Growing support across multiple web browsers (Chrome, Safari, Opera and Firefox) on many operating systems (Windows, OS X, Linux, . . . ) on multiple devices (desktop, mobile) made WebGL a valid alternative to proprietary 3D solutions. As the OpenGL ES interface is low-level and requires manual shader programming, several JavaScript toolkits and libraries have been developed or are in active development. These libraries help to leverage the potential by providing abstract APIs of common features like shaders, scene graphs, render loops and complete game engines. A selection of toolkits will be discussed in the Chapter about the Implementation in 4.2.
Chapter 3
Concept/Analysis 3.1
Goal
Conventional online shops have evolved over the decades and best-practices based on the hypertext media Web have been developed. Experiments on the use of 3D in e-commerce solution have been proposed in scientific literature and tried in practice, always following the paradigm, that e-commerce solutions in three-dimensional space need to be Virtual Reality representations of traditional stores, markets or malls. This solution was often inefficient to use and broke with the best-practice users already learned in other web shop solutions all over the Web. This thesis proposes a different way of using 3D environments in a web store, without exploiting the metaphor of a Virtual Store and instead focusing on a close integration of the product data visualization in 3D space with the actual shop website. The goal is to create a 3D environment used to visually structure the product data and allow users to interact and navigate in this environment. Of particular interest is the spatial organization of items, such as products from a product database or images from a picture database (which itself is a specialized product catalog). Navigation concepts to navigate through the data are to be evaluated and implemented. Another focus is the support of hypertext features common to websites. Contents in 3D space are to be addressable and shareable via permalinks, browser history should be supported to allow website handling, as it is known to users. So far the focus of research did not include the search for user interaction techniques, that combine 3D with the hypertext-based user interface of the Web. [21] This is a gap, this thesis tries to bridge by proposing a single-page web application featuring an interactive 3D visualization of product data integrated with the website and complying common hypertext functionalities.
25
Chapter 3. Concept/Analysis
26
This will be implemented in an experimental software, creating a new User Interface based on the fotolia picture database. This should be easy to extend for more generalized product data sets. The software is the frontend component of a Web Service Portal, which works fully automated, to deliver organized and structured search results to the frontend. The frontend visualizes these product data in an interactive virtual environment, following the Imperative 3D approach discussed in 2.4.5. The proposed implementation is no substitute for a full shop system, it is rather a proof-of-concept and proving-ground for alternative navigation concepts. From a technical point of view, this proposed implementation is a testbed for several technologies which have emerged in the past couple of years. For this, the software will be implemented using modern web technologies for web clients. Of course, work with these new technologies needs to be classified as experimental and cross-platform and cross-browser issues need to be addressed. The following sections will go into more details on the Conceptual and Functional requirements of the proposed software. It will assess some technical choices and define which requirements are explicitly included and excluded from the development in (3.5). A look at selected Virtual Store implementations and other uses of 3D environments for product visualization is provided in 3.4
3.2
Navigation concepts
As discussed earlier in 2.2.1, there are different approaches to visualize multidimensional product catalogs interactively. Using 3D to preview products based on 3D models, is a possible way to include 3D in a web shop, but not the subject of this thesis. The focus is about abstract spatial organization and navigation of a product data set. Representation of the product item is of importance, but the actual data set should be regarded as abstract and should not make assumptions on the availability of graphical representations like 3D models. This is not to say model previews are not a good way for product presentation and make an effective marketing showcase. [32] However the focus of this project is with the information architecture and its interaction. The purpose of navigation is to provide a coherent way to move through visualized data or 3D scenes, ensuring the user freedom of control, providing orientation, reversibility of movement and small latency between interaction and result. Depending on the visualization and the data organization different approaches to navigation have to be taken. An important consideration are the controls and the input devices, that will be supported. This paper will support mouse and touchpad as common input devices for
Chapter 3. Concept/Analysis
27
desktop computers and notebooks. Support for touchscreens on phone or tablet devices is optional and not of high priority. Few navigation concepts for 3D have been provided outside of Virtual Reality in scientific literature. Most concepts are targeted at navigation in Virtual Realitiy environments. Jankowski (2011) defines five 3D tasks, which are the basis of 3D interaction and by this also the basis for defining 3D navigation interaction. Wayfinding describes how users build a mental model of the environment to understand their location. Visual markers and maps help user orientation and can greatly improve performance. Another technique is the Cognitive map, which is to provide a format, that can show spatial information on changes in orientation, location and spatial arrangements. The goal is to give the users an idea of where they are in the environment in relation to the data. [6] Viewpoint control is the spanning topic of moving the user’s viewpoint through the environment. Selection and Manipulation refer to interactive techniques for picking objects and changing their spatial location by modifying position and orientation System control is not an element of the Virtual environment, but describes the communication between the user and the system in regards of devices controls and system feedback (UI, annotations, notification, . . . ). [21] In 3D environments, Camera control has a special emphasis, as the camera is the viewport to the scene. It is the basis for enabling movement in the scene, but also a source of disorientation and confusion, if the camera misaligns. Locomotion and Attentive Navigation have already been introduced as means to address this issue in 2.3.1. The general goal of these ways of Constrained Navigation, is to restrict the subspace of camera freedom ensuring the user an optimal viewport. Aspects of navigation concepts for Virtual Reality can also be applied to other virtual environments. Attentive navigation, as it was shortly introduced in 2.3.1 has a major focus on optimal view settings, camera paths, attention focus and thereby provides mechanism to create the ideal viewport. Defining sensible constraints to the viewport is crucial to the further implementation of navigation techniques. [17] Mackinlay et al. (1990) distinguish four types of viewpoint movement for interactive 3D spaces: [21]
General movement describes undirected exploratory movement through a Virtual environment. Targeted movement is movement towards a specific target object within the Virtual environment.
Chapter 3. Concept/Analysis
28
Specified coordinate movement is movement towards a specific spatial location (coordinate and orientation) in the 3D scene. Specified trajectory movement describes the movement along a position and orientation trajectory, a predefined camera path. Although many of these techniques have been developed for VR-based environments, adaptation to abstract 3D environments is possible and will be discussed in Chapter 4.
3.2.1
Web and e-commerce taxonomy
The hypertext media World Wide Web established taxonomies, reproducing certain tasks and actions universal to the Web. It was shown in studies, that information gathering, searching and browsing are the three general main tasks of the web. [38] Focusing on special purpose websites like online shops shows a more defined set of actions involving the user. Among others, Fomenko described these minimum set of taxonomies in an e-commerce shop: getting the price of a product, gathering product information, finding related products, bookmarking products or search results, discovering new products, adding products to the shopping list and lastly purchase. [18] A shop solution needs to be efficient in implementing this taxonomy. This is only a small selection of actions performed in an actual full-implemented e-commerce store. The implementation proposed in this thesis will highlight tasks related to discovery, browsing and search for visualized product relationships. Virtual Reality solutions often failed to provide efficient ways to perform these tasks. Fomenko mentions in 2006 search times of 77 seconds for a product within a Virtual Store as a good result. [18] Compared to the speed users can expect of today’s search engines using high-bandwidth Internet, such times are unacceptable and are not tolerated by the user. Creating a coherent conceptual model is important. The perception and interpretation of the world and its controls need to follow the same principles everywhere in this world. These conventions need to be discovered and learned by the user initially and the user interface has to guarantee consistency, if necessary by defining sensible constraints. Often, the affordance of communicating what is interactive and meaningful in the virtual space has been neglected. [24] Since one of the main topics is on finding information and products, the tasks of search and browse will be more detailed in the next sections. While both describe very different ways how users find information on a website, the right combination of both is important and makes for a good user experience.
Chapter 3. Concept/Analysis
3.2.2
29
Search based navigation
For product catalogs two basic navigation strategies can be identified, browsing and searching. Search is the task for finding a specific piece of information. Here, the users know what they are looking for and the user interface has to feature a short way to get to the desired information or product. Common among web shops is a quick search form, which allows to enter keywords and returns a list of related results in response to the search query. Depending on the size of the catalog, the search can be narrowed down in the user interface by applying filters and limiting the search only to specific categories or subsets of the full data set. Studies by Forrester Research have shown the influence of a successful search method. If customers can not find easily what they are looking for, online shops can lose up to half of their potential sales and 40% of their return visitors. Respectively, good search implementations improve usability and increase customer satisfaction which itself can lead to better sales. [18] Although search results should deliver the best results based on the search query, it is still in the interest of the web shop, to provide a certain degree of search vagueness. Adding less relevant, but still related search results after the most relevant results, is a way of showing the scope of the product range. While being not exactly what the users may have been searching for, fuzzy results can give them an idea of what related products may be relevant to their search, and which they may not have considered before. The result set should be broadened to offer alternatives, if no exact matches can be found. Providing product suggestions or even alternative relevant search keywords, is a good practice. [18] In 1997, Nielsen performed user studies and described 50% of all users as searchdominant, beginning their search for information on a website by using the onsite search box. [39] More recent studies quoted by Sauro (2012) , showed that on average 10-20% of users will start with onsite search. Several factors influencing this ratio have been described, but are not conclusive. More densely packed sites are described as having higher search rates. Study participants are quoted, they avoid onsite search due to low expectations on search algorithms by the website. Compared to the generally good User Experience of web searches like Google, onsite search algorithms are described as inferior. [40] The large differences in the ratio of search-dominant users to the 1997 studies could be explained by the different search expectations. Nielsen already described in 2002, that the users’ skills in handling searches correctly did not advance and that advanced searches like boolean search are to be avoided. [41] With web technologies and
Chapter 3. Concept/Analysis
30
website user interfaces advancing, the expectation would be that search usability generally improved. The assumption that techniques such as auto-completion, fuzzy-search or search suggestions make searching easier, appears conjecture and is worthy of more research, especially in regards to mobile devices. For the implemented software, the search algorithm will be provided by the backend service and is therefore out of the scope of the implementation. However, the display and visualization are a core focus of the implementation. Van Ballegooij and Elins (2001) introduced Navigation by query as a concept for performing search queries in a Virtual environment. The idea was to provide a search interface on the current scene graph and to transport the user to the selected search result. The user would transition to the object or POI through suitable camera transitions in order to avoid confusion and loss. He promotes textual search terms and Content Based Retrieval (CBR) i.e. search-by-example as two possible search interfaces. [42] Available next to onsite search is also the browser-side full-text search. It searches the document for keywords, moves the documents viewport accordingly and is a possible candidate for implementing Navigation by query. Supporting this search in the system would be beneficial and should be evaluated.
3.2.3
Browse based navigation
The second basic paradigm of navigation is based on browsing. Instead of using the search box to query for the desired information, the website is navigated link-dominant, following the content structure of the website and the hierarchical categorization of the product catalog. In this paradigm, it should not be assumed, the users do not have a clear target they want to find, but they tolerate the longer way to reach it. It can be argued, that they accept or even are interested in being provided related product information along the way. Browsing through categories may give them additional ideas on what specifically they are looking for, which may even lead to diverging targets. Exploration is another important impetus for browsing - comparable to walking around in a conventional store to see what is offered. Customers are interested in seeking information in a well presented way to inspect in a casual manner, to compare differences, find specials and similarities. Browsing can be supplied by different ways of structural data organization. Hierarchical categories have been mentioned, visualized networks between related products or product relationship representations based on similarity are possible and will be discussed in Chapter 4 about the implementation.
Chapter 3. Concept/Analysis
31
Based on the studies performed and quoted by Sauro, up to 80% of users start the navigation of the website by browsing, instead of using onsite search. They expect a well categorized product catalog and approach the examined product by browsing categories. [40] It conjectureed, that search-based navigation is more powerful on desktop and browsing more powerful on mobile device due to limitations in typing on mobile keyboards. This is also a topic for more research.
3.2.4
Hypertext features
For the acceptance of a new 3D based shop system it is important to consider the underlying hypertext media and work out which usability aspects need to be kept, in order to avoid breaking established best-practices known from previous 2D shop solutions. The goal is finding a balance between an immersive and fluent 3D environment, a tight integration with the website and common hypertext features. Sperka (2004) describes websites as discrete finite state machine, which stand in contrast to Virtual Reality as continuous state space, in which you navigate without discrete steps or history. [32] Hughes, Brusilovsky and Lewis (2002) describe navigation on a document based website as nodes on a structured graph outlining the discrete states of the hypermedia i.e. the website. [17] The browser history, the availability of the Backbutton to quickly return to previous visited locations is an important usability aspect for 2D websites. In 3D environments the use of HTML5’s History/State API gives ample possibilities by saving 3D locations and binding them with the browsers history. As all major web clients implement tabbed-browsing, the application should support multiple instances at the same time. As discussed in 2.4.4, Web3D can follow either the Declarative approach or the Imperative approach. Although the software proposed in this thesis will follow the Imperative approach, the goal is to try and keep the advantages of Declarative approach. These advantages being a tight integration of the 3D scene with the DOM of the website, without losing Hypertext functionality. [28] Following hyperlinks and saving bookmarks are just two very common examples of web taxonomies learned and employed by users on a daily basis. Sharing a link to a specific product is a seemingly minor task, but poses several requirements to the virtual environment most implementations do not fulfill, as we will find out in 3.4. It requires that the state of the virtual scene is persistently bound to the URL in a permalink. Calling this URL should always result in the same page being loaded with the same
Chapter 3. Concept/Analysis
32
content, independent of operating system, browser and country. For saving a search result this means, based on the same search query, the search should respond with (at least roughly) the same set of results. For navigation in a 3D scene this means, that Points of Interest in the scene have to be addressable via the URL. States like the camera position within a scene should be persistable, to return to the same location after a connection loss and subsequent reload of the website. The context menu should be available to copy URLs or open links in a new browser tab or window. This is just a small set of tasks expected to be possible in a website. Breaking this taxonomy hurts usability and increases the distance between the proposed system and the established solutions, the user experienced before. Fulfilling all tasks hypertext offers and requires is not easy and some compromises are expected. To be able to access choices in usability and interface design, it is important to consider User tracking and Adaptation in the software design. Chitarro and Ranon (2007) argue, even in 3D space user tracking and content adaptation is required. Following movement of users to collect usage data is not only interesting for marketing evaluation of the products or semantical evaluation of the data set, but also for evaluating the User interface. This analysis of usage patterns can be used to optimize the interface or for adaptation of content based on analyzed data of the user. Optimizing user’s search results through metrics like product interest rating, the usability also increases the relevance of the results. [43]
3.2.5
Aesthetics
Aesthetics influence the perception of website qualities. The beauty of design gives the first impression and the impetus to explore. It adds to the extrinsic motivation (motivation for a higher reasoning or goal) of gathering information the intrinsic motivation (motivation for its own sake) of pleasure and enjoyment. Cai, Xu, Yu and de Souza (2008) argue that aesthetics is closely connected to attention and understanding. [44] Complexity without order produces confusion; order without complexity produces boredom. (Arnheim, 1969, p. 124). [45] Scientific literature on aesthetics is mostly exploratory rather than confirmatory and theory-driven. [44] Cai et al. (2008) propose a two-dimensional scale for Visual appeal and Organization. Visual appeal defining the perception of pleasing to the eye and stimulating the intrinsic urge to explore and browse. It establishes the fun to use the system and introduces an affective component to perception. Organization is about consistency and validity of
Chapter 3. Concept/Analysis
33
elements on the site. Coherence, efficiency and effectiveness as stabilizing and inspiring confidence (in the site and persuading purchases). Organization adds to the cognitive component. In Lavie and Tractinsky’s (2004) paper about classical aesthetics it was defined as the orderliness and clarity of the design, as quoted by Cai et al. [44] The goal of this thesis is to produce an interactive and pleasant user experiences exploring the possibilities of 3D in web shops. The focus within this thesis however is less on the Visual appeal of the system, but more on the consistent organization. Visual appeal is important and should not be disregarded entirely, however the focus is not on the graphic design, but on the technical implementation. Previous implementations will be judged shortly by their aesthetics criteria. The implementation proposed in this thesis will be judged in 5.3.2.
3.2.6
Customization
According to Celentano and Pittarello (2004), customization can be separated into two major techniques: [33]
Adaptive techniques describe customization based on collected static data. These data are gathered during runtime of the system. Monitoring and data mining techniques can help to analyze the raw data to find usage patterns upon which the data representation, navigation, as well as the semantical relations of the product data can be improved. These improvements can either be performed by the developer or even automatically. Constant evaluation and refinement of usage patterns is important for the duration the software is deployed. Adaptable techniques or personalization allow the users to customize the visualization on runtime themselves. The users have to explicitly choose the interaction paradigm and its settings. It has to be analyzed which settings the evaluated User Interfaces should give the users access to. Other adaptable approaches also include user recognition by login, but are not focused on in this context.
In this thesis the focus is on the adaptable techniques and thus provided customization options. It is differentiated between use cases and which settings are available in each. One such use case is to have different user groups using the system. Developers require a wide range of configuration options, for configuring the navigation methods and default settings of the virtual environment. They try and assess different options and require an interface to quickly switch between views. Regular Customers require a different set of options to enhance their individual experience. It is to be evaluated which set of selected
Chapter 3. Concept/Analysis
34
settings can be given to the user. Features like search filtering should be evaluated, but are not a main requirement of the development. Adaptable techniques can be assessed shortly optionally, but are no requirement. Adaptive techniques are hard to evaluate on third-party software without deeper insight into the system, as data mining operations are performed server-side in the backend and are usually not communicated externally. Adaptable techniques will be analyzed for previous implementations, if available. :[44]
3.3
Requirements
Following the conceptional requirements discussed so far, the focus moves to functional requirements of the implementation now. These requirements define the technical framework and performance benchmarks demanded from the final application/system and implemented. The basic infrastructure will be distributed data-centered applications including a Backend and a Frontend system. The backend system will be provided and therefore establishes constraints on the implementation, that can not be changed. The data model received from the backend is set and changes to it will be expensive in terms of efford and time. So the implementation focus is on the frontend. The frontend will receive the data and has to display them in an interactive 3D environment, following the premises layed out so far. More detailed technological requirements will be provided in the following sections.
3.3.1
Data set and backend
The product data set is the foundation of all decisions, as all constraints are based on it: the amount of product items that are stored in the database and that are accessible in the frontend by the customer, the data structure (e.g. in a hierarchical categorization model), how detailed the data model of each item is and of what quality the meta data are. Do all items have the same meta data, are there exceptions, how should the system treat outliers? The diversity of the products itself is of topic, as it defines, how specialized for one special product type the view can or has to be designed. More diversity requires either more generalized solutions or several special implementations for each case. Based on the data model, it has to be evaluated what data and relations are exported to the frontend, that can be used for visualization, what product features can be used for comparison, for order or for semantical relations.
Chapter 3. Concept/Analysis
35
The data set will be stored and processed on the backend server. Automated analysis, preparation and optimization of data will be processed on that server within the web service infrastructure. [34] Communication with the backend server has to be possible using common interfaces like AJAX or REST. HTTP requests should be send to the server, data being returned in the response should be in common data formats such as XML or JSON. The actual data representations will be performed by the frontend.
3.3.2
e-commerce frontend
With the backend handling the data management and data processing, the frontend deals with view rendering, data visualization and interaction. The main focus of this project is not the redevelopment of the full infrastructure required to create a web shop, but is on the frontend depicting navigation concepts, interaction techniques and 3D technology in the web browser. Features like shopping cart, user registration, bookmarking are only optional, should the base of the project implementation allow for these features. The frontend will be an interactive web application published as HTML, styled with CSS and interaction scripted in JavaScript. For each aspect libraries and toolkits can be applied to aid the development and will be presented in Chapter 4. When considering libraries, the use of projects under Open Source (OS) licenses is recommended and the use of OS licenses allowing commercial use preferential. Within the frontend the paradigm of Separation of Concerns is respected by separating the development of the main application (a JavaScript library) and the frontend representation (HTML website and CSS styling). The library will be designed in a way, that its use cases can be configured and it can be reused for multiple frontend implementations.
3.3.3
Deployment
The proposed web application will feature dependencies, which will have to be managed to allow deployment to environments other than the development environment. The use of third-party libraries e.g. for 3D rendering (see 3.3.5) or history manipulation (see 3.2.4) requires a dependency management process that retains the libraries used, version dependencies and update procedures. A package management system for dependencies is recommended. The JavaScript core, which will be the core of the web application is to be designed as a reusable library. It needs to feature certain abstraction and configuration interfaces, to allow for deployment in multiple instances. Although the application will be designed
Chapter 3. Concept/Analysis
36
for a fixed and possibly specialized data set, it is not be designed as a single purpose application, but should be adaptable for other kinds of product data. Public release as Open Source is no requirement. For production deployment and delivery, support for code optimization, compilation and code validations is recommended, but not required. As this is a client-side web application only based on HTML, CSS and JavaScript, additional requirements to the server infrastructure should be avoided. With this basic setup, upload to any static HTTP server would suffice to deploy the application. Without the need of registration and user management and data handling performed by the backend, the application can be designed as a stateless static website, with minimum technical or hardware requirements and optimal scaling properties. These considerations are hard to judge for other projects, as this is part of the organization of the development infrastructure and not visible outside of the project.
3.3.4
Browser support and compatibility
Web browsers have evolved from simple document viewers into full runtime environments for whole applications, even up to the point of supporting hardware accelerated 3D graphics. Developing cross-platform 3D applications used to be a complicated and time consuming process. Supporting multiple platforms and devices on the same source code was difficult and daunting. As discussed in 2.4.1, the HTML specification introduced a lot of common functionality to the browser, that can be accessed via JavaScript by websites. These specifications define interfaces common to every browser on every platform and are a good basis for cross-platform development. The specifications define a minimum set of features and are created by different consortia and working groups such as W3C 1 or Khronos Group 2 in case of the WebGL specification. All major browsers are represented in these consortias. The visualization proposed in this paper will follow the Imperative 3D approach, discussed in 2.4.5, leveraging the new GPU-accelerated 2D and 3D capabilities of the WebGL API. Low latency interactivity will be achieved by this client-side rendering approach. [34] WebGL has no widespread support yet. As of October 2012, stable implementations are featured in the web clients Firefox and Chrome, and in an experimental state in Opera. This already covers a large segment of the browser market. Support for mobile devices can be manually activated on Android devices, but is not yet commonly supported. 1 2
Website of the W3C: http://w3.org/ Website of Khronos Group: http://www.khronos.org
Chapter 3. Concept/Analysis
37
Using libraries, to leverage the potential of the WebGL interface also helps serving fallback solutions in case the user visits the system with an incompatible browser. Some libraries support Software renderers which render 3D to the canvas without requiring OpenGL support of the browser, however with high performance cost. Some of these alternative renderer will be presented in 4.3. Solutions using web-service architectures and building on these web technologies can thus be implemented with a wide range of support among browsers. For a production system, fallback solution to the experimental technologies deployed in this project should be given much more emphasize than is possible in the scope of this work. This project is about evaluating the state of the art technologies and will thus not emphasize on fallback measures.
3.3.5
Visualization
Visualization will be provided by a client-side rendering process. The advantages of client-side rendering are the simple server infrastructure (requiring none) and the possibility of highly interactive applications since everything is rendered on the client browser. This wouldn’t be possible with server-side rendering, where the rendered graphics are streamed to the client and thus have much higher latency. [34] The rendering 3D graphics should not be performed depending on external extensions. Which rendering methods are applied is not predefined. WebGL, software renderer using HTML canvas or CSS-transforms are possible choices and will be evaluated in 4.3. As WebGL is a low-level API based on OpenGL, an additional layer of abstraction is recommended. Libraries and toolkits are evaluated for the use in the project in 4.2. Of importance are the encapsulation of concerns, providing a simple API for the most common tasks, predefined shaders and possibly even an MVC template for simple WebGL applications. What is also important next to technical aspects of the library is the surrounding eco-system. The state of development, the richness in API examples and the activity of the community are important factors in considering the use of libraries in long-term projects. Another aspect of the visualization is the performance requirement and the amount of resources demanded by the rendering process. This is relevant especially for mobile devices and notebooks, as it immediately affects battery consumption. The application will be designed for regular 2D displays and scale in size. Viewport should be variable in size and rescale with the browser window. Graphical design should
Chapter 3. Concept/Analysis
38
be provided using CSS, thereby supporting high density displays like tablets or smart phones. Different Field Of View angles should be tried for the camera in 3D space. The FOV should be adjustable in the developer interface. 2.3 Studies by Polys, Kim and Bowman (2005) argued, larger SFOV being advantageous over narrower SFOVs for both search and comparison tasks. Increasing the FOV decreased search times, as more items can be rendered within the projected scene, while impairing spatial comparison due to fish-eye distortion. [11] To aid navigation through the product data set, a few basic requirements should be set. In order to explore the product data set, the visualization should aim for clarity and structure. Dense or overlapping data structures should be avoided. The main focus should be to enable grasping, analyzing, comparing, searching and exploring the data. [34] The Interaction Locus is an approach to structure three-dimensional worlds based on the features of objects. The scene is semantically structured and orientation marks for guidance and the freedom of movement are integrated. Structuring is performed by defining identifiable interaction devices within the world. These are either interactive objects, artifacts to display interaction possibilities or dynamic information objects (like annotations). By defining these semantical areas and objects, spatial interaction with the user is possible. [33] Interaction Locus was designed to semantically describe Virtual Reality scenes. As the work of this thesis questions the VR approach for spatial item organization like e-commerce stores, it will have to been seen, if the idea can be adapted for other three-dimensional data visualizations. [46] [33]
3.3.6
Requirements table
Based on the criteria discussed in the previous sections, it is possible to create a checklist, against which the project can later be compared. The project and the resulted software of this thesis will be judged in Chapter 5 and the checklist will be assessed in 5.2.4.
3.4
Previous implementations
Since the 1990s the combination of e-commerce and 3D environments often lead to the recreation of real world shopping experiences in virtual environments. Several authors
Chapter 3. Concept/Analysis Criteria Technology stack Library dependencies Third-party software required Compatibility
Virtual environment
Shop taxonomy
Heterogenic data set Fluent performance Energy consumption Visual appeal Organization Customization Permalinks History
39 Description What technologies are used in the implementation. On which libraries is the project based on? Are additional plugins required by the website? Based on the technology stack, which operating systems and browsers are supported. What kind of VE is simulated? e.g. Virtual Shopping Mall, abstract data visualization? Can a full shopping workflow be simulated? (user registration, shopping cart, purchase) What kind of data are displayed? Is the usability affected by performance? Are animations smooth? How does the rendering affect energy consumption? Encourages the software exploration by an appealing interface/graphics? Are design and interface clear, consistent and efficient? Can consumers customize their user experience? Can users link to search results and product details? Is the back-button supported?
Table 3.1: List of criteria to evaluate
implemented proof-of-concepts showing Virtual-Reality-stores can be created, research has been performed on Virtual Store concepts and implementations. However due to graphical limitations and disadvantages regarding navigation and usability these implementations remained academic experiments. Many of the proposed systems are not available anymore and therefore can not be covered extensively. Most implementations feature an alternative frontend to a conventional online web shop. They do not reproduce the full shopping process by excluding product checkout and purchase. These functionalities are outsourced to the original web shop, from which product data are imported. This principle is also proposed for the application implemented in this thesis in 3.3.2. A selection of online 3D shops will be presented and as good as possible evaluated based on the checklist. As many shop sites are based on proprietary plugins or are only
Chapter 3. Concept/Analysis Browser Firefox Chrome Opera Safari Internet Explorer
40 Version 19 25 12.14 6 9
Operating System Mac OS X 10.7 Mac OS X 10.7 Mac OS X 10.7 Mac OS X 10.7 Windows 7
Table 3.2: Table of browsers used for evaluations
optimized for certain browsers, the compatibility will also be mentioned. All sites are tested with the browsers featured in 3.2.
3.4.1
Virtual Reality
Although Virtual Reality has been proposed as a solution for Virtual Stores earlier, as elaborated in 2.3.1, few implementations are available and even fewer cover the most basic functional requirements. Shops are often developed as tech demos or portfolio demo implementations. Navigation is adopted from first-person games implementing a WASD keyboard navigation. The keys WASD control walking movement in the environment, as head movement is simulated via the mouse input. The user is immersed in the 3D environment either by first-person view or by third-person view with an avatar, a 3D character representing the user in the virtual world. Despite the availability of a wide range of academic proposals to improve usability of Virtual Stores, few were implemented and evaluated and no conventions have been established yet. The following sections will analyze selected implementations.
3.4.1.1
3D City World
By the time of the writing of this thesis in April 2013, 3D City World 3 is among the most complete Virtual Shopping experiences online. The shop is developed by remasolutions and requires the installation of the Unity3D browser extension. The displayed data set is partially imported using the Amazon API. Customized shop and advertising space can be ordered from the shop creators. Data is displayed in a Virtual world depicting the pedestrian street of a small town (see Figure 3.1). Shops line up along the streets, Artificial Intelligence (AI) characters roam along. The city is divided into multiple districts that can be visited through literal gates on each side of the current district. The user controls an avatar, either a chosen character or a flying glowing ball. Clicking on interactive objects (doors, shops, signs, advertisements) 3
Website of 3D City World: http://www.3dcity-world.com/
Chapter 3. Concept/Analysis
41
Figure 3.1: Virtual environment simulating a small town with Virtual shops represented by stores along the street. AI characters roam the streets.
zooms the camera to the object (or lets the character run towards it). Unfortunately interactive objects are not highlighted within the world. Selecting a shop prompts a popup window asking whether or not to enter this store, with a small description on the product categories therein. Once entered, a new scene opens displaying the shop interior. This interior is very minimal and features space for just 20 items in picture representation. Focus on an item within a shop opens its product details on the web page outside the 3D environment with product description and the forward to the actual online shop for purchase (see Figure 3.2). A bookmark feature is implemented.
Figure 3.2: Inside the store, items are represented as pictures on the walls. Selecting a product opens additional information outside the 3D context.
A search feature is available, however results are only shown outside the 3D viewport on the website and are not related to the 3D environment at all. Finding an item via search, does not give information where to find it in the virtual world. There are no further hypertext features either. The implementation of the Virtual World is expectedly heavy on the GPU, given that the interaction of the Virtual Characters and animation requires continuous rendering.
Chapter 3. Concept/Analysis 3.4.1.2
42
Soonique
Developed by the agency Graphtwerk in 2013, Soonique 4 provides the implementation of a demo fashion shop5 . Soonique is a general framework based on Unity3D for customized 3D shops , the demo shop being one demo implementation.
Figure 3.3: Screenshot shows the implemented demo and features the navigation widget.
Stores can be ordered and configured by a 3D editor that is provided with the shop. Access to product management system or Enterprise Resource Planning(ERP)-solutions is possible. The implementation allows the inclusion of music and video. Products are displayed as 2D sprites. Clicking an object moves the camera towards it and opens an area in the web page that displays product information, additional illustrations and the actions for bookmark and checkout. An interesting aspect in this VR solution are the movement control shown in Figure 3.3. A first person camera is applied and WASD controls provided. For effective and precise mouse movement, a widget is included, that helps directing the mouse, by behaving similar to a joystick. Pressing the ALT-key switches the controls from natural movement, to axis movement.
3.4.1.3
enjoy3D
enjoy3D 6 was developed in 2009. It features six Virtual Store implementations for art, t-shirts, toys, books, posters and pictures. Each store has a different visual style and is based on different data APIs like Amazon and Flickr. It was realized using Flash. 4
Website of Soonique: http://soonique.de/ Demo of Soonique: http://soonique.3dstellwerk.com/storefront/index.php?sID=27&user=32 6 Website of enjoy3D: http://enjoy3d.com/
5
Chapter 3. Concept/Analysis
43
Figure 3.4: Screenshots of enjoy3D show the Toy Store and the Bookstore.
Movement within the store is realized using a first-person view controlled by the common WASD movement controls. This is barely functional and the navigation is broken in some browsers, the camera keeps moving in the direction last moved to. Alternatively navigation by mouse click is possible and works well. Movement through the store has no collision detection. Products are categorized in shelfs. Clicking the shelf moves the camera focus on the shelf. Clicking an item causes the camera to zoom in on it and reveals the product description on the website next to the VR viewport. From here, the user can go into the original web shop, from which the data are provided and perform the actual purchase. The stores have looped music in the background. A search function for keywords is provided. Upon searching, the camera is directed to a search shelf, where the found products would be listed, if anything was found at all. Next to the search is a quick selection for categories provided in a drop down menu. By selecting the category, the camera flies to the according shelf. Data organization in shelfs is well-done, however locomotion and visual appeal do not convince. The graphics look outdated even by standards of 2009. The shops look sterile and the music does not help to create an immersive atmosphere. Camera pans and zooms are smooth in general. However hardware load is heavy, as the scene is continuously redrawn despite showing static inanimate scenes, thereby putting stress on the GPU.
3.4.1.4
esimple.it
esimple.it offers a series of demo virtual stores7 . These have to be considered tech demos based on the proprietary Unity3D engine, developed in 2010. Locomotion is provided using the arrow- or WASD-keys on the keyboard. Mouse interaction is only for clicking displayed item upon which a small overlay popup opens within the 3D scene showing a close up picture of the product. 7
Virtual Store demos of esimple.it: http://www.esimple.it/en/itemlist/demo
Chapter 3. Concept/Analysis
44
Figure 3.5: Screenshots of esimple.it demo fashion store.
The demo store shows a static store with products shown in Figure 3.5. It is not identifiable, if the product placement has been done manual or what product management system is used in the background. According to the description, an e-commerce backend and a shop editor could be provided. esimple.it gave a pilot implementation called Virtuymall including a backend management system. Virtuymall has been taken down for maintenance indefinitely and is discontinued. No further store implementations are in production use.
3.4.1.5
Discontinued projects
Many Virtual Shopping Malls have been implemented and launched over the past 10 years. However, none were able to build a recognizable brand and even more were silently discontinued. The Mall Plus 8 , was introduced in 2006 and continued till 2011. It was based on Flash, however not using any 3D engine, but using parallax layers to simulate 3D. The mall was divided into various panoramas, that could only be navigated by pan and zoom either using mouse movement or the virtual joystick provided. A handful of shops are actually implemented, however are not stocked anymore. The system is barely usable due to bad input reaction and slow loading times. The VirtualMall 9 was a virtual mall implementation that started in 2009. In March 2012, new release was development, but was not published at the time of this writing.It was developed for the Windows platform only and required manual installation of a proprietary plugin. The installation package is not available anymore. 8 9
Website of The Mall Plus: http://www.themallplus.com/ Website of The VirtualMall: http://the-virtualmall.com/
Chapter 3. Concept/Analysis
45
VirtuelEShopping.com 10 is a Virtual Reality shopping solution development in 2009 and discontinued in 2010. It is notable, that this was also designed as a social network and the shopping experience was to be multi-user. It was based on a client-server infrastructure. A Mall server hosted the shopping mall, multiple clients would connect to this server and users represented by avatars could interact with each other in the virtual world. The software was developed for Windows only and required manual installation of the client software. Once installed, the client opens a lobby to connect to mall servers, however none were active at the time of this writing. Strictly speaking, this system did not fulfill one major requirement defined in this thesis. This solution is not a web shop, as the actual shop is not in any way implemented or embedded in the website, but in the client application.
3.4.2
3D web shops
The following implementations display the use of 3D in shop and catalog websites outside of the context of Virtual Reality.
3.4.2.1
Shop3D
Shop3D 11 is a problematic example as only the actual implementation could be retrieved, but no background information about its development. It is hosted and presumably developed at the Sapienza University of Rome. Unfortunately, the implementation contained no meta information about its author or the conditions under which this was developed. This is particular unfortunate, as the technical implementation is well worth analyzing. In contrast to Virtual Stores, this approach utilizes 3D merely for aesthetic purposes by transforming a two-dimensional user experience into a three-dimensional space, as shown in Figure 3.6. The system features a shop including onsite search and category browsing. Navigation is based on conventional 2D shops, however instead of a 2D layout, the website widgets are arranged in 3D space. The website can be rotated, opening a subpage moves the current contents into the background, thereby creating a data mountain-like stack of the visited contents, shown in Figure 3.7. Lists are displayed as smooth sliders with maximum of 5 items. This implementation is not optimal in many regards, as it is not possible to see which lists are interactive and which are not. There are more inconsistencies in the 10 11
Website of VirtualEShopping: http://virtualeshopping.com/ Website of Shop3D: http://aixia.dis.uniroma1.it/shop3d
Chapter 3. Concept/Analysis
46
Figure 3.6: Browsing categories in Shop3D, the packages spin in a circle.
interaction, for example some items react on double click, some on single click. The layout in general is very basic and does not guide through the application. Graphics are based on primitive shapes, font rendering and 2D icons in 3D space. The fonts are especially problematic, as they are illegible due to perspective distortion. While the navigation structure is based on conventional hypertext stores, it was translated to 3D without keeping the strengths of hypertext. Products can not be linked, context menu has been deactivated and the 3D shop is a stand-alone 3D scene. No options of customization are provided.
Figure 3.7: Search results with one product selected in Shop3D.
The shop is based on GLGE using the WebGL specification. GLGE will be evaluated as a possible library in section 4.2.3. With the requirement of WebGL, this system is
Chapter 3. Concept/Analysis
47
limited to Firefox and Chrome. There is no fallback for incompatible browsers, only an error message. The shop has to be regarded a showcase of interactive 3D created with WebGL. However the implementation is hardly usable due to the bad interface layout. Navigating through the site loses its initial appeal and curiosity quickly, due to the usability and graphical issues.
3.4.2.2
WebGL Bookcase - Google Chrome experiments
While not simulating Virtual Stores, the following implementation tries to create sensible constraints between the freedom of navigation virtual environments allow and an sensible and intuitive user experience. Among a collection of showcase implementations of the WebGL-API in Google’s web browser Chrome is a demo displaying a simple 3D based bookcase12 . The website was created by the Google Data Arts Team in October 2011 and features a helix-shaped book shelf displaying books from the Google Books API. [47] The implementation is considered experimental and only a demo of the capabilities of WebGL. It is supported by Firefox and Chrome. Due to constant repaint, it causes constant load on the GPU. Occasionally the internal connection to the Google Books API was lost. The users can interact with this virtual bookshelf by rotating the shelf along its Y-Axis and moving their viewport up or down. Through these restrictions the camera is always perfectly aligned to the shelf. The user can select a book by clicking on it. In a smooth animation a 3D book model flies from the bookcase towards the camera. As shown in Figure 3.9 clicking the cover reveals the synopsis as well as options for purchasing the physical book. Similar to GUI-windows, a quit-button closes the book, returning it to the shelf. The books on the shelf are positioned along the full circumference of the helix. Along the vertical axis, the shelf is divided into categories, the books outside of the current category are slightly darkened showing the transitions from one category to the next. Small hover message displaying the current category. Clicking on this category, reveals an overview over all categories, to quickly jump to the desired category. This is a particular good way of giving entry points for browse-based navigation, as discussed in 3.2.3. The system is missing a search function, so browsing is the only way of navigation. 12
Website of WebGL Bookcase at http://www.chromeexperiments.com/detail/webgl-bookcase/
Chrome
Experiments:
Chapter 3. Concept/Analysis
48
Figure 3.8: Overview in Google’s WebGL Bookcase Experiment
No hypertext features have been implemented, linking to books or copying URLs is not possible. The bookcase was developed using three.js, which will be evaluated in 4.2.1. It features smooth movement, quick reaction and good navigation constraints. Book covers are loaded dynamically as the book enters sight. This is quite visible on quick movement along the helix. In general, transitions and animations were put to good use giving a smooth user interface and great sense of interaction.
Figure 3.9: Selected and opened book in Google’s WebGL Bookcase Experiment
The idea of the bookcase can be considered skeuomorphic: The bookcase metaphor itself and mapping categories to shelf areas draws back to traditional book shops and libraries. The twist of constructing a shelf of infinite height is clever, as it does not break the shelf metaphor, while still leveraging strength of Web3D in visualization in a appealing way.
Chapter 3. Concept/Analysis
3.5
49
Excluded requirements
Given the complex nature of the subject, some considerations had to be excluded from the premise of this thesis and its project implementation. As already mentioned in 3.2.5, this work is not about visual graphics design. It is a technical implementation and the design provided in the implementation will not be done by a professional designer. It should therefore be simple and functional, possibly based on available style guides. With the backend predefined as discussed in 3.3.1, the data set is predefined as well and may not proof optimal for a generalized shop implementation. Depending on the specialization and the heterogenity of the data, certain compromises may be required, that will be detailed in 4.1.2. It should still be possible to infer to a more generalized approach even based on the specialized data. This application will be stand-alone and not part of a full marketing concept. In the production implementation of an e-commerce shop system different roles for maintaining and managing the shop are established. Development and maintenance is not performed by the same persons updating the inventory database. From this the requirement for multiple user roles with different privileges within the system arises. [18] This is not included in the proposed project, neither is any user management. Controlling the displayed data is completely handled by the backend inaccessible by the frontend. This also excludes manipulation of search results to push desired contents, which could be an expected feature request for marketing campaigns to promote certain products. The data process in the backend is currently fully automated and would therefore require the introduction of a balancing system to promote products in the content retrieval algorithms. Lastly, the choice of development is not predetermined. Test-driven development for example is possible, but not required. Automatic tests on the source code are a good utility for quality assurance and code quality. It can be optionally used, if it is deemed necessary and practical.
3.6
Proposed project
After defining the abstract criteria and excluding requirements, the following section proposes the implementation.
Chapter 3. Concept/Analysis
50
The software developed in Chapter 4 will be a web application implemented in JavaScript using imperative WebGL to visualize product data from a backend in interactive 3D. The software will be derived from a prototype library developed by pixolution, to visualize picture data sets based on visual similarity. Whereas the original project used HTML5 canvas to display pictures, WebGL or CSS-transforms will be used as means of 3D visualization in websites. The visualization will follow the flat-pixel approach as discussed in 2.3.2 and not build on prior metaphors. Product data will be visualized by pictural representation in a spatial environment. Multiple spatial transformations will be offered, to explore data by different means of spatial order and according camera interaction. Among the proposed visualizations are data mountain, data surface, helix-structure and ball-structure, each with a set of controls to navigate the camera through the scene. One spatial visualization will be selected and developed up to a point of giving a sensible proof-of-concept for a possible product catalog implementation. The graphical implementation should feature a minimal amount of visual appeal. The website will support both browse-based and search-based navigation using a common search-query interface to the backend server. New searches can be performed based on keywords or by providing a source item. Triggering search-by-example will be possible from any given item. Browsing navigation is provided by refining the search with every search-by-example iteration. Hypertext features (permalinks and browser history) will be integrated with the virtual scene to allow a tight integration of the virtual environment and the website. The implementation should find balance of breaking the finite document states that is hypertext and continuous exploration possible through WebGL and JavaScript. The web application will be a single-page application, all interaction will happen in this website without reload. The application will be written as a reusable library and used in at least 2 contexts, giving a development website for quick function testing and an example implementation of a shop frontend. The development site will feature customizable camera and environment settings for development and debugging. The software is only based on HTML, CSS and JavaScript and only requires a static HTTP server.
Chapter 4
Implementation/Realization 4.1
System architecture
The software developed in this thesis is based on a prototype project by pixolution 1 called ColorViewCanvas. It specializes on picture similarity search and exploration based on the photography database fotolia 2 .
Figure 4.1: The example installment of the original ColorViewCanvas implementation drawing on HTML5 canvas.
ColorViewCanvas is an HTML5-JavaScript prototype in combination with a backend API-server. The backend processes search requests send by the frontend. A search request can be based on various criteria like keywords or examples. Based on a search request, a search-by-similarity is triggered in the backend returning a grid of pictures arranged by visual similarity. This grid is drawn on an interactive HTML5 canvas 1 2
Website of pixolution: http://www.pixolution.de Website of fotolia: http://www.fotolia.com/
51
Chapter 4. Implementation/Realization
52
element. The canvas can be dragged and zoomed and the pictures can be selected to preview them or to trigger a new search. Multiple search options are available based on color, keywords or example pictures. The system is following the Service-Oriented Application (SOA) architecture paradigm. SOA describes the composition of several low-level services to a higher level of abstraction and the separation of concerns. Functionalities and responsibilities in the system are distributed over several services. In this case a backend server for data processing and data provider, and the frontend for display and user interaction. [34] Along with the source code there was a build and development environment based on JSLint for code quality assurance and Google Closure for JavaScript code compilation and optimization. One example project was included to test the compiled library and a development project to preview and develop changes to the framework without recompilation. Based on the ColorViewCanvas and its components, a new software was developed, to fulfill the requirements set in Chapter 2 and 3.6. This software reuses the basic infrastructure and many components: New components were introduced to substitute or extend features. The basic setup of a stateless frontend and the data backend was left untouched. The particular changes performed to the ColorViewCanvas are discussed in the following sections.
4.1.1
Data backend
The backend server is the core of the underlying service infrastructure. It is implemented as a web service offering interfaces for search queries on the contained database. Web services are designed to exchange data over the Internet to easily allow software and services from different organizations and locations to be combined for providing an integrated service. Separation of concerns and reuse of services and components is a major benefit of this infrastructure. The backend interface makes the overall system independent of how the underlying functionality is implemented (e.g. the use of a database system or the search algorithms). [18] The software communicates with the backend via a specified interface, which did not change during the implementation. The frontend sends a search request over HTTP via the Communicator class to the server, and processes the XML response. An example request can be seen in Appendix D. The server would access its image database to create a response of pictures arranged by similarity as implemented on the server. The exact methodology of the backend is not part of this scope and subject to other theses. How
Chapter 4. Implementation/Realization
53
Figure 4.2: The frontend application communicates with the backend server via the Communicator class. The Communicator exchanges XML with the backend and JSON with the frontend library.
the server constructs the delivered results and the quality of the image retrieval is up to the techniques implemented in the server. The server provides a XML response, a shortened example can be found in Appendix D. This XML is parsed by the client-side’s Communicator and transformed into a native JavaScript associative array of item data. The image-ID is used as a key and each contains the grid position (slotX, slotY) and the image URL. Listing 4.1 shows the response in JSON notation. 1
var object = { slotsX : "20" , slotsY : "12" , itemsLength : 200 , items : [
5
160378: { slotX : "16" , slotY : "7" , url : " 0 0 / 0 0 / 16 / 0 3 / 1 6 0 _ F _ 1 6 0 3 7 8 _ v 7 z I a t C d w E B c v i W x G h 0 J k Y z I 5 O p 8 w j . jpg " },
10
40129088: { slotX : "13" , slotY : "6" , url : " 0 0 / 4 0 / 12 / 9 0 / 1 6 0 _ F _ 4 0 1 2 9 0 8 8 _ M 7 4 P 9 U L 2 l t f g P p n U 9 e U 1 h 6 l l 6 l p a M F R Y . jpg " },
15
[...] ] }
Listing 4.1: Extract of the response sent by the backend server on a search request.
Once this array is retrieved, individual loading events are triggered to actually load the images into the browser. Each loading process has callbacks notifying the loader about their status and triggering further actions on completion. This will be discussed in detail in 4.4.
Chapter 4. Implementation/Realization
4.1.2
54
Data set
ColorViewCanvas and the derived implementation are based on the data set of fotolia, a picture database with 22 million pictures. Pictures contain meta data, used to define visual and semantical similarity. This process of information retrieval is performed in the backend and inaccessible by the implementation brought forth here. This is a very specialized data set with very homogenous data. The data received by the backend are processed, bear no outliers and feature all the same meta data fields. Differences to other product data sets are expected and the application was designed to be open for more diverse data. A generalized data set would be more heterogenous, featuring a variety of meta data fields, such as technical specifications, product descriptions, product variants and customizable options. On a picture data set, comparison and search is mostly based on visual features and as such it is easy to limit the visual representation of products to their picture. For diverse product catalogs, this could only be a starting point and would also demand ways to represent other meta data in a meaningful and appealing way. Similarity of products is seldom based on visual features and more on technical or on semantical features. Building an ontology about semantical similarity or using information retrieval to create models of semantical similarity (feature vectors of product meta data) could be the basis to perform search-by-example on more than visual data. Processing this similarity search, again, is up to the backend structure and out of this scope. However, given the backend was able to deliver searches on multiple comparison vectors, the proposed frontend could create product clusters of similarity, like it displays them for visual similarity now. Hierarchical information such as categorization could also be leveraged in this context. How semantical similarity could be displayed independent of visual representation like pictures in an e-commerce context is a topic worthy of more research. Transformation of the data set in the frontend is another important aspect. Based on the search query, a result set is returned by the backend. This result set is displayed by the frontend and the users can be given criteria to influence its form, i.e. by filtering and sorting to help comparison. This was also excluded from the context of this implementation. Table 4.1 shows the additional meta fields. For the implementation of this project, the picture data set was extended client-side by a set of static dummy data. The pixolution backend only provided too limited meta data for testing. Each item received from the backend is extended with additional meta data fields that were filled from a list of names and properties. These fields were used to account for common product meta data and to be used in the frontend visualization as place holders. Not all fields are actually featured
Chapter 4. Implementation/Realization Field Title Company Delivery time Short description
Long description Release data Price
Example Doublecore silvermedia 24 hour shipping Lorem ipsum dolor sit amet, consectetuer adipiscing elit. Lorem ipsum [. . . ] 2013-04-27 9.99
55 Description Product title from random list Author or producer of the product Expected time for delivery One sentence description.
Extended detailed description Publication date of the product Price tag (excluding taxes)
Table 4.1: Table of additional fields of the item’s extended meta information. (Examples for short and long description have been omitted in this table and only contain lorem-ipsum blind text.)
in the final UI. The fotolia picture database would have been another possible source for additional meta data. Its use was considered, but finally rejected. Getting the data from the fotolia database would have required changes to the backend interface, that would have created undesirable external dependencies.
4.1.3
Library
ColorViewCanvas is developed as a library, that can be integrated into a website. The degrees of integration can be handled flexibly, making it possible to create websites only with the ColorView or by having the ColorView integrated in a larger page. The system offers a specified API to setup the library and to bind events - such as the search - from the website to the application. Initialization hooks allow to configure it as deemed necessary by the frontend. The given approach is suitable for multiple appliances, however not for easy public deployment. This was not a design goal. To use the library in actual website installments, the API is well-defined. Interfaces in JavaScript, required HTML elements and CSS definitions for proper usage are documented. This has been maintained for the changes occurring during development of the thesis’ application. Three installments of the library are featured within the project as detailed in 4.1.6.
Chapter 4. Implementation/Realization
4.1.4
56
Dependencies
ColorViewCanvas comes with building dependencies such as Google Closure and JSLint. JSLint3 is a JavaScript code quality tool. It checks the given JavaScript sources for errors and inconsistencies. Closure4 is a JavaScript compiler and optimizer. It recompiles the given JavaScript sources, lints the source code and optimizes it by reducing procedure calls and minimizing variable names and white spaces. This also serves as a simple way to obfuscate the code and to reduce the sources into one common library. The ColorViewCanvas library wraps the underlying low-level JavaScript library, so it can be easily replaced. For this project, it is based on jQuery 5 , a powerful JavaScript API providing easy DOM-manipulation and AJAX methods. Additional widgets, animations and other UI elements are included with jQuery-UI 6 . It originally builds in versions 1.6, 1.7 and 1.8, however only support for version 1.8 was maintained during development. It came with the original ColorViewCanvas and is sparsely used in the current stage of the project, but would serve a valuable asset in the next refinement step. Dealing with several requirements addressed in the previous chapter, new libraries were introduced to the project covering common solutions to anticipated functionalities. Where possible it was decided to build upon reliable and existing projects and feature those libraries. By encapsulating and outsourcing this functionality from the rest of the source code, it remains easy to replace the libraries with newer versions for maintenance, as was done during development. However, there is no automatic dependency management. Using JavaScript package managers like Bower 7 or NPM 8 would have required larger changes to the underlying build environment. For long term project support, these changes are recommended. As overcoming the limitations of navigation in a stateless three-dimensional environment is a major topic, it was necessary to find solutions to write state-changes from the website to the page URL and to persist these changes in the browser history. Since HTML5 the Push/State API is available in all modern browsers to serve exactly this purpose. To offer backwards compatibility to older clients or websites developed with HTML4, the wrapper history.js 9 was created. It creates a simple interface to push and retrieve history states to and from the browser. More about history manipulation is written in 4.7. 3
Website of JSLint: http://www.jslint.com/ Website of Google Closure Tools: https://developers.google.com/closure/ 5 Website of jQuery: http://jquery.com/ 6 Website of jQuery-UI: http://jqueryui.com/ 7 Website of Bower: http://twitter.github.com/bower/ 8 Website of NPM: https://npmjs.org/ 9 Source code repository of history.js: https://github.com/browserstate/history.js 4
Chapter 4. Implementation/Realization
57
For animation and time-based interpolation tween.js 10 has been integrated. Tween.js offers a timing object, with a variety of interpolation algorithms. A Tween is simply defined by the value that is tweened, a targeted end-value and the duration it has to take. For every Tween different callbacks can be defined to notify progress listeners or on finish. Most notable addition to the project is the WebGL toolkit used for abstraction and simplifying access to the browser’s WebGL API. This is discussed in more detail in 4.2
4.1.5
Application structure
As the general application builds upon the existing ColorViewCanvas, the major design architecture was not changed. However, several components were heavily reduced or removed, as others were newly introduced. It was an imperative to stay within the coding guidelines provided with the original source code.
Figure 4.3: The original ColorViewCanvas had most functionality concentrated on the canvas component, including positioning and drawing.
Figure 4.3 shows the original component structure of the project based on the static Hash-Object-notation (see 2.4.2) commonly applied in JavaScript. By convention, instantiated objects are written in lower case; class prototypes in uppercase. pixolution is the root namespace, which contains the colorView-project, the Communicator and the jsLib. The Communicator is the bridge to the backend web service. It handles all communication with the server, requests item search results based on the sent query and returns the parsed search results. jsLib is a wrapper for the underlying JavaScript-library, in this case jQuery, as discussed in 4.1.4. 10
Source code repository of tween.js: https://github.com/sole/tween.js
Chapter 4. Implementation/Realization
58
The pixolution.colorView component is a new context on its own, containing modules for the core-functionalities of the interactive canvas. config holds the default configuration of the system, htmlCode the HTML templates, callbacks various callback handlers and menu, the interactive popup menu embedded in the system. pixolution.colorView.core.canvas is the main component containing all functionalities for display and interaction. The imageloader handles downloading of the pictures the search results returned, which are then positioned and drawn on the canvas by the drawing component. interaction initializes the event handling, dragging and all other kinds of interaction with the canvas. Each component has its own namespace to ensure a separation of concerns. Calls to other components are always static. Based on this architecture, the following changes have been introduced. The new structural diagram can be seen in 4.4. New components were created for visual transformations, 3D controls, extended data handling and hypertext functionalities.
Figure 4.4: The new ColorViewCanvas has additional submodules wrapping functionalities to external libraries (history.js, tween.js, . . . ) and a new module for WebGL handling. Bold labeled modules have been introduced to the project, italic written modules have been heavily modified.
visual contains several implementations for spatial data arrangements. The implemented views are discussed in more detail in 4.6.1. The modules data, history and storage were introduced as wrappers that deal with data storage and persistence. The storage is a wrapper to the browser’s LocalStorage access, history wraps the history.js library also discussed in 4.1.4. The biggest new module is the webgl component, which contains the initialization of the renderers, camera, controls, the scene and interaction callbacks.
Chapter 4. Implementation/Realization
59
In the original ColorViewCanvas, all objects are initializated as static objects. The derived implementation features classes, that are only instantiated on runtime. Publisher is part of the publish-message-system employed in the application. It registers listeners, which are called, when certain events are published. Item is a general product item and is instantiated as the results array from the backend is processed. Item contains the meta data of the product displayed, coordinate and location data of the object to display in 3D space and initializers for binding interaction to the representation. WrapCanvas encapsulates all functionality required for the infinitely wrapping canvas implemented in the project and discussed in 4.6.3 and 4.9.1. Third-party and vendor libraries are not compiled with the rest of the library, to allow easy substitution for version maintenance. Some dependency libraries like three.js come with additional plugins, that extend the library. If the module did not require custom changes during development, it has been placed along side the library. There were exceptions regarding the interaction control classes for three.js. As they have been customized, they are integrated functionally in the library and delivered with the compilation. However, they have not been rewritten to fit into the architectural structure of the rest of the ColorViewCanvas library. This was decided in order to keep changes to these modules to a minimum and keep maintenance simple by allowing upstream changes to merge back into the modules. This decision was the basis for introducing the DragSurfaceControls not as a component within the libraries architecture, but also alongside the other control classes (TrackballControls and OrbitControls).
4.1.6
Frontend
As elaborated in the requirements in 3.3.2, the project is focused on the client-side frontend development. Only certain aspects of shopping taxonomy are of concern, mainly item visualization, navigation, User interface and the basic user flow. As such it is a testbed for interactive WebGL for the visualization of product data. It does not feature user registration, purchase and only features the option to redirect to other services offering the actual e-commerce transaction infrastructure. ColorViewCanvas is developed as a library to be used in multiple installments. Using Google Closure, it is optimized and compiled for production deployment. As it is difficult to debug the library after compilation, the ColorViewCanvas project provided a development installment (see Figure 4.6) of the library. The development environment featured an integration with only very basic graphics and is used for quick function tests and previews, without the need to recompile the library on every change. Figure 4.5 shows the general architecture of any implementation and the differentiation between
Chapter 4. Implementation/Realization
60
Figure 4.5: Any use of the library in a website follows this architecture. The website integrates the libraries dependencies, the library itself and the overriding custom styles and scripts.
dependencies, the core library and custom styles/scripts. In order to create the actual frontend, the library was embedded in the website and configured through the external interfaces defined in 4.1.3.
Figure 4.6: The development installment was provided by the ColorViewCanvas library and extended to feature additional customizations to the scene.
A second implementation is an example given by the original ColorViewCanvas library simply depicting the pictures on a gray area. This example has been restored using the new technologies. This can be seen in Figure 4.7. Lastly a third installment called Balcony has been designed around a simple interface with a minimal aesthetic design (see Figure 4.8). Balcony’s design builds on the visual metaphor of a balcony from which to look upon the data layed out in front. This installment serves as live implementation of the system in order to demonstrate behavior
Chapter 4. Implementation/Realization
61
Figure 4.7: This example imitates the behavior of the original ColorViewCanvas.
and appearance. It puts the search in the center and provides a list of categories as starting points for exploration.
Figure 4.8: Balcony is an example for a production-like deployment. It demonstrates a possible integration of the new ColorViewCanvas.
Each implementation overrides the default configuration of the library where necessary and builds on top of the default style with a customized stylesheet. In each implementation the Application Control [21] is performed using dynamic HTML and JavaScript, thereby communicating the application’s processes to the user. All control interfaces are integrated in the website, which contains the Virtual Environment. Overlay interface elements are layouted on the website’s 2D plane, above or outside the 3D item space, thereby creating a seamless coherent look, keeping directness and immersion. Communicating activity in the User Interface is aided by the use of discreet animations (e.g. fade transitions when mouse hovers over item; example-by-search on a product lets the item pulsate).
Chapter 4. Implementation/Realization
62
To account for browser compatibility issues, the original ColorViewCanvas was designed with multiple fallbacks, in case the browser would not support a specific features. For example there were alternative means of drawing the wrapping canvas in case the HTML5 canvas element was not available. These fallbacks have been discontinued and were no longer used in the further implementation. By this decision, the project is targeted to modern systems only and should be regarded experimental. For a possible use in production, fallbacks need to be reintroduced. This were beyond the scope of this project (see 3.3.4).
4.1.7
Deployment
After compiling the library and integrating it into an actual web page, deployment to a server is the last topic regarding the basic infrastructure of the project. As predefined in the deployment requirements in 3.3.3, the frontend is not accounting for the backend solution on which the software depends. The backend server needs to be set up and maintained independently - in this case by pixolution. Its connection is defined in the configuration of the ColorViewCanvas library. The actual deployment of the website is performed by uploading the application with all required files on a suitable web space and accessing it with a common browser. Any HTTP server delivering static files is sufficient, as all execution is done client-side by the JavaScript runtime environment of the web browser. The compiled project only consists of HTML, CSS, JavaScript and image files. In its minimal configuration, the project can be opened locally by simply accessing the index.html file from the file system in the local web browser. (See Appendix B on the attached CD). However, additional functionality will require the application to run on an HTTP server that can serve HTTP requests. For the purpose of local testing and execution of the installements mentioned in 4.1.6, a small stand-alone server is provided with this thesis. This Java-based HTTP server is based on ClayServer 11 . ClayServer was not developed during this thesis and only serves as a simple preview for the project. All resources for running this thesis’ project are bundled inside the executable jar. Executing ClayServer opens a compact GUI and an HTTP server, providing a URL to open the project in the web browser. Appendix C gives a short overview on the organization of ClayServer and a screenshot of the UI. Appendix B gives an overview on the contents of the attached CD and where to find the executable. 11
Repository of ClayServer: https://github.com/ctdp/ClayServer
Chapter 4. Implementation/Realization
4.2
63
WebGL toolkit
As elaborated in 2.4.5, WebGL itself is only a JavaScript programming API within the browser’s Document Object Model. The DOM is a set of objects and functions within the JavaScript context of a website and can be used to bind events or address element nodes of the HTML document structure. The WebGL specification allows to initialize an OpenGL context on an HTML5 canvas object. This context can be used to create a scene buffer, bind shaders and draw primitives into the buffer. The specification is based on OpenGL ES and is therefore very basic and with a low level of abstraction. Yet, it still provides all interfaces necessary for powerful modern 3D imagery. [37] While WebGL itself may already provide everything required to create 3D applications, it is not a web developer friendly interface and its true potential can unfold much easier by using one of the WebGL frameworks or toolkits, that emerged in the past years. The following sections will discuss the chosen toolkit and shortly present other choices available for production use.
4.2.1
three.js
The toolkit three.js 12 was chosen to handle the WebGL programming in this thesis, as it was the best documented and best maintained library with active community support. Three.js was started by Ricardo Cabello Miguel in April 2010. The goal of the project was to create a simple object oriented wrapper for WebGL programming featuring a rich API for shaders, lights, camera, animation and general math. The library is licensed with an Open Source MIT-license, gained wide support and a strong community, which helped to extend and push development. Three.js comes with a large set of examples demonstrating shaders, interaction, renderers and animation. [48] The library of three.js only contains the core functionality, which can be extended easily through additional plugins. Some plugins for the library, like renderers or interaction controls are provided by the toolkit under the same license. Simple atomic examples demonstrate the use of all plugins and the library in general. Especially interesting in three.js is, that the rendering interface is not limited to WebGL. Multiple renderer classes are provided, serving the WebGL API (WebGLRenderer ), implementing a software renderer (CanvasRenderer), rendering 3D environments with SVG (SVGRenderer ) or even CSS (CSS3DRenderer ). The latter becoming particularly 12
Website of three.js: http://mrdoob.github.com/three.js/
Chapter 4. Implementation/Realization
64
interesting later in 4.3.2. Most of these renderers have to be regarded as experimental at this stage, but provide a proof-of-concept and display possible future directions. Renderers will be discussed in more detail in 4.3. With the active community and a relatively new technology like WebGL, development with a cutting edge library also has its disadvantages. The toolkits API is not yet stable and - despite being in development for over two years - changes frequently. Every couple of months a new revision is released, which serves as a stable development base. All changes to the API are well documented. Issues and complications arise, when source code using three.js is shared between multiple revisions. This can happen as documentation is not updated or as support questions only relate to older revisions. For the actual development it proofed valuable to decide on one revision and keep developing with it, even though newer revisions were released in the meantime. Migration to a newer version in a single step proofed easier, than keeping up with the edge releases. This project is based on revision r54 released on 2012-12-25.
4.2.2
sim.js
In his book about WebGL, Tony Parisi (2012) presents a light-weight library constructed on top of three.js called sim.js 13 . [37] Sim.js provides a minimal application structure and object-scene abstraction for interactive 3D environments and is used throughout the examples in his WebGL-book. [37] Sim.js was used in several prototypes for this thesis and was even integrated with the main project at an early stage of development. It was created for three.js revision r46, so compatibility with the used revision r54 became an issue. As the application took shape, less features provided by the library were required, until it was removed entirely. The library’s focus and strength lies on the easy management of vertex-based 3D-objects in a WebGL-Renderer scene. Binding interactivity and its integrated publish-messagesystem makes it a good basis for WebGL-prototyping.
4.2.3
Other considered WebGL toolkits
Next to three.js, other toolkits were taken into considerations. Although they were not chosen for the implementation for various reasons, they should not be discarded entirely, as each has different strengths worth exploring. It should be noted, that game engines are excluded from this list. Game engines provide a level of abstraction, that may feature the 13
Source repository of sim.js: https://github.com/tparisi/WebGLBook
Chapter 4. Implementation/Realization
65
functionality required for this thesis’ software, but would also add considerable overhead in unused functionality. One of the oldest WebGL toolkits is GLGE 14 . Its development began early after the release of the WebGL specification in 2010. The framework has a rich - even heavy API, featuring scene graph, object-abstraction, camera, lighting, and large support for various file formats. The toolkit is Open Source licensed under three-point BSD-license. It has a large community, still offering good support, although the active development stopped in late 2011. Since then, work has begun on a rewrite of the library from scratch, but did not yet result in a new release. SceneJS 15 is a toolkit specialized for dealing with large amounts of interactive objects. As such it would be a good choice for Information-rich Virtual Environment implementations, as has been shown with the BioDigital Human 16 . SceneJS features a rich API for data import, a messaging system implementation, predefined shaders and a scene graph. Updates to the library are infrequent, last development updates published in 2012. The library is dual licensed under MIT License and the GNU General Public License (GPL) Version 2. CubicVR 17 is a dual-library developed for JavaScript and C++, which makes it interesting for cross-language developments. It provides a rich API and good examples. It features a small community, however, with little activity compared to other libraries. It is frequently updated and MIT licensed. Developed by SenchaLabs is PhiloGL18 and it specializes on interactive data visualization in 3D. As shown in numerous examples, it is ideal as basis of IRVE implementations. PhiloGL is under MIT License. CopperLicht 19 is focused on realistic naturalistic Virtual environments. The library itself is provided for free, however for access to the source code or commercial use a purchased license is required. Since WebGL has still to be considered experimental technology, problems with the toolkit are to be expected. Therefore choosing a free and Open Source toolkit was the better choice. Notable, as its following a different paradigm, is X3DOM 20 . As discussed in 2.4.4 there are two approaches to rendering 3D graphics in the web. All libraries discussed so far follow the imperative approach as defined in the requirements in Chapter 3. X3DOM is 14
Website Website 16 Website 17 Website 18 Website 19 Website 20 Website 15
of of of of of of of
GLGE Library/Toolkit: http://www.glge.org/ SceneJS Library/Toolkit: http://www.scenejs.org/ Biodigital Human: http://www.biodigital.com/biodigital-human.html CubicVR Library/Toolkit: http://www.cubicvr.org/ PhiloGL: http://www.senchalabs.org/philogl/ CopperLicht Library/Toolkit: http://www.ambiera.com/copperlicht/ X3DOM: http://x3dom.org
Chapter 4. Implementation/Realization
66
based on the WebGL API, but provides a declarative interface for X3D, to render X3D content only with WebGL and JavaScript without the need of additional plugins. X3D - as explained in 2.4.4 - is an XML specification for 3D geometry and interaction. The goal of X3DOM is to allow integration of the X3D XML code within the HTML source code and by this providing the DOM integration of 3D scene discussed in 3.2.4. While this is an interesting proof-of-concept for the convergence of imperative and declarative Web3D, the project is not yet in a state to support all requirements put forward for this project, especially in regards to programming as it is afforded by the imperative Web3D approach. X3DOM is dual licensed under the MIT and GPL licenses.
4.3
Rendering modes
One of the strengths of three.js is the flexible rendering interface. While the toolkit is primarily developed for the WebGL API, numerous additional renderer implementations are provided addressing different interfaces in the browser to create 3D environments. General differences between the renderers are in performance, capabilities and compatibility. These renderers are available for three.js:
WebGLRenderer renders 3D graphics to the WebGL API and will be discussed in detail in 4.3.1. CSS3DRenderer uses CSS-transforms to render HTML elements in 3D space and will be discussed in 4.3.2. SVGRenderer creates a SVG element within the DOM in which the SVG-data to draw the 3D scene is written by the renderer and displayed by the browser. CanvasRenderer renders the 3D scene in the HTML canvas context by software without GPU-acceleration.
Changing the renderer allows to ensure backwards compatibility: if WebGL should not be available in the browser, CanvasRenderer can be used as fallback. Regardless of the chosen Renderer, the rendering process itself is performed on the client-side by the web browser. Each renderer fulfills a simple interface, expecting function implementations for render and setSize. The former function renders the current state of the scene graph to the output format of the renderer. WebGLRenderer renders to GPU, CSS3D updates the CSS-transform properties of all HTML elements included in the scene graph. To display changes to the scene, render needs to be called, to redraw the scene. This redraw can
Chapter 4. Implementation/Realization
67
either happen continuously by a rendering loop or can be triggered on demand, when changes in the scene are published. Continuous redraw has been implemented by the previous implementations analyzed in 3.4 causing the detriment of high GPU usage and high energy consumption. In this project, redraw is only called when elements in the 3D scene publish state changes to the messaging system, thereby triggering the rendering process. If the scene is static and does not change, it is drawn once and is only redrawn when e.g. animations are triggered. This keeps the GPU usage to a minimum and saves battery. The following sections deal with the regular WebGLRenderer and the CSS3DRenderer. Both have different underlying principles, a different set of features and a different set of use cases in the project.
4.3.1
WebGLRenderer
The default renderer of three.js is the WebGLRenderer. It accesses the web clients WebGL-API and thus renders GPU-accelerated 3D graphics. WebGLRenderer internally builds on the OpenGL ES Shader Level 2.0, with all the capabilities inherited. WebGLRenderer allows to render 3D geometry with textures and shaders. Object picking in 3D space is possible via three.js’ THREE.Raycaster API. Objects in 3D space are JavaScript objects, to which events can be attached. Interaction with the surrounding website is possible. In the context of this thesis, the renderer has certain disadvantages. Product visualization in the scope of this thesis is not about visualizing 3D models of products, but about visualizing the relationship and similarity between product items. Products need a graphical representation, that allows to show preview pictures as well as textual information. Combining the structured content HTML offers with the 3D capabilities of WebGL is not yet possible.
Figure 4.9:
Visualization using CSS-transforms renderer and debug view using WebGL renderer.
Chapter 4. Implementation/Realization
68
WebGLRenderer was initially used creating a 3D scene with plane geometry for each product item. Each plane had the product preview picture mapped as a texture. Interactivity was possible, however representation was limited, as textual information were unavailable. Instead the further development was switched to CSS3DRenderer, keeping WebGLRenderer for debugging purposes as an alternative development mode (see Figure 4.9).
4.3.2
CSS3DRenderer
CSS3DRenderer has a different working principle. It does not render to the WebGL API, but uses the CSS3 specification for CSS-transforms to transform HTML elements in a three-dimensional space. The HTML elements remain in the context of the website and their position is styled by the CSS layout engine. CSS-transforms have been discussed in 2.4.3. At the time of this writing in early 2013, Safari, Chrome and any other browsers derived from the Webkit engine support CSS-transforms. Firefox featured support since version 19 and Internet Explorer 10 has been announced featuring partial support. The browser implementations vary in performance, depending on the use of OpenGL for CSS-transforms rendering. Mobile browsers usually do not have WebGL activated, but still feature CSS-transforms support. three.js enables the use of this CSS module by providing a client-side abstraction layer to CSS-transforms. The toolkits API treats the CSS3D space as any other 3D space, only that it is limited to special THREE.CSS3DObjects. The CSS3DObject is a wrapper for the HTML element that is to be transformed in 3D space and thus is handled like any other 3D-object in three.js. Any changes performed in the scene graph are mapped to CSS style properties by the renderer. The actual drawing is then performed by the browser. In the scope of this project, this technology offered several advantages that prompted the decision to base the visualization on this renderer. Using CSS-transforms allows to leverage the 2D layout capabilities of CSS and to apply them to surfaces in 3D. These elements can be fully styled with CSS and have high potential for being visually appealing and practically styled designs. Interaction and manipulation using CSS and JavaScript is as powerful as with any other HTML element of the website. UI toolkits like jQuery-UI can be applied without limitations. Since the actual 3D context is not isolated from the site, but rather applied onto existing HTML elements, the integration of 3D in the website is as tight as possible. HTML elements
Chapter 4. Implementation/Realization
69
declared in the HTML source code retain their semantical information. Search engine bots can parse the website and capture contents relevant for search engine indexing. The same applies to accessibility devices like screen readers for visually impaired people. Having the contents structurally available in the DOM allows for multiple additional use cases, that are impossible to fulfill in the imperative approach alone. There were some drawbacks by the decision to use CSS3DRenderer to be considered. CSS3DRenderer only applies 3D to HTML elements. It is not possible to render vertexbased 3D geometry and CSS3D objects in the same render pass. This limits several visual options and prohibits the use of debug visualizations within the 3D scene. In order to be able to use visual helpers like camera- or axis-visualizations, the project implementation allowed for easy switching between CSS3D and WebGL renderer for debugging purposes. CSS3D is interesting in scientific terms, because it breaks the division between Declarative 3D and Imperative 3D, defined in 2.4.4. The HTML elements are declared in HTML, 3D transformation is applied using CSS. By using three.js as abstraction layer, an Imperative API is provided to enable procedural manipulation and thus interactivity.
4.4
Data flow
The goal was to produce a very interactive and pleasant user experience as defined in 3.2.5. The challenge thereby is to find a balance between a continuous user interaction, without interruptions like page reloads and the reloading behavior expected from other web shops. This challenge has been addressed by creating a single-page application. The website is loaded and the JavaScript application i.e. Balcony is initialized once. All links are bound via JavaScript to update the current page, instead of reloading anew. With every major interaction (item selection, search action), the interface is updated, as is the website’s URL to account for the state changes and to be able to restore to the current state later on. More about the history and permalink implementation will be in 4.7. In order to provide a quick loading process, the application has been parallelized where possible. Requests to the backend server are asynchronous, so are response handling and drawing. Asynchronous means, that the process does not wait for the response. Instead a callback function is defined, that is executed, once the process is finished. For a similarity search request, this process is illustrated in Figure 4.10. A new Job is created based on certain search criteria (item-IDs, color, keywords, . . . ). This job request is sent to the backend server, processed and responded with a result set. The exact data
Chapter 4. Implementation/Realization
70
Figure 4.10: A search is requested by the frontend application, responded by the backend and subsequently processed asynchronously.
formats have already been discussed in 4.1.1. The frontend application receives a JSON data array with the size of the grid and the list of pictures. At this point, the basic scene can be reconfigured to account for the new data array sizes. Also the list of new items allows to start the process of substituting the visualized items. The substitution describes the transition of one result set to the next. This is performed in three steps, each smoothly animated, to visually explain the user, what is happening. The first step of this transitioning process is analyzing the current result with the new set and isolating the new elements, the existing elements and the removable elements and saving each in an own data container. The next step is also the first visual one, as all removable elements are removed from the scene using a fade out transition. Once this step is completed, the existing elements, that are both in the new and in the old result set are repositioned with a tweened animation. Adding the new items to the scene is the last visual step. The items fly from a point in the background relative to the camera into position. The last step is the internal replacement of the current item data array. In each step a series of asynchronous calls is triggered (especially in regards to animations), which results in quick response time by the system and the impression, that each step is performed in parallel. This can result in much screen activity, as up to 200 items move across the screen. The order in which items appear is only defined by the order in which the loading is finished by the web browser. Transition times take longer on slow connections, on fast connections the transitions are faster, but also more crowded. All transitions are animated using tween.js. Listing 4.2 shows a small usage example. tween.js offered numerous interpolations including linear, quadratic, cubic, bouncy and
Chapter 4. Implementation/Realization
71
elastic. The perception of result set transition is influenced heavily by the choice of the interpolation and its duration time. For the implementation simple linear interpolations were chosen for fades, whereas item movement features exponential interpolation. 1
new TWEEN . Tween ( { opacity : 1.0} ) . to (
{ opacity : 0.0} , 5000)
. onUpdate ( function () { console . log ( this . opacity ) ; 5
}) . onComplete ( callbackA ) . start () ;
Listing 4.2: tween.js example with the duration 5000 miliseconds between the source opacity 1.0 and target 0.0. On every update, the current opacity is logged on the console and on completion the function callbackA is called.
Searches can be triggered either by the search field or by similarity search based on an item. Each usage event is tracked as discussed in 4.8. With every search-by-example, the users refine their search results.
4.5
Navigation
In 3.2 the two major navigation techniques of Search-based and Browser-based navigation were described as basis for the navigation concepts implemented in this project. Search-based navigation is straight-forward, provided by input fields to fill in various search criteria inherited from ColorViewCanvas:
Color Pictures of similar color are queried. Keywords One or more comma-separated keywords are used to find items. Picture URL The given picture is analyzed and a search-by-example is performed. ID Unique identifier of a product, that will be used for search-by-example.
These criteria can be combined to refine search results. The challenge is to provide a user interface that supports these criteria and successfully communicates its use to the users. As established in 3.2.2, most users do not take advantage of advanced searches such as boolean-search. The search interface of ColorViewCanvas is also specialized for picture search and thus targets a special experienced audience. Depending on the web shops target group, this interface requires simplification.
Chapter 4. Implementation/Realization
72
The search interface implemented in the Balcony example features only one search field. On search, the content is parsed and either treated as an integer ID, a color hex value, a keyword string or an example picture URL. This limits the search to one possible criteria field. It is possible to combine multiple fields. Creating a structured search syntax for the search field would be one approach that would again have the problems other advanced searches have. Another approach is making search criteria dynamically editable. The latter approach would give the user a set of criteria to define the search. The search field would add the new criteria to the list and trigger a new search using all criteria. Deletion of single criteria would be possible as well as clearing the complete set to start an entirely new search. This approach was not implemented. Search criteria are written to the URL as parameters. This URL can be shared among users resulting in very similar search results. Search results are not identical for a shared URL, this is explained in 4.7. The Browse-based navigation of the application follows a different navigation concept than most web shop solutions. The system does not rely on a hierarchical data structure, features no categories and browsing can only be performed by similarity. By means of Content Based Retrieval (CBR), the users refine their search using the closest product item as reference for the next search result. Starting from a random search result set, this click stream of searches can be very long, so a quick entry point based on 20 search keywords resembling basic categories was provided. This offers an implicit categorical organization, which is not hierarchical. Navigation by query was a navigation principle for queried searches in a Virtual environment, described in 3.2.2. This concept contained two ideas, both implemented in the project. The first idea, as already elaborated, is the use of CBR for search-by-example searches. The second idea is to provide a local search within the given 3D scene. This can be done by leveraging the local browser’s document full-text search, provided that the search term is a displayed textual element of the HTML structure. The data visualization changes the scene accordingly to display the highlighted results. On each product item two actions can be performed. It can either be used for a searchby-example or it can be focused to access additional information. Focus is based on Object Selection (see 3.2) and is usually performed in 3D spaces by raytracing or picking implementations. [21] Since this implementation is based on CSS-transforms, such solutions are not necessary, as the browser handles all picking automatically. Once the object is selected, the camera flies towards and aligns with it. The camera’s path is an exponential interpolation using tween.js. More sophisticated methods for
Chapter 4. Implementation/Realization
73
camera path interpolation could be used to improve aesthetics or to create more realistic movements, for example to avoid flying through objects.
4.6
Spatial data organization
The interactive product item visualization has been separated into two concerns, the spatial data organization and the interaction controls. Both were implemented as individual components in the system architecture. This allowed for the biggest flexibility in testing and trying multiple variations on controls and data formations. The spatial data arrangements are not bound to one specific type of data. Meta data for an item have a set of mandatory and optional properties. Optional properties are product information, while mandatory properties are configuration values required for display. These are provided by the backend, examples being the item ID, picture URL, X and Y slot indices. The result sets returned by the backend are not just an one-dimensional list of items, but a two-dimensional array of elements. The width and height of this array are encoded in the response and every item has its X and Y Slot coordinate within this array. The array is arranged by similarity as calculated by the backend. Based on this array, all other visual arrangements discussed below are seeded, keeping the basic visual similarity arrangement where possible. The visualized product element is an HTML element displaying the preview-image and two actions for focus (moves the camera towards it and highlights the item) and similarity search (trigger search-by-example). Additional meta data can be added to the HTML code and styled in the related CSS. As already elaborated, styling is not the major concern at this point, but enabling the use of flexible custom CSS solutions later on is. This thesis only includes a basic style for the product elements and the websites layout. This is the domain of a professional Screen designers, who should be involved in a production implementation. The next sections will describe the implemented visual arrangements.
4.6.1
Visual arrangements
To determine the general direction for the visual arrangement based on the given data array, various layouts were experimentally implemented. These implementations are located in the pixolution.colorView.core.canvas.visual component. Each shares
Chapter 4. Implementation/Realization
74
the same interface and can be switched during runtime. On switch, the items in the 3D scene transition in a smooth animation. One of these implementations was selected and later refined by correcting bugs, improving usability and creating a custom set of locomotion controls.
Figure 4.11: Product items in ball arrangement. This visualization was experimental and not developed to full usability.
Figure 4.11 shows the arrangement in a ball. The size depends on the number of elements. The space between the elements can be defined in the source code.
Figure 4.12: Product items are displayed in helix arrangement. This visualization was experimental and not developed to full usability.
The helix arrangement is displayed in Figure 4.12. Again, spacing can be adjusted in the source code. This loosely follows the arrangement of items in the Google Bookcase presented in 3.4.2.2.
Chapter 4. Implementation/Realization
75
Figure 4.13: Product items are displayed in surface arrangement based on a 2D array. This visualization was chosen for sophisticated implementation.
The third arrangement Figure 4.13 is a grid-based surface and can be setup to either display the items as tiles on a surface or as vertical elements on a data mountain by adjusting the element angle. Again, size and margins are configurable. This visual arrangement was chosen as the basis for further refined interaction development. In 4.6.3 the final implementation is presented including the customized controls.
4.6.2
Camera and controls
Ensuring ideal viewing parameters for the camera during locomotion through the 3D environment are important for usability and acceptance of the proposed user interface. In order to experiment with camera interaction, multiple camera controls have been integrated and implemented. Starting point for the control interface were controls provided by three.js (see 4.2.1). TrackballControls and OrbitControls are both example controls provided to display good implementations and familiarize with the interface. It is promoted to base new controls on these existing ones. Additional controls have been provided by the community. TrackballControls and OrbitControls are similar as they define a central point around which the camera rotates. Different is the way rotation is applied to the camera, when the mouse is dragged on the viewport. On OrbitControl’s rotation around the Y axis, it does not influence the other axis. In the TrackballControls rotation is defined by the XY-coordinates of the mouse movement on the viewport. Thus mouse drags towards the edges of the viewport result in tilting of the camera.
Chapter 4. Implementation/Realization
76
Both controls have touch support for tablets and phones. This has also been applied to the new controls, although in a rudimentary way only. Newly implemented is DragSurfaceControl, customized controls for DragSurface visualization. This is described in more detail in the next section 4.6.3.
4.6.3
DragSurface
The DragSurface describes a variation on the data mountain visualization in combination with a custom dragging control. The visualization is based on a tilted surface (or tilted camera) and displays the twodimensional data array given by the backend on an infinite surface. It is a variation of data mountain in which the angle of the elements on the surface is adjustable (see Figure 4.14). On a traditional data mountain, the elements are orthogonal on the plane. In the Balcony example installment, the DragSurface was not configured to resemble a data mountain. The elements are arranged flat on the surface.
Figure 4.14: The illustration shows how the angle of the items turns the surface into a data mountain.
Both, data mountain and surface are not good choices for hierarchical data as legibility of text is reduced by distance. [8] [10] However, the perspective nature allows to show more elements on the screen and to easily gain a global view. Locomotion on the surface is provided by a custom camera control class called DragSurfaceControls. Implementation is loosely based on the TrackballControls, but has a different locomotion principle. Movement on the elements surface is provided by mouse drag and touch/swipe gestures. The movement speed on the projected surface and the mouse movement on the viewport is not 1:1, as this was perceived very slow. Instead an interpolated drag was chosen instead of static linear drag for exponential fluent movements. Once the viewport leaves the boundaries of the element array on the surface, elements from the off-camera farside of the array are moved into the viewport, thereby creating
Chapter 4. Implementation/Realization
77
the impression of a surface of infinite size. However, the number of elements displayed is finite. The impression of infinity is created by repeating the same elements periodically. To implement the wrapping functionality of the DragSurface, the problem was separated into two isolated domains:
Infinite wrapping Implementation details to the infinite wrapping are detailed in 4.9.1. The challenge was addressed by reducing the issue to the XY-plane and calculating the world coordinates to the array coordinates based on a 2D window. Viewport projection The 2D window required for the infinite wrapping is the bounding box of the camera frustum’s projection on the XY plane. This implementation is detailed in 4.9.2.
Gesture support for touch devices is reused from TrackBall- and OrbitControls, however the finger gestures for Manipulation assignments was changed and now resemble the conventions of established concepts: Swiping with one finger drags the surface, twofinger swiping zooms the camera. Rotation was removed entirely. Touch controls are working, but slow and only at a stage of proof-of-concept. More optimization is required for the touch controls to be practical to use.
4.6.4
Customization
Adaptable customization techniques were discussed in the in 3.2.6. Customization options were implemented for the development website in order to quickly experiment with different settings for the selected visualization and interaction. Changes to each setting updates the scene instantly. Available settings are the Field of View, defined by an angle ranging from 0-90, thus experimenting with the effects on overview and distortion. A good compromise was found at 55. The camera angle to the drag surface is adjustable. However, this should be used with caution. Low angles result in artifacts in the visualization, because the camera projection on the XY-plane fails once the camera does not penetrate the plane any more. More on this subject in 4.9.2. Mostly for debugging, the zoom level can be adjusted. The zoom level can be changed on an absolute scale or by multiplying a zoom factor. For the DragSurface, the item angle can be adjusted, turning the surface into a data mountain.
Chapter 4. Implementation/Realization
78
In the Balcony production-like installment, most configuration options are inaccessible by the common user. In order to keep the confusion to a minimum, the best settings from experimentation in the developer mode have been applied as default settings.
4.7
History and persistence
In the requirements in 3.2 a list of common web and online shopping taxonomies has been defined. Among the hypertext related actions (see 3.2.4) defined were permalink handling and history. The mentioned features are inherited from the hypertext document management, the Web was designed for. Websites used to be static and stateless, following the link to a new website pushed a new step in the history managed by the browser. The website’s URL was a unique identifier to address a specific content. With the emergence of AJAX and single-page websites, this changed. Websites are not static any more, change dynamically and reload contents on the fly. In order to still provide the comfort of using the browser’s history and URL features, their support has to be implemented manually in JavaScript accessing the APIs provided for this purpose. This also applies to a 3D virtual environment embedded in the website. To implement the known taxonomies, it requires a certain degree of state persistence in an otherwise stateless application. Persistence can be managed in different scopes. [49]
Request scope Context for one request/response-cycle to the server. Data within this context is lost once the request is finished. Session scope Data can be stored for a session of multiple page requests. Data can be saved in multiple domains. (Cookie, Web Storage21 ) Data within the session is lost, when a new session is created. Global scope Data is persisted globally across multiple sessions. This can be achieved server-side by using databases.
Finer separation of contexts is possible, but not necessary for the background of this thesis. With single-page JavaScript web applications, the differentiation between request context and session scope dissolves. The actual website is loaded once from the server and changes dynamically by reloading data asynchronously on interaction with the site. In 21 Web storage is the specification of an HTML5 JavaScript interface, that implements an associative array data model. It can be used for both, session context, as well as application context.
Chapter 4. Implementation/Realization
79
this case, the Request scope has the same scope as the session scope , as long as the page is not reloaded manually. In order to use the browser’s history and back-button functionality, the Push/State API has to be accessed via the DOM. This API is implemented in all modern browsers, however, to ease the use of the API and to feature backward compatibility the library history.js 22 was used. History . pushState ({ state :1} , " Page title 1" , "? state =1") ;
1
// = > { state :1} , " Page title 1" , "? state =1" History . pushState ({ state :2} , " Page title 2" , "? state =2") ; // = > { state :2} , " Page title 2" , "? state =2" History . back () ; // = > { state :1} , " Page title 1" , "? state =2"
5
History . go (2) ; // = > { state :2} , " Page title 2" , "? state =2"
Listing 4.3: Example of pushing and popping states to the history stack.
The browser history is represented by a stack, the use of which is shortly examplified in Listing 4.3. The new history state is pushed onto the stack including the page title and the access URL. The back-button pops the newest element from the history stack and returns its state. States are thus bound to the URL and can be made available outside of the website. However, as the history state is only stored in the Request context, the application will require to parse the URL to restore the state from the given parameters. As part of the new implementation of ColorViewCanvas, two events are pushed to the history: Search stores the search query, both for input search or similarity search. Item focus stores the ID of the item that is focused. After navigating through the scene and performing multiple searches, this lets the users return and revisit previously accessed items. Both events write parameters to the URL to allow a retrieval of the search result and refocus the selected element. However in the current implementation these search results are only an approximation of the original search result set. The system does not store the exact position and order of the items in the data array. Rerunning the search with the same parameters will result in a slightly different set of results. The full recovery of search results is not possible at this point. To address this issue, more refined ways of data persistence are required, than were implemented in the application. This feature would require a data storage layer, that saves each search detail - including all item positions and meta data. This kind of persistence could be implemented for either the Session scope (to be at least available in the same browser) or the Global scope (to be accessible anywhere). 22
Source code repository of history.js: https://github.com/browserstate/history.js
Chapter 4. Implementation/Realization
80
Full search persistence in the Session context could be done client-side in the browser by means of Web storage or Cookies. Being in Session scope, search results would not be available across multiple sessions. This would limit the possibility of sharing search results with other users by passing a permanent URL. To account for this feature, the result storage would have to be in the Global scope. This could be done by at least two simple, although not efficient ways. Either on the server-side by storing every search result in a backend database in an associative data array, which is retrieved by requesting the results of a search key through the search API or client-side by providing a flexible permalink URL scheme, which encodes all required details as parameters in the URL. The solution to this problem is not specific to the domain outlined in this thesis, but has to be addressed by any kind of complex search. The original ColorViewCanvas implementation provided an interface for state storage in the Session scope. However its implementation was not stable and the feature was not further developed in the scope of this implementation. The application itself does not feature additional caching. All caching is performed by the browser as with any other website. Data compression, server-side-caching and other strategies for performance optimization can be applied, but these measures are not specific to the system and depend on the web server used for providing the files. They are rather general recommendations for any website.
4.8
Tracking and adaptive techniques
As elaborated in 3.2.6, adaptive techniques are not in focus of the frontend implementation of this thesis’ software. Adaptive techniques could be implemented on the backend site by tracking customer behavior to collect raw data on which semantical relations could be inferred. Similar approaches have been proposed, but are not within the scope of this thesis. Still, adaptive techniques can be applied to the frontend by collecting client-side usage data through user tracking services such as Google Analytics 23 or Piwik 24 . By tracking user behavior on the site valuable information about the applications performance in regard of sales conversion and user binding can be derived. After all, in an e-commerce context sales and marketing are important aspects. Development of an application without means of performance evaluation of the system, would be a serious shortcoming in the software. 23 24
Website of Google Analytics: http://www.google.com/analytics/ Website of Piwik: http://piwik.org/
Chapter 4. Implementation/Realization
81
The proposed interface abstracts from the underlying tracking service to track user visits and send selected usage events. Using the existing message-publishing system, search and focus events are published to the tracking component, which communicates the events to the external tracking service.
4.9
Encountered challenges
The following section will deal with some technical challenges, that were encountered during the implementation. They relate to specific characteristics of the software and less about generalized approaches.
4.9.1
Infinite Wrapping Grid
As elaborated in 4.6 the items in the data set are stored in a two-dimensional array, a grid with a defined width and height. Every cell in the grid can be addressed by slot coordinates.
Figure 4.15: Wrapping is achieved by creating a canvas twice the size of the grid to draw. A window is provided, that moves within the boundaries of the top left grid, the window position is repositioned back into this grid, once it left the boundaries completely.
The original implementation of the ColorViewCanvas library featured a visualization based on an HTML5 canvas, a drawing API with a pixel buffer. The grid was duplicated along the axis on a buffer four times the size of the grid area, see Figure 4.15. The surrounding CanvasContainer, which served as a viewport (here called window). Once the window left the boundaries of the top left grid completely, the window was repositioned back into the grid. This reposition was not noticible and thus created the
Chapter 4. Implementation/Realization
82
impression of an infinitely wrapping surface. This implementation could not be reused, as the new system is rendering real objects in a 3D space, instead of drawing on a 2D pixel buffer. The problem can be simplified to a two-dimensional array on the XY-plane. The camera viewport defines a moving window on the plane. This window has to be smaller than the size of the array. Once the window moves out of the array’s boundaries, items from the far side are moved into the window, thus creating an infinite wrapping behavior. In order to elaborate the details of the wrapping, the coordinate spaces of the translations need to be defined.
Array coordinates Other times referred to as Slot coordinates are indices within the two-dimensional data array to address the item on this position. World coordinates Actual coordinates and dimension of the objects in the 3D space. By its width, height and margins, each object defines a bounding-box. This bounding-box is one cell in Grid coordinate space and can translate to Array coordinate space. Grid coordinates Unnormalized cell coordinates on the XY-plane.
Unnormalized
means in this context, that the coordinates can exceed the boundaries of the data array. Array coordinate space is contained within Grid coordinate space.
For implementing an infinitely wrapping element array, an algorithm needed to be developed, that would wrap items across the array boundaries, thereby creating the effect of a continuous grid. This algorithm would require the translation of World coordinates to Array coordinates in two use cases.
Window A window - defined by four coordinates in World-coordinates - is given, within which the included Grid coordinates are determined to lookup corresponding Array coordinates. Coordinate lookup An Array coordinate is given and it is to determine its position in World coordinates, based on the current window.
Both use cases are based on the same translations, however in separate implementations featured in the WrapCanvas class, mentioned in 4.1.5. Development was performed by prototyping on the isolated issue. The first prototype was developed in collaboration with Prof. Dr. Kai-Uwe Barthel to work out the coordinate translations. The second prototype was developed isolated to apply the coordinate translations into an actual
Chapter 4. Implementation/Realization
83
wrapping canvas in WebGL. Both prototypes are provided on the attached CD, see Appendix B. Translations between the spaces are required back and forth to suit both use cases. In the first use case, the World coordinates of the window are given and the Array indices required. The window is defined by the World coordinates of the left, right, top and bottom edge of the projected viewport on the XY plane. In order to keep this repositioning invisible, an additional margin was added to the window. Once the Array coordinates are determined, the item element at this position of the array can be repositioned back into the cell in World coordinates. Source code for translation in this case is provided in Appendix E.1. This is illustrated in Figure 4.16
Figure 4.16: The World coordinates of the window are calculated into retrieval grid coordinates (x1G, x2G). These are shifted by addition until they are positive. Using the module, the Array coordinate of each Grid coordinate is accessed to retrieve the item on this position. The product is then moved into position by converting the retrieval grid coordinates to World Space.
In the second use case the Array coordinates of an item are provided and the wrapped World coordinates within the window are requested. This is required, when the window moved away from the point of origin and new items are to be added to the scene. These items only know their Array coordinates and based on the windows translation in World space, the World coordinates for these items are to be determined. Source code for this translation is provided in Appendix E.2. This is illustrated in Figure 4.17. It has to be assured, that the window in Grid space is smaller than the boundaries of the data array.
Chapter 4. Implementation/Realization
84
Figure 4.17: The distance between the given Array coordinate and the known Array coordinate of the left window edge is calculated, converted back to World space and added to the World coordinates of the left window edge.
4.9.2
Viewport projection
To achieve the perfect window for the infinite wrapping described in the previous section, the projection of the camera’s frustum on the XY-plane needs to be calculated. This projection determines the maximum bounding-box the camera can show to the user on the displayed grid surface. With the buffer based wrapping canvas, this was no issue, as there was no threedimensional projection of the camera and so the offset dimensions of the outer viewport container could be used. The camera in a 3D space is defined by a frustum. The camera position is a point in space, from which 4 rays emit. The near-clipping plane and the far-clipping plane between those rays define the actual space, that is rendered to the output device, see Figure 4.18 Mathematically, this frustum defines a projection matrix. All world coordinates are projected through this matrix onto the 2D viewport. The camera is constrained, so that there is always a valid projection on the XY-plane. Too low angles or disallowed positions of the camera are prohibited by the interface of the DragSurfaceControl. This was not so much a mathematical problem, as it was one of implementing it within three.js. While it can be assumed, that the issue is common enough to find a simple solution, the implementation was not straight-forward.
Chapter 4. Implementation/Realization
85
Figure 4.18: The right screen shows the camera frustum plane of the left perspective camera.
Again, a prototype was built, to better understand the camera handling of the library and to better control the behavior. The prototype consisted of two viewports, one displaying a 3D scene though a perspective camera, the second shows an orthographic view of the same scene with the perspective camera frustum visible in the scene. This setup can be seen in Figure 4.18. The prototype would also feature a procedure to calculate the viewport projection on the XY-plane, which would also be visualized in the scene as shown in Figure 4.19.
Figure 4.19: The right screen shows the viewport projection on the XY plane of the left perspective camera.
Within this prototype two implementations for the projection calculation were tested. Both implementations are based on different methods of the three.js API. Both are based on three.js’ THREE.Unprojector class, which creates an unprojection matrix from the camera’s projection matrix. Through this unprojection matrix, a ray sent from the viewport-plane, is unprojected into the 3D space. The vectors for all four corner points of the camera viewport are unprojected and normalized.
Chapter 4. Implementation/Realization
86
The first solution is based on the THREE.Ray-class provided by three.js and is shown in Listing 4.4. These rays could be initialized from the normalized viewport vectors. the ray has no defined length and - using its intersectsPlane method - the point, were the ray intersects the plane can be calculated. 1
function inter sectionX Y (x , y , z , camera ) { var vector = new THREE . Vector3 ( x , y , z ) , projector = new THREE . Projector () ; projector . u np ro j ec tV ec t or ( vector , camera ) ; var vec = vector . subSelf ( camera . position ) . normalize () ,
5
ray = new THREE . Ray ( camera . position , vector ) , plane = new THREE . Plane ( new THREE . Vector3 ( 0 , 0 , 1 ) ) ; return ray . inters ectPlane ( plane ) ; }
Listing 4.4: Calculating intersection with XY-plane by using THREE.Ray class.
The second solution is based on the THREE.RayCaster-class provided by three.js. In this solution shown in Listing 4.5, not a Ray is initialized, but a RayCaster, a wrapping class for different Ray-related methods, originally provided for picking-projection. RayCaster provides a method to determine the object intersections within a scene. By testing for intersections with the axis planes, it can be determined which axis are intersected by the camera frustum and at which points. In both solutions, points of the unprojected camera on the XY-plane are determined. These would draw a trapezoid, of which we use the bounding box as the window for the window operations performed in 4.9.1. 1
function inter sectionX Y (x , y , z , camera ) { var vector = new THREE . Vector3 ( x , y , z ) , projector = new THREE . Projector () ; projector . u np ro j ec tV ec t or ( vector , camera ) ; var vec = vector . subSelf ( camera . position ) . normalize () ,
5
raycaster = new THREE . Raycaster ( camera . position , vector ) , intersects = raycaster . i n t e r s e c t O b j e ct s ( objects ) ; if ( intersects . length > 0 ) { return intersects [0]. point ; }
10
return undefined ; }
Listing 4.5: Calculating intersection with XY-plane by using THREE.RayCaster class.
In the final project it was decided to use the second solution. Still, the behavior was not as expected, as the coordinates of the projected trapezoid were imprecise and jumped erratically, resulting in artifacts shown in Figure 4.20. Checking the calculations did not solve the issue, which mostly arose during movement. The problem was found
Chapter 4. Implementation/Realization
87
in a bad choice of near-clipping plane values on the camera frustum. This caused, the unprojected vector to be too imprecise and accounted for the deviations in the calculation on movement. Increasing the distance from the camera position to the near-clipping plane solved this issue.
Figure 4.20: Given the window calculation fails, determining the item positions on the surfaces breaks and results in display issues of the wrapping canvas.
This solution relies on a camera angle to the XY-plane, that ensures the viewport penetrating the XY-plane. If this assumption is not fulfilled, the viewport projection fails and will result in visualization artifacts. No measures to prohibit this effect have been implemented as it is only an issue in development mode, when a developer changes the angle manually.
Chapter 5
Results/Evaluation 5.1
Project evaluation
Among the challenges of the project was working with the existing ColorViewCanvas project and adhering to the established conventions. ColorViewCanvas provided a fully functional build-environment with a steep learning curve. This however was made up by its advantages in later phases of development. The original project included several fallback solutions to account for backwards compatibility with older browsers. By losing these and replacing the drawing logic by the new 3D environment logic, the amount of maintainable code lines was considerably reduced. However, at the price of more external dependencies. Dependency management could have been handled better by deciding on a packaging system early and binding dependencies with it. This would have avoided trouble with library updates and incompatibilities during development. Next to the main project’s implementation, smaller prototypes have been developed to isolate certain aspects and develop them separately before integration into the larger context. Prototyping proofed a valuable tool to address issues and debug problems. These prototypes are included on the CD provided with the thesis (see Appendix B). The final installment Balcony is a small showcase of the potential modern web technologies offer. It is a proof-of-concept and not production-ready. While the basic stability is ensured, optimizations and imperfections are remaining issues that have to be addressed. The basic design of the library allows easy extension of it, to visualize more diverse data sets in Virtual Environments featuring more interactivity with optimized controls. Balcony is the first step to lay the basis for future ideas and future developments.
88
Chapter 6. Results/Evaluation
5.1.1
89
Implementation
The software was developed to a state, where it was usable and functionally tested. It is not in a state for production deployment which would require far more extensive testing and exception handling. An automated test-suite was not implemented. Integration and interoperability with the existing web service infrastructure is ensured and all changes to the original ColorViewCanvas project have been tracked in version control. Empirical user evaluation of the new interface was not performed and only noted feedback of chosen test persons was collected. More extensive studies on the proposed interface and the derivations possible by the implemented views (see 4.6.1), controls (see 4.6.2) and customization (see 4.6.4) with a larger test audience would be beneficial to the future development and to verify the assumptions proposed in the requirements in Chapter 3. Particular interesting questions to do further research on are, how hypertext features, such as permalinks and links to search results, are perceived by the users, what impressions different animated transitions have on the perceived ease of use of the system and how do the users deviate their browse/search approach on the paradigm of this User Interface, compared to conventional two-dimensional web shop UIs. The final software is provided as source code as well as integrated in 3 websites as compiled library on the CD. Also provided is the bundled ClayServer, discussed in 4.1.7. This is a Java executable, that starts its own web server hosting the website installments. The CD-content is listed in Appendix B. It has to be noted, that only the frontend implementation can be provided and that the frontend relies on the pixolution backend, to request and receive data to display. A sample XML response returned by the server is provided in Appendix D.
5.1.2
Virtual environment
Enriching an online web shop by carefully integrating a three-dimensional component, was the goal of this thesis. The Virtual environment proposed in this project describes an interactive 3D space, in which HTML elements are spatially arranged. Interactivity is constraint to a limited set controls and axis of freedom to always ensure a good perspective on the data. The final implementation is not related to Virtual Reality stores as they were proposed and implemented every so often. (See 3.4) Simulating real stores was a metaphor that did not work for various reasons: technical reasons such as proprietary plugins, usability reasons like difficulty of navigation, information querying, a lack of engaging immersion and aesthetic reasons like sterile life-less environments. Virtual Stores are a bad
Chapter 6. Results/Evaluation
90
simulacrum for something that is the optimal arrangement in reality (optimized retail stores), but something that so far has always failed to translate to the Virtual Reality. 3D environments are a different media than Brick-and-mortar stores and even a different media than 2D e-commerce solutions. Thereby, they have different requirements, that can not be met without a transformation that embraces the differences of the media. Skeuomorphism - as discussed in 2.3.2 - describes how metaphors are used to create a user interface that should incept a basic idea on the purpose and its usage on a first-time user by giving a sense of familiarity. The user should be able to learn the software based on prior experiences. However if the behavioral metaphors used diverge too far, they become worthless and even harm the usability more than they help. Blindly translating retail stores into a Virtual Environment is a bad metaphor as the expectation and the taxonomy of the user is very different to real-life stores. Requirements to search and navigation are not dealt with and make Virtual Stores inefficient - even unpleasant to use. The project presents a different approach by using the possibilities of modern graphics engines in the browser to create a three-dimensional data set visualization. It is easy to learn and fluent to use. Without the need to leverage and fulfill prior metaphors, its true potential can be developed even further by user studies and experimentation. The installment of Balcony still leverages the visual metaphor of a balcony to create the association of looking onto the data from above.
5.1.3
Navigation & Visualization
The software allows to serve the needs for both search- and browse-dominant users. Although a classical hierarchical category structure is missing and could be beneficial as introductory point for browse-dominant users, it is not required. By providing a list of keywords extracted from popular categories, a simple top-level categorization is provided as entry points into browsed navigation. A good example implementation was presented in the Google Bookcase in 3.4.2.2. The hypothesis formulated for this implementation was, that the 3D environment created would be more effective than a conventional 2D representation of the same data set. [8] This hypothesis should not be applied blindly, but has to be seen in context of the surrounding website and the media Web. Conventional web shops provide a concise and optimized user interface. Product visualization is one use case among plenty and only focusing on the 3D visualization to justify its effectiveness falls short. A good visualization has to be seen in the context in which it is used, designed for the audience using it and integrated in an overall system, that leverages its potential. The implemented system tries to balance the advantages of 3D visualization, with the disadvantages of
Chapter 6. Results/Evaluation
91
losing the hypertext-context, by providing replacement functionality. The interactive visualization itself is a starting point and test of the technology. As such it is neither spectacular nor ubiquitous. The novelty is not in the visualization itself, but in the integrative context it is provided.
5.2
Requirements evaluation
In Chapter 3 the functional and conceptional requirements for a proposed three-dimensional User Interface of a web store have been defined. The following sections will assess if the given criteria could be fulfilled, or - if not - what would be required to fulfill them.
5.2.1
Usability
Evaluating the usability of the new User Interface is hard without extensive user testing and a series of studies performed to evaluate the performance of individual aspects of the User Experience. As the developed prototype was set out to be a experimental proofof-concept for new approaches in applying three-dimensional visualizations in product catalogs, the goal was to define the niche, in which such system would operate and evaluate the technical potential of overcoming the shortcomings of previous systems. For production deployment, the effort of doing a proper usability analysis and extensive user testing is recommended. The visualized image data are also a very specialized data set. Going the next step and displaying less visual, more meta-data based product types will result in necessary adjustments. These adjustments should be possible without major development by changing the HTML templates and the meta data within the basic data model. Software is never finished and always shows a development snapshot. No complex software is free of errors nor free of compromise. An area which would require some attention is a better handling of mouse events. The way, drag feels with the canvas, has been configured the best way in the given time, but that is not without saying that more could be done. One trade-off for example was deactivating text highlighting, which is detrimental to copying text from within 3D environment of the website. Drag events do not continue, once the mouse leaves the visualization area, sometimes the mouse gets stuck in drag mode, when it leaves the area prematurely. These minor usability quirks are avoidable and need to be addressed.
Chapter 6. Results/Evaluation
92
Potential in usability lies in the idea of Semantic Zooming, proposed by Polys. [36] By knowing the camera, orientation, distance to a product, interaction with the scene could be invoked. This is implemented on a very low level, as a selected item is unselected, if the camera moves away. This could be extended easily by selecting items, if the user zooms towards them. An even more elaborate extension could be to trigger search queries, if a user zooms towards an interesting item. The query would hide the current results and display a new surface below with more refined search results. On zooming out, the user would leave this lower surface and the upper surface would fade back in. With the conclusion of the development, the software reached a point from where on more elaborate experiments could be performed, and which leaves room for future development in this area.
5.2.2
Performance
Evaluating the performance of the website, it is once again important to factor out the influence of the backend. Serving search results depends on the web service and can not simply be improved. Its performance optimization is outside the scope of this project. However, many other factors can be evaluated on the system to measure and improve its performance. The web application is executed client-side, not requiring the execution of server-side scripts.
Regarding the server-side, the application is simple, static, stateless
HTML/CSS/JS and scales perfectly with the amount of users. Server occupancy is thus low. The only load is on the backend server when dealing with additional search requests. The same performance optimizations, recommended for any other static website, can be applied. This includes measures to reduce HTTP requests and leverage caching strategies by the browser. One bottleneck existing in the system is the processing of the search results in the client application. As the result set of items is processed, image data for each item is loaded by the browser. Browsers have the limitation, of only loading two resources from the same domain at once. [50] On a search request, the assets for 200 items are loaded synchronously by the browser, thereby creating a bottleneck. Fast execution is possible by using Content Delivery Networks (CDN), which serve assets from multiple domains, thereby tricking the browser to load resources simultaneously. Still, this also needs to be supported by the general web service infrastructure.
Chapter 6. Results/Evaluation
93
As discussed in 4.3, the render process is not performed in a continuous loop, redrawing the scene is only triggered on demand. GPU usage is low and no redraws are required on inactivity. The rendering efficiency for the system using css-transforms has been tested on multiple browsers and multiple platforms. The performance results can be seen in Table 5.1 Browser
Render engine OS fps on load fps on standby Macbook Pro 13’, 2.3 GHz dual Core I5, Intel HD Graphics 3000 Chrome (26) Webkit OSX 10.7 50-60 50-60 Safari (6) Webkit OSX 10.7 50-60 50-60 Firefox (20) Gecko OSX 10.7 15-20 50-60 2.5GHz Core 2 Quad Q83000, Nvidia GeForce 9600 GT Chromium (25) Webkit Ubuntu 12.10 35-50 50-60 Firefox (20) Gecko Ubuntu 12.10 15-20 50-60 Chrome (26) Webkit Windows 7 30-40 50-60 Firefox (20) Webkit Windows 7 2-5 50-60 Samsung Galaxy Nexus, 1.2 GHz dual-core ARM, PowerVR SGX540 Chrome Webkit Android 4.2 2-5 5-10 Firefox Gecko Android 4.2 0-2 2-5 Nexus 7, 1.2 GHz quad-core ARM, Nvidia GeForce ULP Chrome Webkit Android 4.2 2-5 5-10 Firefox Gecko Android 4.2 0-2 2-5 Table 5.1: Table shows the frames per second for various browsers and multiple platforms.
60 fps is the maximum capping. This shows how different the current implementations of CSS-transforms in the client rendering engines are. Especially the dependency and the gain on OpenGL can be seen.
5.2.3
IRVE
Information-rich Virtual Environments have been discussed in 2.3.3 proposing two definitions. The first definition establishes IRVEs as an integration of spatial, abstract and temporal information for generating insights into complex relationships in heterogenous data by visual exploration. Several criteria of this definition are fulfilled in the implemented project, as a multidimensional data set is visualized for exploration by integrating abstract and spatial data. However, it is questionable how well complex relationships between product data are visualized to actually create insight. The used data set is specialized for picture data and thus homogenous. Generalizing the data set as discussed in 4.1.2 would result in a diverse set of data, which would require more extended approaches to visualizing
Chapter 6. Results/Evaluation
94
similarity for data other than visual similarity by picture. More interactivity in the data visualization, for example by providing filter options, would be beneficial. At this point, only once a more generalized approach to product data visualization is implemented, to allow exploration on multiple data fields of the data set, the first definition of an IRVE would be fulfilled. The second definition describes IRVEs as a Virtual environment enhanced by abstract data. This definition assumes a pre-existing virtual environment which is augmented by the visualization of abstract data. Since there is no Virtual Reality or other Virtual environment in this thesis’ project other than the actual data visualization itself, this definition is not fulfilled.
5.2.4
Requirements assessment
In Table 3.1 the requirements an implemented system would have to meet were defined. Table 5.2 shows the resulting summary on this checklist. Criteria Technology stack Library dependencies Third-party software required
Compatibility Virtual environment Shop taxonomy Heterogenic data set Fluent performance Energy consumption Visual appeal Organization Customization
Permalinks History
Implementation HTML5, JavaScript, CSS3 (including CSS-transforms module) ColorViewCanvas, jQuery, jQuery-UI, three.js, tween.js, history.js The visualization is based on CSS-transforms, which needs to be supported by the browser. No additional plugins are required. CSS-transforms required, Webkit supported (Chrome, Safari, Android, iPhone) Abstract data visualization, product previews displayed on plane, arranged by similarity Only product navigation is implemented, no user management, purchase or other shop functionality. Picture database of fotolia, homogenous data Performance of CSS-transforms depends on the browser implementation (GPU-support) On-demand redrawing implement, thus saving energy. Balcony example integration with minimalistic style. Navigation and interaction enhanced by animations. Design limited to the required functionality, navigation is consistent throughout the application. The developer integration features multiple settings, the example store implementation does not allow configuration. Permalinks to product items or searches are possible. The back-button is fully supported.
Table 5.2: Evaluation of the list of requirements criteria
Chapter 6. Results/Evaluation
5.3
95
Development potential
Based on the requirements, the project implementation has been evaluated. From these results and including some factors, that have been excluded from this thesis, several fields of further development and research can be identified.
5.3.1
Features & Enhancements
Several features have been found, that would prove a valuable addition to the software in future versions. Although certain hypertext features have been implemented, search persistence and permalinks could be improved. Also, better tracking support would provide valuable information on how the users actually interact with the website. So far this has mostly been based on assumptions and limited user testing. Search usability could be improved by adding auto-completion to the search field. In the best case, the data for the auto-completion could be provided by the actual product data. Alternatively, even an auto-completion on the most used words of a dictionary not related to the data would provide benefits. The search request interface to the backend already features multiple search criteria (see 4.5). However, communicating this feature in the UI is not easy and the search field should be as easy to use as possible. This is one case where ease-of-use is more important than rich functionality. Instead of providing a complex search interface, many web shops already break searching down into two processes: initial textual search for a keyword and limiting the search result set by a semantical set of filters based on the product category. Filtering is not implemented in the software, and developing a filter interface that integrates with the current search would be a valuable addition for usability, especially on heterogenous product data. Regarding the visualization, the DOM event handling could be improved, to avoid certain behavior of the website (like text selection on dragging). This has been done already on most elements, but is not perfect. Gesture support for touchscreens also needs to be regarded as experimental and is a rich field for improving usability on mobile devices.
Chapter 6. Results/Evaluation
96
In general, this application served as an experimental frontend to a shop backend. Much of the actual shop taxonomy like purchase, bookmarks and checkout have been excluded from the work. Featuring a full e-commerce workflow is among the next logical steps.
5.3.2
Graphics & Aesthetics
By the definition of aesthetics provided in 3.2.5, it is differentiated between Visual appeal and Organization Visual appeal is not easy to judge for a prototypical implementation. As has been pointed out before, the system was developed with the focus on Organization. Graphics quality and style is only provided as necessary. A reasonable step would be to involve a professional UI designer on the project to work out the next step by creating a consistent and appealing screen design for the available technology. This would be beneficial also in regards of scalability of the UI. The current implementation is very slim and does not confront the users with more complexity than necessary. By adding more features that are common to web shops, this minimalism would be more difficult to keep and would have to be dealt with. It will be important to find ways to incorporate new features, but hide them smartly, so the UI remains clear. From a technical point of view visual appeal is hard to judge. Using CSS-transforms has one disadvantage with the current rendering technology. The CSS engine renders the HTML element that will be transformed in 3D space, two-dimensionally, as if it was regularly a part of the website. This 2D representation is rendered to the texture of a 2D rectangle, that is transformed. This results in pixelated and blurry surfaces as the camera zooms closer to the item. Future iterations of the render engine may change the order of rendering and provide 3D results with crisp graphics. The focus of the visualization was on Organization. The DragSurface provides a simple minimalistic visualization of two-dimensional similarities with few distractions. Locomotion through the visualization is provided by Constraint navigation limited to drag movements and zoom. Changes in the visualization (item arrangement, visibility of items) always transition through animation. This however might be regarded as chaotic, for example in case of the search request, as too many elements move at once. Certain timing constraints and different interpolations are worth exploring. With Balcony an example UI installment is provided, that focuses on the search aspect and provides the visualization with a simple, stylish, and a slim interface.
Chapter 6. Results/Evaluation
5.3.3
97
Technology
Stable browser support of WebGL is still limited to the web clients Chrome and Firefox. Under these circumstances, use of WebGL in production has to be considered carefully and is not feasible for mainstream use without adequate fallbacks yet. If the target group of customers is well-defined to these two particular browsers, use of WebGL can be considered. Mobile support for WebGL is very limited. [51] [52] Still, WebGL can be considered a future-proof technology and its support by browsers will improve. Libraries to support the development of WebGL (see 4.2) have varying degree of stability. The chosen three.js toolkit (see 4.2.1) is a stable solution to build Web3D applications. What has to be considered is, that - although it is one of the best-maintained libraries - it is still in development and the API changes with each revision. This occasionally breaks backward compatibility. During software development it proved best to choose one revision and work with it for the remainder of the main development and only upgrade three.js once the main project was implemented. Compared to other WebGL toolkits, three.js has a fast development pace, which accounts for the rich set of features and examples as well as the additional overhead for maintenance. What makes three.js the best choice among the featured toolkits was the ability to change the underlying renderer. As discussed in 4.3, WebGLRenderer and CanvasRenderer are available by default. Additional experimental renderers are available and can be added as modules. CSS3DRenderer, as described in 4.3.2, is one such renderer and works differently to WebGLRenderer as it does not create a WebGL context, but utilizes the CSS-transforms properties of CSS3 to simulate positioning HTML elements in 3D space. Browser support for this renderer is much better, although performance is dependent on whether the CSS engine has implemented hardware-acceleration or not. During the development some technological aspects could have been focused higher. With the choice of CSS3DRenderer, the current implementation appends a list of HTML section elements into the DOM. This HTML is currently hard-coded within the library. As this template HTML code would seldom change for this specific implementation, it was a pragmatic decision. However, on the consideration that the same base library could be used in multiple store implementations, this HTML template should be outsourced from the actual library source code. Also, in that case the use of static JavaScript to create the desired HTML strings should be addressed. For this purpose, HTML template engines are available that allow the creation of abstract HTML templates, which include basic logic functions, such as flow control (loops, conditions) and variables. The templates can either be handled within the JavaScript sources or exported into
Chapter 6. Results/Evaluation
98
external files - loaded and compiled to HTML on runtime in the browser. Two possible choices are Mustache 1 or handlebars.js 2 . By using CSS-transforms on top of a WebGL-toolkit, WebGL was not actually used the actual renderer was not the WebGL interface, but the CSS renderer, which depending on the browser implementation can still be GPU-accelerated. This is a powerful combination, but not yet the ultimate integration of 3D contexts, that has been sought for two decades. This integration seeks semantical 3D data embedded in the website, tightly integrated with the DOM. This is where Declarative 3D approaches such es X3D have their strength, but lack the flexibility to program complex behavior procedural programming offers in the imperative approach. Section 2.4.4 describes efforts to fill the gap of a standardized Declarative 3D specification in HTML by working groups within the W3C. Although the CSS-transforms solution is limited to HTML elements displayed in 3D space and excludes vertex-based geometry, lighting, shaders and most other features the WebGL API offers, it still bridges the gap between Declarative and Imperative 3D. Contents of the 3D scene are declared in HTML, transformed using CSS and given an imperative API by the abstraction level provided by three.js.
1 2
Website of Mustache: http://mustache.github.com/ Website of handlebars.js http://handlebarsjs.com/
Chapter 6
Conclusion With WebGL a new technology emerges, bringing cross-platform 3D graphics to the browser for the first time. The eco-system and toolkits leveraging the technology develop fast and support among browsers is improving. This thesis gave insight into the current state of 3D on the Web. A critical look at Virtual Reality utilization in e-commerce has been provided and a number of VR applications in online shopping have been evaluated. Although Virtual Reality has failed to provide meaningful solutions, 3D as technology is not limited to VR and should not be discarded. A look at the use of metaphors shows, how disassociation from failed metaphors can open new opportunities. In case of 3D environments the opportunity lies in creating new ways of visualization and navigation through product catalogs. A software was developed for this thesis to showcase the potential modern web technologies offer. It is a proof-of-concept displaying an interactive product data set in a three-dimensional space. The application is based on a library which allows for extension to visualize more diverse data sets in Virtual Environments. Its purpose was to experiment and try different visualization arrangements and camera controls. Multiple installments were created, showcasing the functionality both in a development and production-like environment. The resulted installment Balcony is the first step to lay the basis for future ideas and developments. The implemented system tries to balance the advantages of 3D visualization, with the disadvantages of losing the hypertext-context, by providing replacement functionality. Three-dimensional visualization was provided using different interfaces - among them WebGL and CSS-transforms. Especially CSS-transforms offered the advantage of applying 3D on the HTML-elements of the website. It is thus close to a Declarative 3D 99
Chapter 7. Conclusion
100
solution, while retaining the advantages of Imperative 3D provided by the abstraction library three.js. The interactive visualization itself is a starting point and test of the technology. As such it is neither spectacular nor ubiquitous. The novelty is not the visualization itself, but the integrative context provided and the combination of numerous technologies to embed 3D in the hypertextuality of the Web.
Appendix A
Code examples 1
< html lang = " en " > < head > < meta charset = " utf -8 " > < title > Page Title
5
< body > < h1 > Headline of most importance
This is paragraph is interesting without rainbow colored unicorns .
10
Listing A.1: Example of HTML5 markup. 1