Available online at www.sciencedirect.com
ProcediaProcedia Engineering 00 (2011) Engineering 30 000–000 (2012) 20 – 27
Procedia Engineering www.elsevier.com/locate/procedia
International Conference on Communication Technology and System Design 2011
Design and Implementation of Web Usage Mining Intelligent System in the Field of e-commerce B.Naveena Devia, Y.Rama Devib, B.Padmaja Ranic, R.Rajeshwar Raod, a* a
b
Department of CSE, Mahatma Gandhi Institute of Technology,Gandipet, Hyderabad, A.P.500075, India Professor, Department of CSE, Chaitanya Bharathi Institute of Technology, Gandipet, Hyderabad, A.P.500075, India c Department of CSE, Jawaharlal Nehru Technological University, Hyderabad, A.P., , India d Department of CSE, Mahatma Gandhi Institute of Technology,Gandipet, Hyderabad, A.P.500075 , India
Abstract
The rising popularity of electronic commerce makes data mining an indispensable technology for several applications, especially online business competitiveness. The World Wide Web provides abundant raw data in the form of web access logs. Now a days many business applications utilizing data mining techniques to extract useful business information on the web evolved from web searching to web mining. This paper introduces a web usage mining intelligent system to provide taxonomy on user information based on transactional data by applying data mining algorithm, and also offers a public service which enables direct access of website functionalities to the third party.
© 2011 Published by Elsevier Ltd. Selection and/or peer-review under responsibility of ICCTSD 2011 Open access under CC BY-NC-ND license.
Keywords: Data Mining; Information Retrieval; Open Web Services; Web Usage Mining, Web Computing.
1. Introduction The goal of Web Usage Mining is to find out extract the useful information from web data or web log files. The other goals are to enhance the usability of the web information and to apply the technology on the web applications, for instance, pre-fetching and catching, personalization etc. For decision management, the result of web usage mining can be used for target advertisement, improving web design, improving satisfaction of customer, guiding the strategy decision of the enterprise and market analysis [1]. Recently there are a large number of web services that we can use and many of them are open source based. Web services are APIs that facilitate the communication between applications for example RapidMiner, Digg.com, Amazon, eBay are opened access to their services and data through APIs, and we * B. Naveena Devi. Tel.: +91-9441724900; fax: +91-40-24193067 E-mail address:
[email protected].
1877-7058 © 2011 Published by Elsevier Ltd. Open access under CC BY-NC-ND license. doi:10.1016/j.proeng.2012.01.829
2
B. Naveena / Procedia Engineering 30 (2012) 20 – 27 Author Devi nameet/ al. Procedia Engineering 00 (2011) 000–000
can make use of their services for the development of web usage mining research applications. The concept of Web APIs enables direct access to the website functionalities in order to leverage third party efforts on value adding services [2]. However, the number of companies, services or web sites that gather information about users increasing continuously. These systems store private information about users and for that reason appears much controversy about the legitimacy. The main problem is that these companies don’t share information with the rest of the world. In this paper, we present a public system to store information about their products and view details about user behavior. Some of the problems about sharing information would be solved if there was a public service for user behavior information. If all people can access that information, all of them will have the same opportunities and will be at the same point in a commercial environment [2]. The rest of the paper is organized as various sections: section 2 will have implemented details about how Hierarchical Agglomerative Clustering applied on sample web log for mobile marketing. Section 3 elaborates how to provide public service (API) which enables third party to view their customer’s behavior. Finally Section 4 demonstrates experimental result and Section 5 Conclusion with future work. 2. Hierarchical agglomerative clustering In this paper we focus on, standard data mining techniques such as clustering a particular user may associate with other users exhibiting similar behavior pattern and preferences. Due to the heterogeneity of user’s browsing features, the hierarchical agglomerative clustering algorithm is used to class user’s browsing behaviors. Agglomerative hierarchical clustering starts with every single object in a single cluster. Then, in each successive iteration, it agglomerates the closest pair of clusters by satisfying some similarity criteria, until all of the data is in one cluster. However, it is necessary to define a suitable terminal condition when the agglomerative process should end [3]. In the hierarchical clustering, the general similarity measures are Euclidean distance function. In the initialization, every user is seen to be a cluster. The similar users’ browsing feature will be found out and merged into a cluster until terminal condition is satisfied. Finally, the user clusters will be displayed based on browsing timings. 2.1. Pattern Representation We have taken sample web log file for mobile marketing as shown in table 1 for illustration purpose. At this point in time, we assume that user sessions can be accurately determined. This log file contains details like user id, name of the company, name of the product, log in time, log out time, company session start time, company session end time, product session start time, product session end time, respective access time in seconds. In the task of pattern representation, user sessions are created from web log files. User sessions can be reorganized as a m x k matrix as table 1, each row can be presented by Sessionu = (Pu,1, Pu,2,……..Pu,k) . The k is the number of clusters which is necessary to define a suitable terminal condition when the agglomerative should be end. We have taken parameter k value as 3. One straightforward approach in creating an aggregate view of each cluster is to compute the centroid of each cluster. We have taken the dimension value for each session in the mean vector is computed by finding the ration of the sum of the session weights across transactions to the total number of transactions in the cluster.
21
22
B. Naveena et al. / Engineering Procedia Engineering (2012) 20 – 27 Author nameDevi / Procedia 00 (2011) 30 000–000
3
Table 1. Sample Web log file
UNAME
krishna
teja
pranav
shiva123
valee
valee
COMPANY
PRODUCT
LOGIN START
LOGIN END
COMPANY SESSION START
COMPANY SESSION END
PRODUCT SESSION START
PRODUCT SESSION END
Tue Nov 16 11:27:04 IST 2010
Tue Nov 16 11:26:42 IST 2010
Tue Nov 16 11:27:04 IST 2010
Tue Nov 16 11:26:42 IST 2010
Tue Nov 16 11:27:04 IST 2010
lg
LG KP500
Tue Nov 16 11:26:30 IST 2010
samsung
Samsung CDMA F679
Tue Nov 16 11:27:55 IST 2010
Tue Nov 16 11:29:03 IST 2010
Tue Nov 16 11:28:52 IST 2010
Tue Nov 16 11:29:03 IST 2010
Tue Nov 16 11:28:52 IST 2010
Tue Nov 16 11:29:03 IST 2010
Nokia AEON
Tue Jan 25 18:59:48 IST 2011
Tue Jan 25 19:09:45 IST 2011
Tue Jan 25 19:00:48 IST 2011
Tue Jan 25 19:09:45 IST 2011
Tue Jan 25 19:00:51 IST 2011
Tue Jan 25 19:09:45 IST 2011
samsung2100
Tue Jan 25 19:12:09 IST 2011
Tue Jan 25 19:13:20 IST 2011
Tue Jan 25 19:13:03 IST 2011
Tue Jan 25 19:13:20 IST 2011
Tue Jan 25 19:13:07 IST 2011
Tue Jan 25 19:13:20 IST 2011
Nokia AEON
Mon Jan 24 15:56:38 IST 2011
Mon Jan 24 15:58:04 IST 2011
Mon Jan 24 15:56:47 IST 2011
Mon Jan 24 15:58:04 IST 2011
Mon Jan 24 15:56:51 IST 2011
Mon Jan 24 15:58:04 IST 2011
samsung1200
Mon Jan 24 17:01:58 IST 2011
Mon Jan 24 17:03:32 IST 2011
Mon Jan 24 17:03:27 IST 2011
Mon Jan 24 17:03:32 IST 2011
Mon Jan 24 17:02:49 IST 2011
Mon Jan 24 17:03:32 IST 2011
nokia
samsung
nokia
sony
The similarity between any two users can be calculated by distance measure. We have take Euclidean distance measure instead of other techniques as the smaller the distance, the more similar the two objects are to each other. Euclidean distance function (1) is used for computing the similarity between user i and user j, the similarity can be present by Sim (useri, userj) = (sessioni, sessionj). Euclidean distance is further normalized by equation (2). Further, the m x m matrix of user similarity will be obtained. Euclidean distance: D(useri,userj) =
k l 1
( pi ,l
p j ,l ) 2 (1)
Normalization : k
ND (useri,userj)= 1Clustering :
l 1
p j ,l ) 2
( pi.l k
(2)
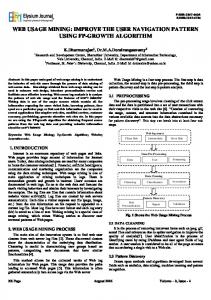
In the hierarchical agglomerative clustering method, the distances are considered between centroids of clusters. The two clusters are merged by the shortest distance between two centroids. In the final, the new centroid vector of new cluster will be calculated by equation (3). In this paper, the single-linkage and complete-linkage are not considered, but distances of centroids are used. It is assumed there are n objects
B. Naveena / Procedia Engineering 30 (2012) 20 – 27 AuthorDevi nameet/al. Procedia Engineering 00 (2011) 000–000
4
in a cluster, the feature of each object can be represented by (pi,l, pi,2,……..,pi,k) where 1< i < n. The centroid vector of cluster can be calculated as follows: n
Centroid
cluster
=
l 1
pl ,1 n
n
,
l 1
pl , 2 n
n
,.......,
l 1
pl ,k n
(3)
(1)
Initialization cluster:
(1.1)
Each object be a cluster.
(1.2)
Creating similarity matrix of users.
(2)
Clustering:
(2.1)
Finding a pair of the most similar clusters and merging.
(2.2)
Computing the new centroid vector of new cluster.
(2.3)
Computing the distances between new cluster and others.
(2.4)
Pruning and updating the similarity matrix.
(2.5)
If the terminal condition is satisfied then output, else repeating 2.1 to 2.4.
(3)
Clustered output.
Fig. 1. Hierarchical agglomerative clustering procedure
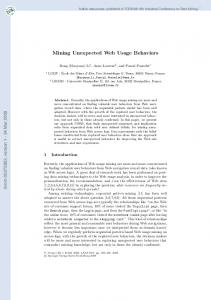
3. Enabling technologies to provide API for user behavior information Web services are implemented by a set of core technologies that provide the mechanisms for communication, description, and discovery of services. The standards that provide these functionalities are simple object access protocol (SOAP), web services description Language (WSDL) and universal description, discovery, and integration (UDDI) [4]. These XML based standards use common Internet protocols for the exchange of service requests and responses. Fig.2 shows the relationship of these technologies as a standards stack for web services. When a service provider creates a new service, it describes the service using WSDL. WSDL defines a service in terms of the messages to be exchanged between services and how they can be bound by specifying the location of the service with URL. To make the service available to service consumers, the service provider registers the service in a UDDI registry by supplying the details of the location of the service provider, the category of the service, and technical details on how to bind to the service. The UDDI registry will maintain pointers to the WSDL description and to the service. When a service consumer wants to use a service, it queries the UDDI registry to find a service that matches its needs and obtains the WSDL description of the service, as well as the access point of the service. The service consumer uses the WSDL description to construct a SOAP message to be transported over HTTP to communicate with service [4][5].
23
24
B. Naveena et al. / Engineering Procedia Engineering (2012) 20 – 27 Author nameDevi / Procedia 00 (2011) 30 000–000
Service publication and discovery (UDDI) Service description (WSDL)
Core web service Standards
Service Communication (SOAP) Packaging (XML) Transfer and network protocols (HTTP & TCP)
Fig. 2. Web service standard stack.
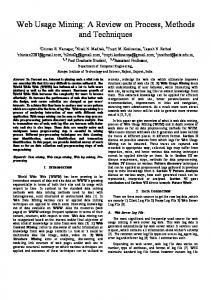
4. Experimental results with screenshots This section demonstrates a simple walk-through of home page approach which contains the major links like Home, Login, and Registration for interaction with application. In user session, the browsed pages will be recorded in the log file according to transactional sequences. Web usage mining intelligent system retrieves the useful information from web access log which stored at backend, apart from home page there is link for administrator to control the design of web site by viewing the progress and feedback of the customers.
Fig. 3. Home page for Administrator
The Fig. 3 displays Administrator choice which contains tabs like Approve company, view progress, view product result, view feedback to enable the administrator to view the status of browsing behavior of customers.
5
6
B. Naveena / Procedia Engineering 30 (2012) 20 – 27 Author Devi nameet/ al. Procedia Engineering 00 (2011) 000–000
Table. 2 Output screen for user information
Table 2 shows the access log visiting status of user session, the browsed information will be recorded in the log file according to the transactional sequence. This kind of information can be used to form Access Sequence. By analyzing the characteristics of these sequences, we can better understand users’ browsing habits so as to predict users’ next action and offer personalized website content and service based on corresponding forecast. Table 3 Output screen for aggregated timing information
25
26
B. Naveena et al. / Engineering Procedia Engineering (2012) 20 – 27 Author nameDevi / Procedia 00 (2011) 30 000–000
The Table 3 shows the result of aggregated timing information of users based on browsing transactional data. This kind of information can be used to form access sequence after preprocessing. Table 4 Clustered output screen based on Company
The Table 4 shows clustered output after applying the algorithm. Grouping the companies based on user interest depending on the transactional browsing timings.
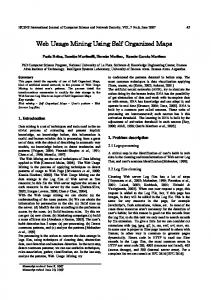
Fig. 4. Frequency of browsing timing occurrences of users.
7
B. Naveena / Procedia Engineering 30 (2012) 20 – 27 AuthorDevi nameet/al. Procedia Engineering 00 (2011) 000–000
8
Fig. 4. shows the final graph containing details about number of users verses accessing timings. Graph contains details of maximum time utilization values, and minimum time utilization and average time utilization values of various users. The analysis and visualization of time dimension aggregates transaction records on daily or weekly basis provides an entrepreneur to take better decision and abnormality with respect to the time dimension. 5. Conclusion The importance of web usage mining is unquestionable with the rising importance of the web not only as an information portal but also as a business edge. Web access logs contain abundant raw data that can be mined for web access patterns, which in turn can be applied to improve the overall surfing experience of users. By taking into consideration we have mainly focused on designing of web usage mining intelligent system for clustering of user behaviors using agglomerative clustering algorithm. Experiments conducted on web logs show the viability of our approach. However, much work is still needed to add more functionality to web mining services, to make web usage mining more useful in the electronic commerce domain. References: [1] Chu-Hui Lee, Yu-Hsiang Fu “Web Usage Mining Based on Clustering of Browsing Features”, IEEE Eighth International Conference on Intelligent Systems Design and Applications, 2008, p. 281-286. [2] Hsinchun Chen, Xin Li “Using Open Web APIs in Teaching Web Mining” IEEE Transactions on Education, Vol. 54, Issue 4, 2009, p. 482-490. [3] Gago, J.M. Guerrero, C. Juiz, C. Puigjaner, R. “Web Mining Service (WMS), a public and free service for web data mining” IEEE Fourth International Conference on Internet and Web Applications and Services, 2009, p. 351-356. [4] Richi Nayak “Facilitating and Improving the Use of Web Services with Data Minig” 2007. [5] Xinlin Zhang, Xiangdong Yin “Design of an Information Intelligent System based on Web Data Mining”, IEEE International Conference on Computer Science and Information Technology, 2008, p. 88-91.
27