Design and Usability Evaluation of a GAAP Flight Progress Monitoring System in a Simulated Air Traffic Environment Caspar Ryan School of CS & IT RMIT University
[email protected]
Ron van Schyndel School of CS & IT RMIT University
[email protected]
Abstract Pen and paper is still used as the primary method of recording flight progress in Australian GAAP type Air Traffic Control Towers. Although paper based systems may seem crude, they occupy little of the controller’s time, allowing him or her to concentrate on the primary task of visually monitoring aircraft and runways. This paper describes from an experiential perspective, the conception, development and usability evaluation of a working computer based prototype, intended to replace the above method. Given the safety critical nature of the system, emphasis was placed on the requirement that the GUI based implementation must not distract the controller from the primary duty of aircraft and runway surveillance. A number of novel testing methods were developed in order to measure the efficacy of the existing manual system, which would serve as a baseline for comparison with the newly developed prototype. Specialised techniques were also derived to simulate a live air traffic control situation so that the new system could be realistically evaluated in a safe non-live environment.
1. Rationale Most Australian Air Traffic Control (ATC) Towers use pen and paper as the primary method of monitoring and recording the progress of aircraft flights. The traditional medium for recording traffic control details about particular aircraft is the paper Flight Progress Strip (FPS). According to Mackay (Mackay, 1999), the paper strip provides reliability and is easily understood. Additionally, the task of writing on paper strips can be an important means by which the controller's mental "picture" of the traffic situation is updated and reinforced (Fields, Paterno, Santoro, & Tahmassebi, 1999). In one particular type of Australian Tower, namely the General Aviation Airport Procedures (GAAP) Control Tower, a simpler system has been developed, as most of the information displayed on an FPS is not needed. In
Geoff Kitchin School of CS & IT RMIT University
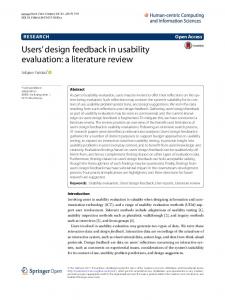
some GAAP Towers, notation of aircraft movements on a sheet of A4 paper, referred to as a traffic sheet (Figure 1), has entirely replaced the flight strip. This system, although it may appear crude, is simple and effective, allowing Air Traffic Controllers to devote most of their time to visually monitoring aircraft and runways. The GAAP traffic sheet system was designed solely to keep track of aircraft movements, and to act as a memory-aid for the controller, a purpose to which it was well suited. However, there is an increasing need to use the archived traffic sheets for secondary purposes such as revenue collection, calculating aircraft movements and searching for missing aircraft, a manual task which is tedious, time consuming and error prone. Consequently, this paper describes the development of an automated system that aims to provide similar functionality and usability from a controllers’ perspective (i.e. in terms of tracking aircraft movements), but significantly improves the secondary tasks through automated data logging, manipulation and querying facilities. Given the safety critical nature of the domain, such a system must offer a high level of fault tolerance, error prevention and recovery, and provide a simple and clear user interface, with a similar level of simplicity to that of the existing manual traffic sheets. However, given the substantial benefits to be obtained with the data logging facilities of a computerised system, the interface will be considered a success if its performance is similar, or even marginally slower to use (since interaction with the system involves only a small portion of the controllers overall work activity), than the existing manual system. This paper describes the implementation and testing of a keyboardless PC based system using a standard mouse as an input device. Note however, that the interface was designed with a PC compatible stylus based touch tablet in mind, so that future work can compare this type of input device with the mouse based approach in order to determine if the added expense is justified. The specifics of the user interface and a description of the various input techniques are provided in section 3.
Figure 1: Traffic sheet from existing manual system, complete with fictitious data.
2. Background This section offers a brief overview of the Australian Air Traffic Control (ATC) system as follows: Section 2.1 introduces the different types of air traffic control tower found in Australia. Section 2.2 discusses the GAAP tower in which the system described in this paper is intended for use. Section 2.3 outlines the manual flight progress strip (FPS) approach upon which the computer based system described in this paper is based. Section 2.4 concludes by discussing similar international efforts and highlighting the region specific differences necessitating the system described herein.
2.1. Categories of Control Tower There are three basic types of Air Traffic Control Tower in Australia: those located at airports equipped with radar; those at non-radar airports; and those at the mainland capital city secondary airports. The towers at the major radar-equipped city airports, such as Sydney and Melbourne, employ a combination of radar and visual observations to maintain separation between aircraft. The towers located at regional non-radar airports, such as Alice Springs and Albury, provide both aerodrome and approach control services. These towers use a process known as procedural control, whereby controllers maintain separation between aircraft using visual observation and aircraft reporting their position via radio.
The third type of control tower exists at the major secondary airports such as Bankstown in Sydney and Moorabbin in Melbourne, which handle high-density movements of light aircraft in fine weather. These nonradar towers use General Aviation Aerodrome Procedures (GAAP) to achieve aircraft separation and as such are known as GAAP towers. GAAP procedures are unique to Australia, with other countries having developed their own procedures for handling such traffic.
2.2. GAAP ATC Operations A notable difference between GAAP and other tower types is that separation between aircraft is the pilot's responsibility. The controller provides the pilot with information about other aircraft, sequence instructions and landing and takeoff clearances. Most operations do not require coordination with other ground units. The tower’s physical area of responsibility is small, usually within a 3 nautical mile (NM) radius of the airport. Operations are usually conducted on a pair of into-wind parallel runways, with each runway under the control of a separate Aerodrome Controller (ADC) using a specific radio frequency. Most flights at these airports do not submit a flight plan and thus the first time the tower is aware of a flight is when the aircraft makes a radio call. There are three types of traffic control operations carried out at a typical GAAP airport such as Moorabbin (Figure 2). These are arriving; departing, and touchand-go. Moorabbin airport, which was the location for
the testing described in this paper, serves as an exemplar for the following discussion. Most arriving aircraft approach Moorabbin from uncontrolled airspace1. An arriving aircraft will first call the tower at one of the designated approach points, which are prominent topographical features approximately 6 NM from the aerodrome. The controller issues instructions to the aircraft on how to enter the aerodrome circuit area. Approximately 2 to 4 minutes later, the aircraft reports entering the circuit area at which point it is given instructions on which preceding aircraft to follow. This is referred to as sequencing. Having received a sequencing instruction it is the pilot’s responsibility to adjust the speed or flight path of the aircraft to stay behind the preceding aircraft, even though that aircraft may be a slower type. When the aircraft is the next to land, and the runway is not occupied by either a departing or preceding landing aircraft, it is cleared to land. A departing aircraft will first call the tower when it is ready at the holding point for the runway and it is first in line to depart. The controller will either clear the aircraft for takeoff, line the aircraft up if the runway is occupied, or instruct it to hold position if there is an arriving aircraft on final approach and there is insufficient time for the plane on the ground to depart. Aircraft that are holding or lined-up will be subsequently cleared for takeoff when the runway is clear. From this point on there is normally no further communication with the tower. The cruise phase of the flight is conducted in
Figure 2: Moorabbin Airport and control tower. Runways are depicted as solid black lines. Associated taxiways and apron areas are 2 depicted as thinner grey lines.
1
The pilot is responsible for maintaining a lookout for other aircraft and must listen for and make mandatory radio broadcasts of the aircraft’s position and intentions. 2 Picture courtesy of http://www.airservicesaustralia.com
uncontrolled airspace and the aircraft will leave the tower radio frequency at an appropriate distance from the aerodrome. A third type of operation regularly conducted at secondary airports is touch-and-go circuit training. To reduce the time required for student training, takeoffs and landings are combined into one operation. When practicing landings and takeoffs, instead of vacating the runway after each landing and taxiing back to the start of the runway for a departure, the aircraft slows down until the landing is almost complete then accelerates and takes-off to join the circuit for another landing. Students often carry out 6 to 8 touch and go procedures during a training session, which are sequenced along with other arriving aircraft.
2.3. Flight Progress Strips Paper Flight Progress Strips (FPS’s) (Fields, Wright, Marti, & Palmonari, 1998; Mackay, 1999; Mackay, Fayard, Frobert, & Médini, 1998) have been used as the traditional method of recording the progress of individual aircraft flights, and to assist in representing the overall traffic situation. FPS’s, which are prepared from information submitted in a flight plan, are small strips of light cardboard measuring 25mm x 200mm and are, by convention, coloured blue (departing), buff (arriving) or pink (local). Each FPS displays information about a particular aircraft such as its radio callsign, aircraft type, the altitude or flight level, and estimated time of arrival (ETA) at a particular location. This information is subsequently used to control instructions given to the aircraft. Strips are mounted in plastic strip holders and displayed on a flight progress board, which is a board with several bays (Fields et al., 1998). The board also contains separator strips referred to as designators that indicate the progress of a flight, e.g. the CLEARED TO LAND designator. By annotating and moving the strips the controller can maintain a display of the overall air traffic situation and the instructions given to individual aircraft. The instructions issued to an aircraft can be displayed in one of two ways. One method is to annotate details of a particular instruction on the strip, such as assigning to an aircraft an altitude to be maintained. The other is to move the strip to a particular location in the bay, e.g. moving an aircraft’s FPS below the CLEARED TO LAND designator when the aircraft is cleared to land. In the major centres in Australia, paper FPS has been replaced by electronic representations and are linked to the electronic aircraft detection displays. Also, as stated in section 1, FPS’s are more complicated than required for GAAP towers and have thus been replaced with a simpler traffic sheet based system in some GAAP towers.
Figure 3: A screenshot from the newly developed GUI based system. In most other Australian Towers, paper strips are still used, being displayed in bays located on the Tower console. In summary, the geographical layout of the FPS system and the nature of the annotation and manipulation of the individual strips, lend themselves to direct manipulation interaction on a graphical user interface based system, as described in the following sections.
2.4. Existing Work The computerised system described in this paper uses the terminology and notation of the FPS system in order to provide a system that is simple and familiar to existing air traffic controllers, without the prohibitive cost and complexity of the radar based computer systems used by major airports. The appearance of the newly developed user interface can be seen in Figure 3. Doble and Hansman (Doble & Hansman, 2002) have proposed a similar system for use in United States control towers, where one portable electronic interface is used for each FPS type (buff, blue or pink), linked to a central management interface by wireless local area network. This is currently being implemented using handheld pocket PCs to display each FPS, however other technology, such as electronic paper, was considered by them to be more suitable for the production version. The use of portable media allows the strips to be handed from one controller to another. This system appears more suitable for capital city towers where different controllers
input information related to an individual aircraft, and strips are passed from one controller to another. A major limitation of the Doble and Hansman system, if it were to be applied to a GAAP environment, is that the controller would need to either look in two places, or carry out two actions, to view the full traffic situation. The controller would first have to look at the main screen, or select the aircraft event list on the PC for the overall traffic picture, in order to determine the call-sign of the next aircraft. The same controller would then refer to or select the individual FPS on the Pocket PC in order to update or view the status of that aircraft, for example, to record a landing clearance. Given this disadvantage the Doble and Hansman system was deemed inappropriate for Australia GAAP towers and thus this paper proposes an alternative in the following section.
3. METHODOLOGY This section describes the methodology for the design, implementation and usability evaluation of the computerised GAAP Flight Progress Monitoring System. Section 3.1 examines the environmental factors that influenced the choice of implementation platform and the design of the graphical user interface (Figure 3). Section 3.2 follows up by discussing the system as it exists in its current form as a working prototype. Section 3.3 concludes the methodology section by describing the experimental procedure used to benchmark the existing system and test the new system against the benchmark performance.
[B1] Sent Around button [L3] Approach Point label
[L1] Call-sign label
[B3] UP button
[B4] DOWN button
[L2] Aircraft Type label
[B2] Land button
Figure 4: Example of Arrival FPS
3.1. Environmental Factors Influencing Deployment Platform and Interface Design The theme of this paper is that the proposed GUI should aim to be as simple to use as the manual method it is designed to replace. More importantly, its use must not distract the controller from the primary duty of aircraft and runway surveillance. Adopting an electronic system that does not have a detrimental effect on the immediate operations of the controller will provide other significant benefits resulting from the electronic data capture. The system is however unlikely to be a success if either the time spent operating the interface is significantly greater than the time currently required to record aircraft movements, or if it suffers from a higher user-error rate. The importance of usability in such a system is summed up by Mackay (Mackay, 1999): “Unlike office-based users, who often must accept whatever technology is thrust upon them, air traffic controllers have a real voice in the technology they use. Because of the safety-critical nature of the system, they can reject interfaces they do not like.” There are two other considerations influencing the design of an interface of this type. The first is the significant amount of background noise in the operating environment, particularly during busy times. This is largely due to the speaker-based output of several airground radio communication programs, instead of using enclosed headsets. The use of speakers allows other controllers to monitor the air traffic situation and provide assistance in some circumstances, such as helping to locate aircraft that are difficult to sight. The second is that, although wired headsets are available for use, most controllers prefer using hand-held microphones. This allows them the freedom to move away from the console, which is sometimes necessary when looking for aircraft.
[L4] Circuit Status Label
Since the decision to use standard PC based architecture had already been made, the next consideration was the choice of input and output device. Incorporating some form of voice-activation was initially considered but deemed too unreliable due to background noise and the controller preference for external speakers and microphone, instead of an integrated headset. The next option was a combined touchpad display such as the Wacom Cintiq3 that would allow a controller to use a finger or stylus for input, thus closely imitating the existing pen and paper system. The third choice was to use a standard mouse and design the system for keyless operation as would already be the case for a touchscreen based system. Consequently the decision was made to develop an interface that was suitable for use with either a mouse or a touch screen and to perform initial testing with the mouse to determine whether such a system would be useable, given the reduced cost of such a configuration. Unlike the system proposed by Doble and Hansman (Doble & Hansman, 2002) described in section 2.4, an interface employing wireless Personal Digital Assistants (PDAs) was considered to lack sufficient space to display the number of aircraft required on a single device. Furthermore, using such a device requires twohanded operation, making the use of binoculars and microphone difficult.
3.2. Proposed GUI based System for GAAP tower operation 3.2.1. Objectives and System Overview The proposed interface was designed to imitate the flight paper strips (FPS) and FPS bays of the paper based FPS method described in section 2.3. Each aircraft is represented by a simplified electronic FPS (Figure 4), which comprises a dynamic collection of buttons and labels. The main display area (Figure 3) is divided into 3
http://www.wacom.com/lcdtablets/
bays for arriving and departing aircraft. Designators are used to indicate the status or progress of each individual aircraft, for instance, those aircraft that have been sequenced are positioned under the SEQUENCE designator. Standard aviation terminology, abbreviations and practice have been used as far as possible. For example, blue is used to indicate a departing aircraft and buff to indicate an arriving or circuiting aircraft. Pads for entering the data necessary to create a strip are located at the top of the screen. Despite being based on the more complex FPS system, the user interface has been designed to replicate the simplicity of the existing GAAP traffic sheet (Figure 1). Apart from the initial FPS creation, the press of a button is all that is required to control a strip in the display. For example, when an aircraft is cleared to land, the controller presses the CLRD LAND4 button. The system responds by moving the FPS below the CLEARED TO LAND designator and changing the button text from CLRD LAND to CLR RWY. Clearing the runway is the next significant event in the flight progress recording. The total number of button presses required to process an aircraft is similar to the number of individual annotations required to maintain the traffic sheet. A complete, Linux-based prototype of the proposed system was implemented in C++ using the Qt graphical toolkit with data logging performed via a PostgreSQL database. Since the interface was designed for mouse or stylus based input (as opposed to a finger activated touchscreen), smaller buttons were used allowing the integration of more functionality into the electronic FPS (see Figure 4). A two button mouse or stylus is required since some interface actions require a right click to minimise the chances of inadvertent operation. 3.2.2. User Interface Operation Using the data entry pad, the controller creates the initial FPS by entering the aircraft's call-sign with the virtual keypad (Figure 5) and adds additional information, such as the approach point, by selecting the appropriate radio button. Right-clicking the Callsign label activates the keypad. To cater for special task operations and the occasional itinerant international movement, up to 8 alphanumeric characters can be entered as the call-sign. The virtual keypad also has provision for pre-programmed special task call-signs. Each FPS consists of four labels and four buttons. The background colour of the labels indicates the type of aircraft movement, that is blue for departing aircraft and buff for arriving aircraft, as illustrated by the example arriving aircraft FPS shown in Figure 4. The label (L1) located at the top left of the strip displays the aircraft call-sign and the label (L2) at the bottom left displays the 4 Note that while these abbreviations may seem somewhat contracted, they are in fact the standard abbreviations used in current Australian ATC practice.
aircraft type. When a strip is created, the system accesses its copy of the Australian Aircraft Register to obtain the aircraft type. Adjacent to these labels are two buttons. In the event of an aircraft being sent around (or a pilot electing to go around), pressing the upper button (B1) will reposition the FPS back above the SEQUENCE designator. The lower button (B2) is used for all of the routine events, making it the most commonly used button. As such, it has been placed in the prominent central position. Pressing this button changes the text on the button to indicate the next event to be actioned during a normal take-off and landing sequence, and also moves the strip below the relevant designator. Next are the two other labels. The label (L3) indicates where the aircraft called inbound. The bottom label (L4) is the Circuit Status label and indicates whether the aircraft is either making a fullstop landing or conducting touchand-go circuit training. Right-clicking the label will toggle the CCTS text on or off. When the text displayed is CCTS, the FPS will continually loop through the display as a touch-and-go strip. When the label is blank, the movement is treated as a fullstop landing, in which case it will be removed from the display when the CLR RWY button is pressed. The last two buttons (B3 and B4) are the UP and DOWN buttons. These buttons perform a swap function. If there is another FPS immediately above or below the FPS, pressing the button that points to the adjacent FPS will swap the relative positions of the two strips. This function can be used if, for example, there is a need to amend the sequence or the aircraft landing order. The buttons and labels on the blue departure FPS perform similar functions. Given the critical nature of the system, and with safety as an explicit design goal, various methods are available for preventing and correcting user errors. Buttons are disabled when they are not in use. For example, the DOWN button is disabled if there is not another FPS immediately below such as when the FPS is the bottom strip of those below the CLEARED TO LAND designator. Given the defined functionality of the UP button described above, it also serves as an undo function that will return the FPS to its previous state. For example, if the controller inadvertently clicks the CLRD LAND button, clicking the UP button will move the FPS back above the CLEARED TO LAND designator and restore the button text configuration. Right-clicking the call-sign label of the FPS will display a pad that allows the controller to correct any errors that may have occurred when creating the FPS. For instance, the callsign can be changed, in which case the aircraft type will also be updated, or the strip can be deleted completely. Where error prevention was not possible, standardised warning messages have been incorporated into the interface. For example, the system will not allow a callsign to be entered if a strip with that call-sign is already active. Additionally, the controller will receive a ‘runway occupied’ warning message if an attempt is made to clear an aircraft for takeoff when there is another aircraft, such
Two experiments were conducted to evaluate the performance of the new GUI based system according to the usability criteria listed above. The first experiment involved field observation of the existing manual system to provide a benchmark for comparison with the new system, with a focus on measuring speed of performance and user error rate. In the second experiment, the performance of the new GUI based system was assessed by evaluating its usage in a simulated environment using currently working air traffic controllers with a broad range of experience. All testing and data collection was performed at Moorabbin Airport in the southeastern suburbs of Melbourne, Australia. Moorabbin Airport has two sets of parallel runways and a single runway, which has limited use, such as extreme wind conditions, as depicted in Figure 2. 3.3.1. Experimental Procedure for Benchmarking Current Manual System
Figure 5: Virtual Keypad for Callsign Entry as a landing or preceding departing aircraft, still potentially on the runway. Note that since there are some valid situations were this could be done intentionally, the controller is given the option of either cancelling or continuing with the operation if desired.
3.3. Evaluation of the GUI based System In order to evaluate the success or failure of an interface design, a set of usability metrics, appropriate for the system being tested, must be chosen. Following a task analysis of the manual system, Shneiderman’s (Shneiderman, 1998) commonly used metrics were deemed suitable. Shneiderman identifies five measurable human factors related to the usability of a system: • Speed of task performance. The amount of time occupied interacting with the system. • User error rate. The number and kind of errors made by the user. • Subjective satisfaction. Assessing whether or not the users liked using the system. • Time to Learn. The time required for a user to learn to operate the system. • Retention over time. How well do users retain knowledge of system operation?
The first task was to benchmark the performance of the existing system. This was accomplished by studying existing ATC practice. The goals of the experiment were to measure the amount of time required recording actions on the traffic sheet and to establish an accuracy rate by noting the type and number of any errors that were made (e.g. failing to record an action). The observations were conducted during two sessions in Moorabbin Tower using different aerodrome controllers (ADC) for each session. The level of air traffic was medium. The experimenter observed the controllers annotating the traffic sheet and recorded the number of successful and erroneous annotations on a pro-forma designed specifically for the purpose. For each correct annotation of an action, a mark was made on the form. If an error was observed, the error type, aircraft call-sign and current time were noted. Photocopies of the completed traffic sheets were taken for archival purposes and to assist in calculating the number of traffic movements at a later stage. The field observation sessions were also videotaped using two cameras. The first camera was suspended directly above the traffic sheet, in order to record the controller’s annotations, and thus capture the current state of the air traffic. The second camera was positioned behind the controller and was used to determine when the controller was either observing air traffic, or writing on the traffic sheet. A PC based stopwatch program was used to obtain timing information. Timing starts when the mouse button is pressed and continues timing until it is released. The data is logged to a spreadsheet where total annotation time, average time and standard deviation are calculated. To ensure consistency between controllers, annotation activity was operationally defined as starting when the controller indicated an intention to perform an annotation by either picking up the pen (or moving it towards the
traffic sheet if it was already held), and stopping when the annotation was completed and the pen lifted from the traffic sheet. 3.3.2. Results of the Benchmarking Experiment Controller workload increases as the traffic density (number of movements per hour) increases. Another factor influencing workload is the mix of traffic. Given the same movement rate, a high proportion of arrivals and departures will generate more workload in the form of more annotations per movement than will a high proportion of touch-and-go landings (TGL). One TGL counts as 2 movements, that is one landing and one takeoff, however the number of annotations per TGL is less than those required for a single landing. From Table 1 it can be seen that approximately 71% of the movements were TGL. It is therefore desirable that the simulation program to test the new GUI based system have a similar density and mix of traffic, as discussed in section 3.3.3. Table 1: Summary of Movements during Field Observation Exercises Takeoffs Landings Touch-and-Go Landings Total Movements (TGL = 2) Percentage of TGL
13 9 28 (56 movements) 78 71%
Table 1 displays the raw aircraft movement data, in terms of take-offs, landings, touch and go landings and total movements. Table 2 provides descriptive statistics and calculations of error rate according to the following classifications: • Omission: The controller failed to note an action. • Annotation: the controller noted the correct aircraft but identified the action incorrectly. • Location: the controller noted the correct action but identified the wrong aircraft. Table 2: Results of Manual System Field Observations Total annotations Omission errors Annotation errors Location errors Total errors Accuracy Average time per annotation Standard Deviation Average time entering callsign
359 0 0 0 0 100% 1.8 sec 1.0 sec 3.0 sec
With an average time of less than 2 seconds per notation, no errors were associated with the use of the existing system. This is not surprising given that the initial adoption of the system was based on its simplicity and need for minimal controller input. 3.3.3. Experimental Procedure for Usability Evaluation of the Proposed GUI Based System Because initial testing of an air traffic control system cannot be performed in a live environment, a simulated experimental environment was developed. The simulation was based on real traffic scenarios recorded during the field observation sessions used to benchmark the existing system. Two scripts were prepared, based on the radio calls of the actual air traffic derived from the videotapes of the field observation experiments5. Note that an incidental benefit, arising from using scripts rather than live traffic, is that that the number and mix of traffic (i.e. number of departures, landings and touch-and-go circuits) is the same in both experiments. By reading from the script, the experimenter assumed the role of the aircraft pilot, simulating calls such as reporting inbound or ready for takeoff. The experimenter also provided any supplementary information necessary for the controller to make sequencing decisions. This information included overall traffic state, for example whether or not sufficient room existed for an aircraft to depart if it called in ready. The scripts also contained the expected outcome, based on what had actually happened in the previously recorded scenario, as a guide to the experimenter when formulating calls and responses. This was necessary because individual controllers use slightly different techniques and thus the script could not necessarily be followed word for word. Five currently employed controllers, with computer experience ranging from occasional to advanced, took part in the usability study. Each participant was given a briefing on how the system worked, as well as a practice session using the first script. After a break of no less than 2-hours and no more than 1 day, the controller returned to participate in the real experiment, which used the second script. The session was taped and the user interface instrumented to automatically log all user interaction. The format of each participant being given a single practice exercise and then taking a break before being tested in the actual experiment was done to give an indication of the user's ability to learn and retain knowledge of the system according to Shneiderman's (Shneiderman, 1998) usability criteria (section 3.3) of time to learn and 5 Specific details of the format used in the scripts are available upon request from the authors.
retention over time. Subjective user satisfaction of the interface was determined by giving each participant a questionnaire to complete at the end of the exercise, which also included provision for general comments and suggestions for improvement. As with the benchmarking experiment, the time required by the controller to manipulate the system was established by viewing the session videotapes and measuring the time using the stopwatch program. The number and type of errors were calculated by reviewing the log files of the button presses and comparing the buttons that were actually pressed with those that should have been pressed according to the script. The error types were classified, in a similar manner to those of the field observation experiments, according to Table 3. Furthermore, task times and user-error rates were calculated for comparison with those of the traffic sheet. 3.3.4. Results of Usability Evaluation Experiment The results of the usability study are shown in Table 3 below and discussed in the following section. Table 3: Results of Accuracy Testing Total Button Presses Omission errors Annotation errors Location errors Total errors Accuracy Average time pressing button Average time for initial data entry
922 2 5 2 9 99.0 % 2.2 sec 6.0 sec
In terms of the participants’ questionnaires, most answers were either positive or neutral although in the comments section, some users favoured a modification to the interface whereby the non-sequenced aircraft were separated into arriving and circuiting sections. As described in the following section, there were also some comments about the perceived slowness of initial data input.
4. Discussion and Conclusion The accuracy rates of the two systems are comparable, at 100% for the traffic sheet and 99% for the new computerised interface. Note that the observed errors were obvious to the controller and corrected immediately, and therefore not considered critical. Speed of operation was also similar, except for that of initial data entry. The only notable deficiency of the interface discovered during testing, was the relatively slow data entry rate obtained by using the mouse to operate the virtual keypad (see Figure 5). However, this was not costly in terms of overall performance, since the only data entry requiring the use of the virtual keypad, is the
initial entry of the alphanumeric characters of the aircraft’s call-sign. Nevertheless, the following proposals, to be tested in future work, could potentially alleviate this problem: • Regular use of the virtual keypad. During the testing, participants were deliberately given one practice exercise only and had varying degrees of keyboard skills. From the experimenter’s personal experience, it is felt that regular use and familiarity with the layout of the virtual keyboard will significantly improve task performance. Additionally, alternative keypad layouts, such as a modified QWERTY design, may also have an impact on data entry performance. • Anticipation. In a real air traffic environment, controllers recognise many local aircraft by their colours and markings and could therefore anticipate data entry. For example, a controller can start typing in the call-sign of a departing aircraft as it is observed approaching the holding point rather than waiting for the aircraft to call. • Touchscreen and Stylus. Use a touchscreen and stylus, thus enabling controllers to more directly activate buttons on the virtual keypad than is the case when dragging the mouse cursor to the button and activating it with a mouse click. Note that although this is a promising option, given the additional expense, the first two options will first be explored further. An indication of the ease of initial learnability and user retention over time can be inferred from the high accuracy rate attained during testing. Participants were given only a single practice session and took a substantial break before carrying out the simulation exercise proper, yet were still able to conduct the evaluation with few errors. In contrast, a low accuracy rate would have indicated the system was hard to learn, and/or retention rates were poor. This finding was backed up by the post experiment questionnaires, which contained no negative comments related to learnability or usability of the system.
5. Summary This paper proposed, implemented and evaluated a computerised flight progress monitoring system, based on a graphical user interface, for a GAAP Control Tower. Although such a system need not directly improve controller productivity in order to be considered a success, it should not be a hindrance to the controller and should aim for the simplicity and usability of the handwritten traffic sheet system it is intended to replace. The real benefit of the computerised system is to be derived from the logging, querying and other data
manipulations made possible by the resultant electronic data capture. The interface evaluation conducted in this paper demonstrates that the proposed electronic system is largely successful and capable of replacing the manual system. However, despite comparable overall speed of operation and user error rate, the speed of initial data entry in the new system could be improved. A possible solution to this problem, to be explored in future experiments, is whether additional training, or modified virtual keypad layouts, can alleviate this problem. Also to be tested in further work is whether the use of a combined display and touch-based tablet can speed initial data entry. Novel testing methods were also introduced and in particular, the script based simulation environment used to realistically test the system in a non-live environment, is considered a contribution to research in this area.
6. Acknowledgements The authors would like to thank Air Services Australia and the staff at Moorabbin Airport for their assistance in the development and testing of this system.
7. References Doble, N., & Hansman, R. J. (2002). Preliminary Design and Evaluation of Portable Electronic Flight Progress Strips. Paper presented at the Proc. 21st Digital Avionics Systems Conference. Fields, R., Paterno, F., Santoro, C., & Tahmassebi. (1999). Comparing Design Options for Allocating Communication Media in Cooperative Safety-Critical Contexts: A Method and a Case Study. ACM Transactions on Computer-Human Interaction, 6(4). Fields, R. E., Wright, P. C., Marti, P., & Palmonari, M. (1998). Air Traffic Control as a Distributed Cognitive System: a study of external representations. Paper presented at the Ninth European Conference on Cognitive Ergonomics, University of Limerick, Ireland. Mackay, W. E. (1999). Is Paper Safer? The Role of Paper Flight Strips in Air Traffic Control. ACM Transactions on Computer-Human Interaction, 6(4). Mackay, W. E., Fayard, A.-L., Frobert, L., & Médini, L. (1998). Reinventing the Familiar: Exploring an Augmented Reality Design Space for Air Traffic Control. Paper presented at the Proceedings of CHI'98, Los Angeles, CA. Shneiderman, B. (1998). Designing the User Interface, Addison-Wesley (3rd ed.). Reading, MA: Addison Wesley.