WHEN STUDENTS BECOME USERS: DESIGN AND USABILITY EVALUATION OF A WEB-BASED LEARNING TOOL Andrés A. Lucero Faculty of Industrial Design Eindhoven University of Technology Den Dolech 2, PO 513, 5600MB Eindhoven The Netherlands
[email protected]
Felipe Muñoz Escuela de Diseño Universidad Tecnológica Metropolitana - UTEM Dieciocho 390, Tercer Piso, Santiago Chile
[email protected]
ABSTRACT This paper summarizes the design process of a Web-based learning (WBL) tool for teaching an online course on “Usability of Web Interfaces” to graphic design students. The course covered the main aspects of User-Centered Design (UCD) techniques and Usability testing. Involving students at an early stage of the design process for gathering requirements, as well as for evaluation of the tool over a three-semester period, proved to be a key motivational factor for students, allowing them to witness and take part of a UCD approach from a user-perspective. For the design team, it allowed us to improve the tool by completing three usability evaluations of the tool with real users and reach our usability goals, considering each semester as a different iteration to the design cycle.
actively involved in the design process. By considering every semester as a different design cycle and letting students systematically perform usability evaluations to our tool during three semesters, we were able to reach the success criteria of our usability goals, while students were able to see how the feedback provided by them as users should and did have an impact on the final design.
KEY WORDS Web-based Education (WBE), Innovative Web-based Teaching and Learning Technologies, Usability Testing.
2. Pedagogical Objectives
1. Introduction After summing up our individual experiences with commercial WBL tools both as students and teachers, a group of teachers from the Graphic Design Department at the Metropolitan University of Technology (UTEM) in Santiago, Chile, decided to start exploring the possibilities of delivering some of our courses through the web. With plans at a University level to deliver online courses no earlier than 2005, we decided to design our own tool that would allow us to gather experience and get started a couple of years in advance. The low flexibility and high cost of commercial WBL tools such as WebCT and Blackboard encouraged us to take on the challenge of designing, implementing and evaluating our own webbased platform. The name of the course was “Usability of Web Interfaces”, covering the main aspects of a User-Centered Design (UCD) cycle and Usability testing. Based on UCD techniques to gather requirements and participatory design [1][2], we decided to invite our students to become
Similar experiences combining research and education have been conducted by Cristea [3], however, the focus of their evaluation served the purpose of receiving feedback from students on MOT, an adaptive hypermedia authoring tool, with no clear pedagogical objectives or benefits for the learning process of the students.
In order to motivate students to make the connections that are necessary for learning to occur, they need to apply their knowledge with meaningful contexts in order to develop their own understanding of problems and concepts encountered in the course materials [4]. There were two pedagogical objectives behind each usability evaluation of our tool. The first one was to make a practical exercise in teaching UCD techniques by involving students in the design process of our tool, in the role of users. They made an evaluation of the system, allowing us to assess the performance of our tool while they could gradually experience what Usability testing consists of. Finally, they were able to witness how the suggestions made by them were reflected into changes in the design and functionalities provided by the system. This proved to be a positive motivational factor for students, as they really felt involved in the design process. This first pedagogical objective is fully presented and discussed in this paper. The second objective came at a later stage when students were asked to design an interface for a PocketPC. At this stage, we performed heuristic evaluations of their interfaces, thus allowing them to switch roles from being
users to developers. In this way, it would be possible to assess whether the user-centered approach had had an impact on them or not.
3. First Iteration We had two major influences in the way we developed our instructional tool. First of all, we followed the process for the development of training materials proposed by Nelson, Whitener and Philcox [5] which includes the assessment of training needs, analysis of training requirements, and the design, development, implementation and evaluation of training materials. Our other major source was Mayhew’s Usability Engineering Lifecycle [6] which includes similar steps as Nelson, but has a stronger focus on the usability of computer-based systems. Some additional steps introduced by Mayhew include defining platform capabilities and constraints, and setting usability goals, among others. Both Nelson and Mayhew have in common that both their processes are iterative. Additionally, we made heuristic evaluations [7] [8] of our tool, which is a simpler, faster and cheaper technique for evaluating the usability of e-learning systems. These evaluations were made for the first iteration of the design process, before we made our first usability evaluation with real users. 3.1 Basic Functionality The purpose of this first iteration was to design the first version of our tool. The list of basic functionality included: • Basic text content and feedback – The course was structured in Modules, each consisting of 3 pages thus preventing long vertical scrolling. Students should be able to navigate through these Modules and its pages by means of a menu bar. Feedback on the status of the system should be delivered at all times, including title of the module, page number and the contents. A photo of both the teacher and the student should be delivered in order to keep in mind that real people are actually behind the interaction on the web. • Multimedia content – The tool should be able to present flash movies as well as video content. A standard size for both types of content was set at 320x240 (either landscape or vertical), thus preventing long downloading times and scrolling of content due to extremely large size of the files. • Communications – One of the teachers of the course would eventually move to the Netherlands to join a postMasters programme in User-System Interaction at the Eindhoven University of Technology. Therefore, we could not entirely rely and depend on weekly or monthly face-to-face communication with the students. The tool
should allow interaction in both directions between students and teacher. Asynchronous communication through a discussion forum was preferred. Problems with students spending most of their time troubleshooting the technical failings of the course, as reported by Smulders [4] will require active teacher involvement on a daily basis to provide support for students. 3.2 Gathering Requirements Basic requirements on students’ access to the internet and platform constraints were gathered with 20 students. Students had access to the internet at the computer lab in our University; however, we were interested in knowing if they had access to the internet at home which would provide them with flexibility to follow the course from their homes and during special times of the day and week (nights and weekend). We found out that all students had internet access at home; therefore, the discussion forums would have to be visited by the teacher during weekends. Regarding platform constraints, we asked them about the kind of computers they had at home. One deciding factor for the design of the tool would be screen size and resolution. With most computers at the university configured between 1024x768 and 1400x1050 pixels of screen resolution, we wanted to find out if the same situation could be found in their homes. All students said their computer at home was set at 1024x768. 3.3 Design Our main goal for this first version of the interface was to focus on the basic functionality, trying to keep graphical elements to a minimum in order to prevent paying too much attention to them. Our assumption here was that if these design elements (layout, shapes, fonts, colours, etc.) had a strong presence on the look of the tool, our participants (graphic design students) would start evaluating the design instead of the functionality provided by the tool. We tried to make a “simple, modular and neutral” interface. For the overall layout, we decided to create a basic modular frame on which the different functional elements were placed. A wire frame was made visible to students to emphasize that this design was unfinished and that it would later be completed with their input. Colour wise black, white and grays tones were chosen. Finally, text wise, Arial font was chosen as a standard, sans-serif font, one of the most common fonts on the web. We hoped that this integrated approach to simplicity, and neutrality would also trigger students to freely share their views on how the interface could be improved on such aspects once the full functionality had been evaluated. Later on, we discovered that students really appreciated the fact that the interface seemed to be “naked”. From the very start, they felt drawn to improve the graphic design of the tool. The number of suggestions for improvement
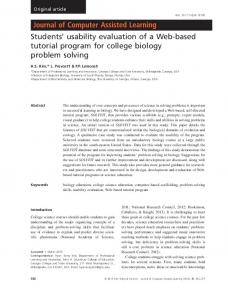
shows the motivation and level of commitment from the students once they feel that they are creating they own working space through this interface. The different parts of the interface and their functions are described in Table 1 below. Their corresponding locations within the interface can be seen on Figure 1.
server-side scripting technology, whereas JavaScript was used for the client-side. For the forum, we decided to use phpBB [10], a very simple-to-use and administer open source discussion forum. We also wanted to make use of open source components basically because they are a free community solution and many students were already familiar with it. 3.5 Participants and Method Upon start of the course, the entire class was invited for a face-to-face meeting in a classroom as an introduction to the course. An introduction on WBL and the role of both students and teacher in this new context was given at this point. Practical aspects were also discussed at this point such as providing information on where to find the online course and how to contact the teacher in the Netherlands. Students were also asked to provide a username and password, as well as provide a photo in order to set up their accounts and give them access to the course.
Figure 1: First design of the tool and its different parts. Area 1 2 3 4 5 6 7 8 9 10 11
Description Menu with Modules Picture of the student Title of the Module Picture of the teacher Login area Content area Page number buttons Flash content buttons Video content buttons News area Access to other tools (forum, references, glossary, faq, etc.)
Table 1: Different parts of the tool.
3.4 Implementation One important implementation goal was to provide a tool that would follow standards to ensure correct visualization regardless of operating systems and browsers. We followed W3C [9] standards for web development. One teacher within our group worked part-time as a web designer which allowed us to use his expertise to design and implement the interface on HTML. A web programmer helped us developing the more detailed functionality. First of all, we used a development set of server and client-side scripting. MySQL was used as the supportive database to create the dynamic content. Then, a linux system running the Apache webserver, configured to run PHP was our main platform. Finally, PHP was the
An introductory module containing information on both how the tool works and the dynamics of the course were provided to help students get familiar with the learning environment. Interactive videos and flash movies explaining the different parts of the tool were also available for the student at this point. Participants were given four weeks (four modules) to get familiar with the system after which an online evaluation was made available upon entering the course website. Students had one week to complete the evaluation. The online evaluation was completed by 20 participants, all users of the course. It consisted of 6 questions with a closed 7-point Likert scale (where 1 is “very unsatisfied” and 7 is “very satisfied”). Additionally, each question had a non-compulsory area for comments, where students were invited to elaborate on their answers. Most students felt motivated to fill-in this text field and provide more input both on the question itself and on other aspects that may not have been covered by a closed question. 3.6 Results and Discussion The first part of the results refers to the ratings on the Likert scale. Although participants rated the system positively, our usability goals had been set at reaching 6 on a 7-point scale, thus none of the usability goals were fully reached, as can be seen on Table 2. Item Easy to Use Readability Easy to Learn Easy to Navigate
Rating on Likert Scale 5 on 7 point scale 4.5 on 7 point scale 5 on 7 point scale 5 on 7 point scale
Table 2: Usability goals – First iteration.
The main problems identified by participants while working with the interface were: • Visualization – Although students had been consulted on the size and resolution of their screens both at home and at the university, three participants were not able to login at home because the login area was not displayed on 800x600 resolution screens. • Readability – In this aspect, the main problems were the small font size and poor contrast between the background and the font colour. For the latter, a dark grey colour was originally chosen while the background was a light shade of grey, close to white. This weak contrast produced the problems mentioned before. Regarding font size, 10px was the size for all text. • Graphic Design – Participants indicated that the interface for the tool and the forum looked as two very different things. They did not feel like they belonged to the same working environment. They also suggested that, adding colour would make easier, not only to identify the different areas of the tool, but to find links as well, which would make the interface easier to use. Participants also mentioned that they would be willing to help in the design of the tool themselves.
4. Second Iteration The purpose of this second iteration was to redesign and implement some of the improvements suggested by our participants. Seeing those changes implemented was a major pedagogical objective due to the positive effect in the motivation of the students. The second pedagogical objective was to illustrate the effect of UCD techniques and Usability testing for the next generation of students. 4.1 Design This second interface was the result of redesigning the tool with the improvements suggested by our users during the first evaluation. The list of major improvements includes: • Screen Resolution – By using frames and redefining the overall layout of the interface, it was possible to adapt the tool for proper visualization on 800x600 resolution screens. Buttons for page, flash and video numbers as well as the picture of the teacher were cropped to a smaller size. The size of the interface was also made flexible in order to allow optimization of the workspace on screens with resolutions higher than 1024x768. • Readability – Although CSS (Cascading Style Sheets) had been used for defining font size, initially absolute sizes in pixels had been defined which prevented users from modifying the size of the font by means of
their browser (change font size). Relative font sizes were introduced at this point to allow modifying font size. The size for the main text was set at 0.7em. Background-text contrasts were also improved by using black text on a white background thus providing the best contrast available for reading. • Graphic Design – Participants were asked to propose a redesign of the interface. However, the best suggestion was to “borrow” the colours and look of the standard PhpBB forum interface. This solution was proposed by many participants and seemed to be the safest way to comply with the need to make a uniform change to the main interface and forum. 4.2 Participants and Method The number of participants for this second iteration was 31. All participants were students from the “Usability of Web Interfaces” course. A similar method as (3.5) was used. 4.3 Results and Discussion The first part of the results refers to the ratings on the Likert scale. Although a slight improvement was observed and overall participants rated the system positively, our usability goals had been set at reaching 6 on a 7-point scale, thus none of the usability goals were fully reached after the second iteration, as can be seen on Table 3. Item Easy to Use Readability Easy to Learn Easy to Navigate
Rating on Likert Scale 5 on 7 point scale 5 on 7 point scale 5.5 on 7 point scale 5 on 7 point scale
Table 3: Usability goals – Second iteration.
The main problems identified by participants while working with the interface were: • Duplicate login – Participants mentioned that logging in twice (for access to the main interface and another for the forums) was a major problem. We noticed how navigation and ease of use remained unchanged from the first iteration to the second. It may be partly due to this reason. • Readability – Although freedom to change font size and contrasts had been improved, participants suggested it would be necessary to increase the default size of the font because it was too small. By presenting text on a larger font size, users would not need to deal with learning how to modify text size in the first place. • Viewing videos – Only few participants were able to view the videos correctly. Long downloading times (2-7 minutes) and problems with Codecs (COmpressorDECompressor) prevented students from making the
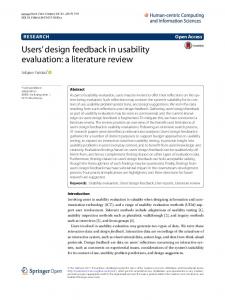
Figure 2: Design of the tool after third iteration. intended use of the video materials. No feedback was given as to what was the state of the download and what needed to be done. Students had to click on a video and wait to see what happened. In many cases, nothing did happen. This may have been another deciding factor for lack of improvement on the items ease of use and ease of learning as compared to the first evaluation.
• Readability – Font size was increased and set at 0.8em for the main text to allow better visualization of the contents.
The purpose of this third iteration was to continue with a new cycle to redesign the tool and to find potential new problems.
• Viewing videos – Once users accessed a video, a page containing that video attempted silently detecting whether the required CoDec was already installed or not. If it was not installed, installation started automatically. Users were informed by means of text that it was safe to allow the installation of the CoDec thus giving clear feedback on the status of the system. They also received information on expected waiting times depending on their type of connection to the internet.
5.1 Design
5.2 Participants and Method
This second interface was the result of redesigning the tool with the improvements suggested during the second evaluation. The list of major improvements includes:
The number of participants for this third iteration was 20. All participants were students from the “Usability of Web Interfaces” course. A similar method as (3.5) was used.
• Single login – With the use of cookies and looking into the phpBB forum documentation, this feature was implemented in such a way that students were able to access the main interface to view the contents of the module while another web page would open “underneath” it with the logging in procedure completed.
5.3 Results and Discussion
5. Third Iteration
The first part of the results refers to the ratings on the Likert scale. All our usability goals were reached except for ease of use (5.5), as can be seen on Table 4.
Item Easy to Use Readability Easy to Learn Easy to Navigate
Rating on Likert Scale 5.5 on 7 point scale 6 on 7 point scale 6 on 7 point scale 6 on 7 point scale
Table 4: Usability goals – Third iteration.
Participants did not report any critical problems while interacting with our tool. This is reflected in the improvement on every item of the usability test, allowing us to reach our success criteria in 3 out of 4 items. It is also reflected on the positive comments about the system and the modifications included in the third iteration. This version of the tool can be found online [11]. Some comments made by participants about the tool include: • “The tool is very simple to use and very functional. That’s what I like most about it, the fact that I was able to use it very quickly, interacting with it in a nice way”. • “Navigation wise it is very easy to use and it fully reaches the functional goal of delivering an online course over the internet.” • “The tool presents course contents in a clear and transparent way. Its navigation is simple which makes it accessible for anyone to use it with no major complications, regardless of their previous experiences with computers.” • “…I am really satisfied with this tool and the course in general. It surpassed my expectations on a content and operational level (interaction with other students and teacher). • “I think it is excellent… I rate it with a 7 because I was able to compare it with another online course which has plenty of errors in programming, the design is not clear, you have to complete the login procedure several times and it takes ages for pages download. The site I am referring to is www.teleduc.cl (a major online training company in Chile)”.
6. Conclusion The decision to invite students both to participate in early stages of the design process and to evaluate our online tool, had a great impact for all parties involved. Our graphic design students, unfamiliar to User Centered Design (UCD) approaches, were able to be active participants in experiencing the effect that user input has on such design cycles. The level of motivation created by the fact that their suggestions were being implemented from one cycle to another, led them to the strong belief that users have important things to say when designing a product. As teachers and researchers, this experience allowed us to create, design and evaluate a tool for Webbased Learning (WBL) while at the same time, to involve and teach students in the process.
Some technical knowledge on web design and web development was required for implementing this tool. However, the human resources needed in terms of time were not an important factor. It only took a couple of weeks each semester to coordinate every member of the team to discuss, design and implement the original design and changes after evaluations. To make sure that the discussion forums were running smoothly, at least one teacher had to visit the forums on a daily basis. Finally, the use of standard web coding (HTML), platform (PHP) and database support (MySQL) in combination with open source software (phpBB), make it easier and more accessible to implement and should be considered as a real alternative to commercial e-learning tools. Similar experiences could be carried out in different contexts.
7. Acknowledgements We would like to thank Javed Khan and for the stimulating discussions and developing the tool. We would also like students that helped us by participating evaluations.
Natalia Romero their help in to thank our 71 in our usability
References: [1] J. Muller, S. Kuhn. Participatory Design. Communications of the ACM, 36(6) 24-28. [2] J. Carroll, G. Chin, M. Rosson, D. Neale, The Development of Cooperation: Five Years of Participatory Design in the Virtual School, Proceedings of the conference on Designing interactive systems: processes, practices, methods, and techniques, 2000. [3] A. Cristea, Evaluating adaptive hypermedia authoring while teaching adaptive systems, Proceedings of the 2004 ACM symposium on Applied computing, 2004. [4] D. Smulders, Designing for Learners, Designing for Users. eLearn Magazine, http://www.elearnmag.org [5] R. Nelson, E. Whitener, H. Philcox, The assessment of End-User Training Needs, 1995, 27-39 [6] D. Mayhew, The Usability Engineering Lifecycle. Morgan Kaufmann, 1999. [7] J. Nielsen, Usability Engineering. Academic Press. Cambridge, MA, 1993. [8] J. Nielsen, R. Mack, Usability Inspection Methods. John Wiley & Sons, New York, 1994. [9] World Wide Web Consortium, http://www.w3.org [10] phpBB – Creating Communities, http://www.phpbb.com/ [11] Usability of Web Interfaces, http://usabilidad.utem.cl