Design, Implementation, and Evaluation of an Approach for Determining When Programmers are Having Difficulty Jason Carter
Prasun Dewan Computer Science Department
Computer Science Department University of North Carolina at Chapel Hill Chapel Hill, NC, USA
University of North Carolina at Chapel Hill Chapel Hill, NC, USA
[email protected]
[email protected]
ABSTRACT Previous research has motivated the idea of automatically determining when programmers are having difficulty, provided an initial algorithm (unimplemented in an actual system), and performed a small student-based evaluation to justify the viability of this concept. We have taken the next step in this line of research by designing and developing two-different systems that incorporate variations of the algorithm, implementing a tool that allows independent observers to code recorded sessions, and performing studies involving both student and industrial programmers. Our work shows that (a) it is possible to develop an efficient and reusable architecture for predicting programmer status, (b) the previous technique can be improved through aggregation of predicted status, (c) the improved technique correlates more with programmers’ perception of whether they are stuck than that of observers manually watching the programmers, (d) the observers are quicker than the developers to conclude that programmers are stuck, (e) with appropriate training, the tool can be used to predict even the observers’ perceptions, and (f) a group training model offers more accuracy than an individual one when the training and test exercises are the same and carried over a small time frame.
Categories and Subject Descriptors H.5.3 Group and Organization Interfaces: Computer-supported cooperative work.
General Terms Human Factors
Keywords Machine learning, data mining, development, semantic awareness
architecture,
software
1. INTRODUCTION Often programmers get ―stuck‖ while coding, unable to make much progress despite all efforts to address some issue. It would
Permission to make digital or hard copies of all or part of this work for personal or classroom use is granted without fee provided that copies are not made or distributed for profit or commercial advantage and that copies bear this notice and the full citation on the first page. To copy otherwise, or republish, to post on servers or to redistribute to lists, requires prior specific permission and/or a fee. GROUP’10, Nov. 7–10, 2010, Sanibel Island, Florida, USA. Copyright 2010 ACM 1-58113-000-0/00/0010…$10.00.
Figure 1: The Eclipse environment extended to show a user’s Google Talk® buddy list.
Figure 2: Notification that alerts developers of a status change.
be useful if an interested remote party could become aware of this situation through, for instance, a notification and/or status change in a buddy list. This idea extends the notion of continuous coordination [1] to continuous help, and provides a new kind of contextualized information in collaborative software development [2]. An educational setting provides particularly compelling applications of this idea because an important goal is to help students and monitor their progress. In fact, based on the results of several previous studies, mentioned later, the true benefits of this idea could actually occur in industry. One way to support this idea is to allow programmers to manually change a status field displayed to potential helpers. However, there are several apparent problems with this approach. First, studies show students and new programmers are late to use help [3], and programmers often exhaust other forms of help before contacting a teammate [4]. Even those who are willing to manually change their status are likely to not set it back, just as people forget to change their busy status in an IM tool or turn off the ―call steward‖ light in a plane. Another approach is to allow a pair of developers to monitor the progress of each other, using local [5] or distributed [6] side-byside programming. However, this approach does not scale to beyond a pair of programmers, requires continuous monitoring of the partner’s display, and is not guaranteed to succeed as an observer may not know if the actor is, in fact, stuck. Therefore, a superior approach is to develop a mechanism that automatically determines if a programmer is stuck (Figure 2) by mining logs of their interaction with the programming environment. Such an approach is bound to be iterative, consisting of the following steps: 1.
Develop an initial naïve algorithm for predicting the (stuck/not stuck) status.
2.
Implement the algorithm in one or more programming environments.
3.
Ask selected developers in lab and/or field experiments to correct the predictions made by the current algorithm.
4.
Analyze the logs to refine the set of features.
5.
Input these features to existing selected log-mining algorithms.
6.
If none of these algorithms makes a significant improvement, stop.
7.
Make the algorithm that gives the best results the current algorithm.
8.
Go to 2.
Our previous work[7] carried out the first iteration of the process, and evaluated the resulting algorithm (not implemented in any programming environment) in a study involving six student programmers, whose logs were used both in the training and evaluation phases. It leaves, however, several important questions unanswered. 1.
Is it possible to develop a common set of extensible prediction modules for different programming environments?
2.
Is it possible for the modules to have no impact on the response times perceived by the developers?
3.
How well does the previous algorithm work when it is used by industrial programmers?
4.
Is it better to train the modules using logs of the individual developer whose status is predicted, or some group of programmers that excludes him/her?
5.
What is the correlation between the perceptions of the developers and their observers regarding whether the developers are having difficulty?
6.
If these perceptions differ, how well can the predictions made by a tool correlate with the perceptions of human observers?
In the rest of the paper, we address these questions. In Section 2, we survey related work providing the inspiration for and techniques used in the paper. In Section 3, we describe the results of a small field study involving a naïve implementation of the previous algorithm, and adaptations to its semantics and implementation to overcome some of the problems exposed by this effort. In Section 4, we describe a lab study involving nine student and five industrial programmers, and a coding study in which two coders and the first author classified recordings made during the lab study using a special tool we built for this work. In Section 5, we describe the results of the study using an existing model for determining if programmers are stuck. In Section 6, we consider what happens when group and individual data from the lab and coding study are used train the tool. In Section 7, we consider privacy issues raised by this work, and present preliminary solutions to them. In Section 8, we discuss our findings and provide conclusions and directions for future work.
2. RELATED WORK The motivation for encouraging programmers to help each other is provided by a variety of previous research efforts, which have explored various degrees of couplings among developers: distributed, co-located, radically co-located, and pair programming. Herbsleb et al.[8] found that the productivity of distributed teams was lower than that of co-located teams. A more recent study by
Cataldo [9] has similar conclusions based on software quality rather than productivity. It found that the number of errors in a project was positively correlated with the number of locations involved in the project. Teasley et al. [10] studied a higher degree of physical coupling, called radical co-location, in which all team members work in a single war-room or bull-pen. They found that the productivity of radically co-located teams was higher than that of co-located ones. In radical co-location, even though the members of the team work in one room, they (can) use different workstations. Higher physical coupling is achieved in pair programming, wherein two programmers sit next to each other, sharing a workstation, and working on a single task, with one programmer, called the driver, providing input, and the other programmer, called the navigator, offering advice. Some studies of pair programming have found that it offers faster task completion times, and more importantly, after taking into account the cost of fixing bugs, much better productivity [11, 12]. The reason higher coupling offers more productivity may lie in how much developers help each other. Pair programming is centered on the idea of the two programmers helping each other with every aspect of the task. Williams and Cockburn report that ―pairs often find that seemingly ―impossible‖ problems become easy or even quick, or at least possible, to solve when they work together [11].‖ Teasley et al. [10] found that in a war-room, if someone was having difficulty with some aspect of code, another developer in the war-room ―walking by and seeing the activity over their shoulders, would stop to provide help.‖ The study by Herbsleb et al. [8] also showed the importance of a helpful software development. It found that in distributed team development, several forms of communication were more difficult: it was harder to find people, get work-related information through casual conversation, get access to information shared with co-located co-workers, get timely information about plan changes, have clearly formed plans, agree about plans, be clear about assigned tasks, and have co-workers provide help (beyond the call of duty). The study found that the perception of received help was the only factor that correlated with productivity. A related study by Hebsleb and Grinter [13] found that developers are less comfortable asking remote rather than co-located software developers for help. A study by Cataldo [9] found that the number of errors correlated with uneven distribution of engineers across locations, which, together with the other studies, seems to suggest that the team would benefit if a location with more engineers (which is likely to have more expertise, and perhaps, more time) helped the one with fewer engineers. Together, these studies seem to conclude that (1) developers often hesitate to explicitly ask for help, even when they could use it, and (2) the greater the distance between them and potential helpers, the more their hesitation, and the more difficult it is for the latter to determine if the former need help. One approach to address the second problem, described in [14], makes distributed team members aware of each other’s interactions with the programming environment. For example, [14] gives a scenario in which Bob, on seeing Alice stuck on debugging a particular class, deduces she could use help, and offers it. This distributed scenario directly mimics the war-room scenario quoted above. Providing virtual channels that give distributed users the feeling of ―being there‖ in a single location is an important goal of CSCW. However, Hollan and Stornetta have argued that if
CSCW is to be truly successful, it should go ―beyond being there‖ by providing capabilities not available in face-to-face interaction [15]. One approach to support this goal is to automatically infer when people are frustrated using cameras, posture seating chairs, pressure mouse, and wireless Bluetooth skin conductance test as sensors to collect data [16]. A problem with this approach is the overhead including time and cost of using this extra equipment. An alternative approach is to determine this information by logging developers’ interaction with the system. An important step in this direction is made in [17], which describes a loggingbased tool for monitoring student progress. Student teams use a wiki to interact with several tools including CVS, newsgroups, and a metrics module that analyzes students’ data. The wiki allows students to track their development tasks, and analyzes tasks such as file modifications to measure the workload of teams. A problem with this approach is that the rate of student progress is determined after the fact, when a project is checked-in, rather than incrementally, when the student could use help. This limitation can be addressed by logging interactions with the programming environment. The authors of [17] said they did not take this alternative because ―many students have a preferred programming environment and establishing a common one would be a challenge.‖ It is possible to overcome this problem by creating such a logger for as many mainstream programming environments as possible. Before this step can be taken, it is important to determine if such an approach is feasible. There is reason to believe it can work. Previous work by Begole et. al. [18] logged email interaction, calendar appointments, and the locations of users to show that there are rhythms or patterns in user activities. An even closer work to the topic of this paper is work by Fogarty et al [19]. Developers are randomly interrupted by a notification and their interactions with the programming environment are logged. Interruptibility is measured from the time the notification appears to the time the notification is acknowledged. The specific actions developers perform right before they were interrupted are used to determine if these actions correlate with being interruptible. These approaches represent general methods to mining data, which consists of two main steps: (a) an algorithm for deducing semantic awareness (out of office, interruptible) and (b) a scheme for training the system and evaluating the automatic scheme. Our previous work [7] applied this general approach to the problem of determining progress. This work extended an Eclipse plug-in [24] to log developers’ programming actions and allowed the developers to indicate their status: stuck (which is considered, here, synonymous with having difficulty) and making progress. Based on the event and status logs of six student programmers, it developed the following approach for automatically inferring the status. It categorized user input into five categories: navigation, edit (text insertion/deletion), remove (methods and/or classes), debug, and the programming environment losing/gaining focus. The logs were segmented into sections based on the number of events. Every 50 actions, the tool calculated the ratio of occurrences of each category of actions in that segment to the total number of actions in the segment as percentage, and used these percentages as features over which patterns were identified. This event aggregation technique was used to predict developers’
status. The intuition behind the technique was that when the ratio of edit events to total number of events decreases, programmers are stuck. The approach correctly identified 90% of the time when the students were having difficulty. This result is promising because it recognizes with high accuracy when student programmers are having difficulty even though having difficulty is a rare event. As mentioned in Section 1, this approach left several questions unanswered, which are the focus of this paper.
3. INITIAL EVALUATION AND ADAPTATIONS To determine how well the technique developed in our previous approach [7] works in practice, we took two additional implementation and evaluation steps. (1) We incorporated the algorithm in both the Eclipse and Visual Studio programming environments. (2) Some members of our research group, and one industrial software developer, used the Eclipse and Visual Studio implementations for their daily work. We gained important lessons from these steps. The industrial developer complained about frequent false positives while building a new product – a workflow system. In particular, when he started a new session, the tool gave a relatively high number of false positives because of the navigations performed to build the working set of files. He also needed more time to determine if the predicted change of status was correct, and, thus, often was not sure about his status. The second author identified two additional problems. The cost of processing incremental input events was noticeable, and sometimes intolerable, on his 3-year old laptop. Moreover, even when the tool accurately predicted he was having difficulty, seeing the status message hurt his ego, as he felt that the change in progress was caused by the difficulty of the problem rather than lack of appropriate skills! A final problem had to do with the implementation architecture: the Visual Studio and Eclipse implementations performed the same functions, but did not share code. Therefore, when a change was made to the code in the Eclipse implementation, the code in Visual Studio had to also change. Put in another way, there would need to be a different implementation of the tool per programming environment, which increases programming time and effort. We took several steps to address these problems. To address the ―hurt ego‖ issue, we changed the status message from ―Having Difficulty‖ to ―Slow Progress.‖ In addition, we allowed developers to customize the message so that the second author could, for instance, report it as ―Complex Programming.‖ To address the false positives faced by the industrial programmer, we developed a label aggregation technique that complemented the event aggregation technique. As before, we computed the status every 50 events. However, we notified the developer every 250 events – the value reported was the dominant status in the last five segments. Together, the two aggregation techniques take into account the fact that the status of a developer does not change instantaneously. In addition, we added an ―indeterminate‖ status value to capture the fact that developers need time to decide if they are stuck. At startup, before 250 events were input, the tool reported the indeterminate value. We also allowed the developer to correct a predicted status to indeterminate.
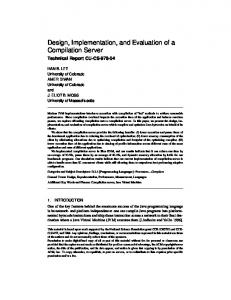
Figure 3: System Architecture Table 1: Field Study of Industrial Software Developer. Status
Guessed
# Corrected
Accuracy
Difficulty
17
2
88%
Making Progress
69
7
89%
Indeterminate
2
0
100%
Table 1 shows that the changes resulted in a high accuracy for the industrial developer. However, the table shows that the aggregation scheme results in a large number of false negatives. In particular, it missed 7 of the 22 cases when the developer was having difficulty. To develop a more accurate scheme, we gathered more data points through a user study. Before this step can be taken, it was important to address the performance and implementation overhead of the Eclipse and Visual Studio implementations. A reusable architecture is crucial for this research because of its iterative nature. We were able to apply certain standard design patterns and existing libraries to address the reuse issue. To address the performance issue, we offloaded event processing to a separate process that worked asynchronously from the programming environment. Figure 3 shows the architecture. Naturally, a separate module is needed per programming environment to intercept its events. In addition, a separate module is needed per programming environment to display the current status, which is done by using a Google talk plug-in. Thus, in our implementation we use two different event-interception and status-display modules – one pair for Eclipse, and one for Visual Studio. An event-interception module asynchronously forwards the events to a separate process, which makes the predictions. As the process was written in C#, serialized events could be sent directly from
Visual Studio to this process. Java events, on the other hand, require conversion, and we were able to use standard (WOX and IKVM) libraries to do so. Consider now the modules in the predicting process. Events are received by the ―communication director‖ of the system, the mediator, which mediates between a pipeline of other modules. The mediator gives the received event to the first module in the pipeline. In addition, it receives output from each of these modules and feeds it as input the next module, if such a module exists. The first module to receive input from the mediator is the event aggregator module. This module aggregates 50 events and passes these events to the mediator. The mediator passes these events to the feature extractor module, which computes the ratios that are used to predict a status. The feature extractor passes the ratios to the mediator, and the mediator gives these ratios to the prediction manager. The prediction manager includes the decision tree algorithm (used in [7]), which uses previous data and the ratios to predict a status. This status is passed to the status aggregator, which aggregates each status and gives a final prediction to the mediator. The mediator delivers this status to the status displayer of the appropriate programming environment. The benefit of using the mediator pattern is that it allows modules to be loosely coupled so that any change in the flow of communication would not require a change to a module. For example, if the status manager had to be omitted, the mediator would have to change. However, the other modules in the system would stay the same. The iterative nature of this research requires the ability to easily change also the behavior of each of the individual modules in this pipeline. We used the standard Strategy pattern to achieve this goal. We give below specific uses for it in our context by considering each of the phases in the pipeline, and showing that multiple algorithms could be used in each phase. 1.
Event aggregator: There are at least two algorithms that can be run to aggregate events. The current algorithm uses discrete, independent chunks of 50 events. An alternate option is to use a gradual sliding window approach similar to the approach used in TCP/IP. The code below shows the use
Figure 4: Video Coding Tool of the strategy pattern to easily switch between the two, assuming both are implemented: EventAggregator ea = new EventAggregator(); //ea.setEventAggregationStrategy(new SlidingWindow()); ea.setEventAggregationStrategy(new DiscreteChunks()) Feature extractor: We currently extract features based on the number of events. For example, the edit ratio it computes is the number of edits divided by the total sum of all actions including editing. It would also be useful extract features based on time such as editing time/total time. Another useful feature that was observed while watching developers solve problems is the number of exceptions per run. Prediction manager: We currently use two machine learning algorithms, decision tree and classification via clustering, to predict developers’ status. In the future, we plan to test other classification or clustering algorithms, and perhaps build our own algorithm. Status manager: There are at least two ways to aggregate statuses. Currently, we aggregate five statuses and take the most dominant status. This algorithm is similar to aggregating events in discrete chunks. Another approach is to use a sliding window, which corresponds to using a sliding window to aggregate events.
Thus, we must try and ensure that developers face difficulty in the small amount of time available (1-4 hours) for a lab study, and yet do not find the problems impossible.
Our experience with the new architecture showed that (a) as expected, when multiple strategy objects were implemented for a stage, it was indeed trivial to replace one with the other, and (b) the asynchronous processing did not result in perceptible delays in user-response times.
However, there is a question as to whether participants would accurately report their status, given the hurt ego problem faced by the second author. Moreover, it is useful to compare the tool’s predictions about a developer’s status with that of a third party manually observing the developer. Therefore, the first author and two independent coders observed participants' programming activities and made an independent determination of their status. To allow coders to independently and asynchronously observe participants' programming activities, we used Microsoft Live Meeting® to record the participants' screens. Live Meeting® also allowed the first author to observe remote sessions. In fact, Tang et al. [20] argued that screen recording is an effective and
2.
3.
4.
We were now ready to do a controlled user study to evaluate the adapted algorithm and investigate additional adaptations based on this study.
4. USER AND CODING STUDY In a controlled user study, the problems must be chosen carefully. Our previous work [7] found that having difficulty is a rare event.
We used problems from the Mid-Atlantic ACM programming competition. These problems are attractive because they have varying difficulty. We piloted several problems to find problems that were difficult but not impossible to solve by the subjects. Based on these pilots, we settled on the problems shown in Table 2. The table characterizes the difficulty of each problem by showing the number of teams that solved the problem, the total number of teams, and the fraction of teams that solved the problem. The difficulty level of each problem was determined by the number of teams that solved the problem. For example, 100% of teams that attempted the Simple Question of Chemistry problem solved it, while only 16% of teams that attempted the Balanced Budget Initiative Problem solved it. Five industrial and nine student programmers participated in the study. Participants were instructed to correct an incorrect prediction by the system using status-correction buttons (Figure 5). By measuring how often the developers corrected their status, we could, as in [7], measure the accuracy of our approach with respect to the perceptions of the developers.
Table 2: ACM problems from Mid-Atlantic contest.
5. STUDY RESULTS
Year
Problem Title
# of teams that solved problem
# of teams
% correct
2006
Shrew-ology
43
138
31%
2004
Balanced Budget Initiative A Simple Question of Chemistry
23
142
124
124
2002
16% 100%
unobtrusive technique when subjects do not feel it invades their privacy. We obtained participants' consent to record their screens. We recorded 40 hours and 44 minutes of video. To relieve coders from watching hours of video, we created a video observation tool, shown in Figure 4. This video tool shows all segments where the participant, first author (while observing the experiments and later when randomly sampling the video), or system indicated the participant was having difficulty or not sure of their status (indeterminate). As it turned out, in our study, there was one indeterminate segment (indicated by a participant). We shall refer to these segments as ―stuck‖ segments. As there were few such segments, we asked the coders to classify each of these segments. It was not reasonable, however, to ask them to classify all of the other segments, which would have involved watching over forty hours of video. We could use a statistical sampling approach to reduce the number, but because having difficulty is a rare event, we would have had to sample the vast majority of segments to capture the false negatives. Therefore, we used the following, somewhat arbitrary approach to choose the ―making progress‖ segments. We randomly chose these segments, and made the number of randomly sampled points about the same as the number of having difficulty or indeterminate segments. If there were fewer than three having difficulty or indeterminate segments, we randomly sampled three segments. We shall refer to the randomly sampled segments as ―random segments‖. Each segment was two minutes of video. Coders were not aware of the status of each segment and had to classify the segment as making progress or slow progress. They were shown the video that corresponded to a particular participant and problem. If there were any segments for the coder to classify, they were shown on a line below the track bar. The segments on the line corresponded with the particular point in the video the coder needed to classify. To classify segments, coders right clicked on the segment to label it as ―slow progress‖ (the message displayed for ―having difficulty‖), and left clicked to label it "making progress". An image of a mouse was provided to remind coders what each mouse button meant, and a legend was also provided to help coders remember that a black segment meant the segment was unlabeled, a red segment meant slow progress, and a green segment meant making progress. Two coders and the first author classified 26 stuck segments and 36 random segments.
After the user study and coding phases were complete, we were able to answer the following questions: What is the correlation between (a) predictions of the two coders; (b) developers’ and coders’ perception of status, (c) predictions of the tool and the developers’ perception of the status, and (d) predictions of the tool and the coders’ perception of the status? As we see below, the answers depended on whether the segment involved was one of the ―stuck‖ segments or random segments. Table 3 shows that coders agreed 88% of the time with each other on stuck segments, and 83% of the time on random segments, and overall they agreed 85% of the time. To determine the level of agreement within the stuck (random) segments we counted the number of times observers agreed with each other and divided that by the total number of stuck (random) segments observed. Interestingly, coders agreed that in 50% of the random segments, which were classified by the tool as ―making progress,‖ participants were actually having difficulty. We examined these eighteen cases individually and found three segments that were three minutes before a stuck segment, so in these cases, the observers were quicker than the tool in determining the status of these segments. In the remaining fifteen segments, the coders seemed to take the inactivity of developers as being stuck. The three early observations were not counted as incorrect. So what did the participants themselves feel about their status in case of these segments? By definition, they agreed completely with the predicted status for these segments, as these were the segments that were classified by the tool, participant, and first author as ―making progress‖ segments. We noticed that coders seemed to have a difficult time classifying participants when they were idle, and apparently thinking. The tool uses developers' actions to predict their status and does not take into account think times or when developers are idle. Therefore, we consider the fifteen random segments as ―making progress‖ when computing the accuracy of the tool. Consider now the non-random or ―stuck segments.‖ Again, these are the segments classified either by the first author, or the participant, or the tool as ―having difficulty‖. These segments tell a very different story. Table 4 shows the agreement of the coders with the tool, the author, and the participants for these segments. Interestingly, coders agreed with the tool 100% of the time that participants were stuck. Perhaps even more interestingly, participants never corrected a ―having difficulty‖ status predicted by the tool. In four of these segments, participants corrected the ―making progress‖ prediction of the tool. Three of those times, participants indicated they were having difficulty, and one of those times participants indicated that they were not sure of their status (indeterminate.) In nine of these segments, the first author classified the ―making progress‖ prediction of the tool as actually ―having difficulty‖. The coders agreed with seven of these observations (77%). Coders agreed with the participant 75% of the time. The coders disagreed with the participant who indicated indeterminate as the status. The first author also reviewed this disagreement and agreed with the coders that the participant was indeed having difficulty. Several (preliminary) conclusions can be drawn from these results. What is perhaps most remarkable is that when the tool
Table 3: Observer's agreement with each other. Segment Type
# of Agreements
# of Observations
% Agreement
The other interpretation relies on the observers (coders and first author) rather than the participants. The rationale for doing so is that participants tend to underreport their problems [21]. The false negatives of the tool can be explained by two factors: 1.
Stuck segments
23
26
88%
Random segments
30
36
83%
Total
53
62
85%
Table 4: Coders’ agreement with the tool, first author, and participants (stuck segments). Entity
# of Agreements
# of Observations
% Agreement
Tool
13
13
100%
First Author
7
9
77%
Participant
3
4
75%
Total
23
26
88%
predicts programmers are having difficulty, all three types of humans involved in making the prediction – the participants, the coders, and the first author, also think they are having difficulty. Thus, the tool does not seem to give a false positive, which is a very strong result, and a significant improvement over the results in our previous work [7]. Moreover, if we take the participants’ perceptions as ground truth, the tool also gives negligible false negatives – only four segments out of 1222 segments in the entire study were corrected. On the other hand, if we take the coders’ agreements as ground truth, the results are not so good, and it seems, based on our sampling, the tool missed half of the positives (stuck status). There are two ways to interpret these data. The first relies on the viewpoint of the participants rather than the coders. The argument for doing so is that the observers could not read the mind of the participants, and were probably looking only at idle times to deduce the developer status. Idle times, alone, are not sufficient to distinguish between thinking and having difficulty. Our tool, on the other hand, keeps track of and computes a larger number of factors, such as the navigation, edit, and focus ratios, and thus agrees more with the participants. In fact, when asked about the accuracy of the tool, participants commented that they were happy with it (Table 4). The numbers shown in the table are represented by the following two comments: "I think it worked pretty well; It's non-intrusive, and only pops up with information when the status changes." " It knew when I was having issues cause it switched to slow progress and when I was flyin doing all the class design it said progress."
2.
The tool uses developers' actions to predict their status, and does not take into account idle times, which should probably be considered in a future algorithm. The training set consisted of data from the six student programmers logged in our previous work [7], who used the tool during normal ―field work‖ consisting of assignments and research projects. The behavior of these programmers was different in some ways from those of several of the programmers in this lab study. The first group primarily used the Internet to look for help when they were having difficulty. The participants in this study did not use the Internet often because of the type of tasks and duration of this study. The only times they used the Internet was to remember syntax or look at the Java or .NET API. Moreover, the two groups solved different types of problems, and the group in this study also included industrial programmers. One piece of objective data seems to indicate that the type of programmer may be a factor in automatic status prediction. For three student participants, the automatic predictions were completely in agreement with the perceptions of the coders, when the coders agreed.
Even under this interpretation, our tool seems useful because of the zero false-positive rates. It seems that if a choice has to be made between low false positives and negatives, the former is more desirable, as it does not unnecessarily waste the time of the developers and those who offer help. Missing some ―having difficulty‖ statuses is no worse than the current practice of not having any automatic predictions. Our tool did give several positives (thirteen), which were all correct under this interpretation. Thus, if it is considered desirable to automatically let others know about developers’ difficulties – an assumption of this research based on previous work - then it seems better to use our tool than not use it. Naturally, it is attractive to try and reduce the false negative rate (under the second interpretation) without increasing the false positive rate. One way to do so is train the system using the observers’ conclusions rather than developer corrections (assuming the former are true). Moreover, the accuracy can be further improved if the training data involved the same exercises as the ones used in the testing phase. We could either build a group model, in which the data of multiple developers is aggregated during the training phase, or an individual model, where no aggregation is done. (The approach described so far was also a group model, but in it, the training group was smaller and solved different problems) Therefore, we decided to, next, explore these directions.
6. PREDICTING OBSERVER STATUS To build the individual and our group models, we assumed the following ground truth. All segments classified by the participants as stuck, were indeed stuck segments. Participants implicitly classify segments as stuck when they do not correct a stuck prediction of the tool. They explicitly classify them as stuck when they correct a ―making progress‖ segment as ―slow progress‖. Of the remaining segments, if the first author and the two coders classified a segment as stuck, then it was also a stuck segment,.
Accuracy of Tool
6
12
5
11 Participant
Particpant
Accuracy of Tool
4 3
10 9
2
8
1
7
Accuracy 0%
Group Stuck Group Overall Ind. Stuck Ind. Overall
50%
100%
1 2 3 4 5 6 75% 100% 100% 33% 100% 50% 96% 98% 100% 93% 100% 99% 75% 94% 96% 95% 100% 98% 94% 97% 98% 97% 92% 98%
Figure 5a: Accuracy of tool (participants 1-6) regardless of how the participant classified it. All other segments were making progress. To build and evaluate the individual model, we used a standard technique, known as cross validation, which executes 10 trials of model construction, and splits the data so that 90% of the data are used to train the algorithm and 10% of the data are used to test it. In some of the participant's training sets, the number of ―making progress‖ segments vastly outnumbered the number of ―having difficulty‖ segments, resulting in low accuracy in predicting the "having difficulty" segments. This is an example of the class imbalance problem in classification algorithms, wherein the accuracy of predicting an event can decrease as the frequency of a rare but important event decreases. The SMOTE [22] algorithm implemented in the WEKA toolkit [23] overcomes this problem by replicating rare data records until that data are equal to the more common data. Therefore we used this scheme in the data sets of those participants who experienced the class imbalance problem. In our case, we used an accuracy threshold of 90% to determine if a participant experienced this problem, which was the accuracy of our previous approach [7]. The accuracy of the model without SMOTE was 66% or less for participants who had difficulty 20% or less of the time. For participants who had difficulty more than 20% of the time, the accuracy of the model without SMOTE was 94% or more. Thus, according to our threshold, participants who had difficulty less than 20% of the time faced the class imbalance problem. For these participants, we used SMOTE to replicate the ―having difficulty‖ segments. In the case of the remaining participants,‖ having difficulty‖ was either less or about as frequent as ―making progress‖. Thus, there was never a need to use SMOTE to replicate the ―making progress‖ segments. Three of the twelve participants faced so much difficulty that they
Accuracy 0%
Group Stuck Group Overall Ind. Stuck Ind. Overall
50%
7 8 9 90% 100% 100% 96% 92% 98% 80% 83% 97% 92% 92% 97%
100% 10 100% 98% 98% 99%
11 100% 100% 95% 96%
12 100% 100% 91% 90%
Figure 5b. Accuracy of tool (Participants 7-12) did not complete two of the three exercises. To build the model for a particular individual, we used that individual's data as both the training and test set. To build the group model, we aggregated the data from all of our participants except data from the participant whose status we were trying to automatically predict. The exclusion was meant to test if a tool trained by one set of developers could be used to predict the status of another. We used the group data to predict the status of each individual. The group data set did not suffer from the class imbalance problem because some of the participants had difficulty just as much as they were making progress. As mentioned before, even those who made relatively smooth progress experienced some difficulty. The decision tree algorithm [23] was used to build both the individual and group models. Figures 5a and 5b show the accuracy of the tool. We considered four accuracies: (a) group stuck: the accuracy of the group model when predicting having difficulty, (b) individual stuck: the accuracy of the individual model when predicting having difficulty, (c) group overall: the accuracy of the group model when predicting both making progress and having difficulty, and (d) individual overall: the accuracy of the individual model when predicting both making progress and having difficulty. The accuracies are shown for all but two participants. These two participants were not included because their data was not collected correctly. We expected each individual's model to be more accurate than the group model, but surprisingly, the group model was more accurate in predicting both ―having difficulty‖ and ―making progress‖ than the individual model. This unintuitive result is likely because the group model has more data than the individual model. It is
Table 5: Survey Questions and Results (Scale: 1 = Strongly Disagree to 7 = Strongly agree). Survey Question
Mean
Median
STDDEV
Q1
I felt that the tool was accurate.
6
6
.95
Q2
I would prefer to use a speech interface (speaking your status) instead of pressing buttons to correct the status.
2.83
3
1.53
possible that with more training, the individual model would perform better. Even then, it may not be the preferable approach because participants, probably, would not like training the tool. In fact, during the debrief one participant commented that pressing buttons "stopped my flow of thought" and another participant felt that pressing buttons "sort of broke my concentration". We asked participants if they preferred to speak their status because this could help reduce breaking their concentration (Table 5). Participants did not like this feature either, and felt it would be disruptive to those around them. There were two participants whose accuracy was 50% or below. We examined these cases and determined that the tool believed these participants were making progress while human observers believed the participants were stuck. In each case, the participants were performing significant edits, which indicated to the tool that they were making progress. However, these edits involved a large number of deletions. This kind of activity suggests that, when extracting features, editing actions should be split into two categories: insertion and deletion of text. The evaluations above show that it is possible to increase the agreement between a tool and a set of observers by (a) keeping the exercises the same in the training and evaluation set, and (b) using the judgments of these observers in the training set. Additional iterations are required to determine if (a) a tool trained using one set of exercises can be used to predict the status for another set of tasks, and (b) judgments of one set of observers can be used to agree with the judgments of another set of observers.
7. PRIVACY So far, we have assumed that letting others know about difficulties of others is good. This assumption is probably true when the observers are mentors/advisors, as suggested in [3]. However it is possible to have observers who judge programmers without actually helping them. These judgers can use information about developers being stuck repeatedly in a negative manner which could cause programmers to lose respect in their team. Even when observers can be trusted, the developers may want more time to investigate their problems. There are several ways to solve this problem. One approach is to block judgers, a feature readily available in Google Talk and other IM clients. The problem with this approach is that blocked judgers can realize that they are blocked, which could cause them to become hostile. Therefore, a superior approach is to allow programmers to decide which status they want to report. Figure 6 shows a preliminary scheme we have implemented to support this feature, which is also used by developers to train the system. This interface reports two statuses – the true status and the reported status. Buttons are provided to change both statuses.
Figure 6: Training user interface that show actual versus report status. The buttons that change the true status are used to train the system and the buttons that change the reported status determine what others on their buddy lists see (Figure 1). The true status field is automatically copied to the reported status field after a certain time lag. During this time, developers can manually disable the copying. Assuming that having difficulty is indeed a rare event, this user-interface does not impose substantial overhead. We have not formally evaluated these privacy controls, but we have gotten some initial feedback from those who have used them. Users would indeed like to customize not only what status is reported, but when it is reported, and to whom it is reported. Thus, this scheme must be extended to control the nature and timing of reported status for different classes of observers such as (a) human observers and tools, (b) a team member sitting on the next seat, radically co-located, and distributed, (c) a close friend, mentor, and boss, and (d) team members who have and do not have the expertise to help solve a problem. Such elaborate customization could make the overhead required to use the tool high. Future versions of this scheme must allow for setting user-specific defaults. For example, the number of IM messages with team members can be used to identify close friends; organization charts can be used to find mentors and bosses; location information can be used to find the physical distance between developers and various observers; and the difficulty each team member has with different pieces of a project can be used to find expertise. In addition, the tool can adapt how developers morph the reported status. For instance, if they always report the indeterminate status to their boss, then the tool could ask them if they wish to set this value automatically for this observer.
8. CONCLUSIONS AND FUTURE WORK This paper contributes to both the general area of semantic awareness and the specific subarea of providing awareness about developers’ progress. To the best of our knowledge, other work on semantic awareness has not tied the judgments of third-party observers with those of a tool. Our work shows that (a) these judgments can be different from those of the actors about whom the awareness is being provided, (b) a special tool must be provided to gather third-party observations, and (c) it is possible to train an automatic tool to agree, to a high degree, with those of the observers. Our main contributions, of course, are in the subarea of difficulty prediction. We have identified a pipeline of modules for predicting and displaying difficulty. We have also shown the usefulness of two well-known design patterns, Mediator and Strategy, in implementing the pipeline. We have created an architecture that allows the pipeline implementation to be reused by and execute asynchronously with multiple programming environments. Our evaluations show that label aggregation can be used to significantly improve the accuracy of a difficultyprediction algorithm, and a group training model offers more accuracy than an individual one under certain circumstances. They also show that it is possible to build a tool that does not give false positives, regardless of whether the participant or observer judgments are used about the ground truth. Finally, we motivate
and present new user-interfaces for customizing status messages and exporting the status to others. As mentioned before, it would be useful to formally evaluate a design space of status customization and exporting interfaces, and determine if (a) a tool trained using one set of exercises can be used to predict the status for another set of tasks, and (b) judgments of one set of observers can be used to agree with the judgments of another set of observers. Perhaps the biggest unresolved issue raised by this work is whether the participants or observers should be relied upon to determine if developers are stuck. Perhaps more observations are needed to help resolve this issue. Another, more objective approach, is to make the following assumption: The fraction of ―having difficulty‖ segments is proportional to the inherent difficulty of the problem. By using problems of known difficulty, we can determine whether the judgments of observers or developers correspond more closely with problem difficulty. Once this issue is resolved, the next step would then be to deploy the tool in larger field studies and determine (a) what the developers feel about the accuracy of the tool, (b) how often and to whom they export the ―having difficulty‖ status, and (c) how often and from whom they accept help. Naturally, based on this experience, we can expect additional iterations through the design process identified earlier. Assuming that observers are not reliable in characterizing developer’s difficulty level, a pair of programmers working sideby-side [6] could use difficulty notifications to determine if they should help each other. Moreover, knowing the rate at which developers get stuck may be useful not only for determining if they need help. It could be used to (a) characterize the inherent difficulty of new problems, (b) determine the expertise of developers to solve certain kinds of problems, (c) estimate how long it will take them to complete their task, (d) compare the effectiveness of the various coupling degrees, mentioned earlier, in reducing the number of times developers face difficulty. This paper provides a basis and motivation for carrying out these future research directions.
9. ACKNOWLEDGEMENTS This research was funded in part by NSF grants IIS 0312328, IIS 0712794, and IIS-0810861. We would like to thank the study subjects.
10. REFERENCES 1. Redmiles, D., et al. Continuous Coordination: A New Paradigm to Support Globally Distributed Software Development Projects. Wirtschaftsinformatik, 2007. 49 (Special Issue): p. 28-38. 2. Sarma, A., D. Redmiles, and T.R. André van der Hoek. , TRUNL-CSE-2009-0017, 2009, The Coordination Pyramid: A Perspective on the State of the Art in Coordination Technology. 2009, UNL. 3. Begel, A. and B. Simon. Novice software developers, all over again. in International Computing Education Research Workshop. 2008. 4. LaToza, T.D., Venolia, G., and Deline. R. Maintaining Mental Models: A Study of Developer Work Habits. in Proc. ICSE. 2006: IEEE.
5. Nawrocki, J.R., et al., Pair Programming vs. Side-by-Side Programming, in Software Process Improvement. 2005, Springer Berlin Heidelberg. p. 28-38. 6. Dewan, P., et al. Experiments in Distributed Side-by-Side Software Development. In IEEE CollaborateCom. 2009. 7. Carter, J. and P. Dewan. Are You Having Difficulty? In Proc CSCW. 2010. 8. Herbsleb, J.D., et al. Distance, dependencies, and delay in a global collaboration. In Proc. CSCW. 2000. 9. Cataldo, M. Sources of Errors in Distributed Development Projects: Implications for Collaborative Tools. In Proc. CSCW. 2010. 10. Teasley, S., et al. How does radical collocation help a team succeed? In Proc. CSCW. 2000. 11. Cockburn, A. and L. Williams, The Costs and Benefits of Pair Programming. Extreme Programming Examined. 2001: Addison Wesley. 12. Williams, L., et al. Building Pair Programming Knowledge through a Family of Experiments. in IEEE ISESE. 2003. 13. Herbsleb, J. and R.E. Grinter. Splitting the Organization and Integrating the Code: Conway's Law Revisited. Proceedings of International Conference on Software Engineering. 1999. 14. Hegde, R. and P. Dewan. Connecting Programming Environments to Support Ad-Hoc Collaboration. In Proc. IEEE/ACM ASE. 2008. 15. Hollan, J. and S. Stornetta. Beyond Being There. In Proc. CHI '92 . 16. Kapoor, A., Burleson, et al., Automatic Prediction of Frustration. International Journal of Human-Computer Studies, 2007. 65(8). 17. Liu, Y., Stroulia, E. A Lightweight Project-Management Environment for Small Novice Teams. In Proc. of 3rd International Workshop on Adoption-Centric Software Engineering. 2003. 18. Begole, J.B., et al., Work Rhythms: Analyzing Visualizations of Awareness Histories of Distributed Groups. In Proc. of CSCW. 2002. p. 334-343. 19. Fogarty, J., Ko, A., Aung. H. H., Golden E., Tang, K. and Hudson S. Examining Task Engagement in Sensor-Based Statistical Models of Human Interruptibility. In Proc. CHI, 331-340, 2005. 20. Tang, J.C., et al. Unobtrusive But Invasive: Using Screen Recording to Collect Field Data on Computer-Mediated Interaction. In Proc. CSCW. 2006. 21. Shrauger, J.S. and T.M. Osberg. The Relative Accuracy of Self-Predictions and Judgments by Others in Psychological Assessment. Psychological Bulletin, 1981. 90(2): p. 322-351. 22. Chawla, N.V., et. al., Smote: Synthetic minority oversampling technique. Journal of Artificial Intelligence Research, 2002. 16. 23. Witten, I.H., Frank, E. Data Mining: Practical Machine Learning Tools and Techniques with Java Implementations. 1999: Morgan Kaufmann. 24. Eclipseye—spying on eclipse. Bachelor’s thesis, University of Lugano, 2007.