PROTOCOLS published: 17 September 2015 doi: 10.3389/fgene.2015.00287
Design, measurement and processing of region-specific DNA methylation assays: the mass spectrometry-based method EpiTYPER H. Eka D. Suchiman, Roderick C. Slieker, Dennis Kremer, P. Eline Slagboom, Bastiaan T. Heijmans † and Elmar W. Tobi * † Edited by: Krassimir Yankulov, University of Guelph, Canada Reviewed by: Simonetta Friso, University of Verona School of Medicine, Italy Jorg Tost, Commissariat à l’Energie Atomique, Institut de Génomique, France *Correspondence: Elmar W. Tobi, Molecular Epidemiology, Department of Medical Statistics and Bioinformatics, Leiden University Medical Center, Einthovenweg 20, PO Box 9600 Zone S5-P, 2300RC Leiden, Netherlands
[email protected] †
These authors have contributed equally to this work. Specialty section: This article was submitted to Epigenomics and Epigenetics, a section of the journal Frontiers in Genetics
Received: 04 June 2015 Accepted: 28 August 2015 Published: 17 September 2015 Citation: Suchiman HED, Slieker RC, Kremer D, Slagboom PE, Heijmans BT and Tobi EW (2015) Design, measurement and processing of region-specific DNA methylation assays: the mass spectrometry-based method EpiTYPER. Front. Genet. 6:287. doi: 10.3389/fgene.2015.00287
Frontiers in Genetics | www.frontiersin.org
Molecular Epidemiology, Department of Medical Statistics and Bioinformatics, Leiden University Medical Center, Leiden, Netherlands
EpiTYPER® is a mass spectrometry-based bisulfite sequencing method that enables region-specific DNA methylation analysis in a quantitative and high-throughput fashion. The technology targets genomic regions of 100–600 base pairs and results in the quantitative measurement of DNA methylation levels largely at single-nucleotide resolution. It is particularly suitable for larger scale efforts to study candidate regions or to validate regions from genome-wide DNA methylation studies. Here, we describe in detail how to design and perform EpiTYPER measurements and preprocess the data, providing details for high quality measurements not provided in the standard EpiTYPER protocol. Keywords: bisulfite, EpiTYPER® , region-specific, mass spectrometry, quantitative, DNA methylation
Introduction R EpiTYPER (Ehrich et al., 2005) is a technology to quantitatively assess DNA methylation of R multiple CpGs in genomic regions of 100–600 base-pairs. EpiTYPER uses the Agena Bioscience R
(previously Sequenom Inc.) MassArray set-up which has a high degree of automation and sufficient throughput for the larger scale evaluation of candidate regions. EpiTYPER has been successfully used for candidate gene studies in many fields, including in studies on cancer (Radpour et al., 2009), development (Loke et al., 2013), and nutrition (do Amaral et al., 2014). Another major application is in the validation of regions identified in various genome-wide DNA methylation assays (Christensen et al., 2010; Figueroa et al., 2010; Popp et al., 2010; Zeilinger et al., 2013; Tobi et al., 2014) or follow-up of findings from such studies in thousands of additional samples (Zhang et al., 2014). The good quantitative accuracy of the technology has been used to detect DNA methylation differences between conditions down to a few percent points depending on the sample size (Tobi et al., 2012). EpiTYPER is particularly useful for projects that require the measurement of larger numbers of samples or regions since a single EpiTYPER run yields 126 triplicate measurements. Including required controls, it entails an experiment on a 384-well PCR plate. The set-up is flexible in the number of samples and regions that are combined in a run. The method is, however, not cost-effective for projects entailing less than 126 triplicate measurements.
1
September 2015 | Volume 6 | Article 287
Quantitative DNA methylation EpiTYPER® measurements
Suchiman et al.
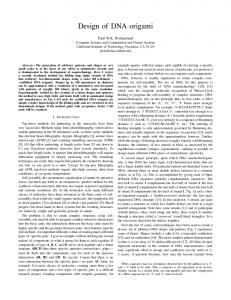
The principle of EpiTYPER is mass based re-sequencing of PCR amplified bisulfite converted DNA with a mass spectrometer and involves several biochemical steps (Figure 1) (Ehrich et al., 2005, 2007). In short, genomic DNA (gDNA) is treated with bisulfite which leads to a conversion of all unmethylated cytosines, while methylated cytosines remain unaffected. A PCR is performed on the bisulfite converted DNA with primers tagged with a T7 promoter. After shrimp alkaline phosphatase treatment, to discard unincorporated DNA nucleotides, the T7 promoter added during PCR is used to transcribe the PCR product from the reverse strand, yielding a single stranded RNA product. This RNA product is cleaved with RNase A resulting in a specific fragmentation of the RNA product. After a final cleaning step with a resin the samples are loaded on R II Array, which prepares the fragments for a SpectroCHIP separation on mass with the mass spectrometer. The mass spectrometer is a Matrix Assisted Laser Desorption-Ionization Time of Flight (MALDI-TOF) device. The matrix on the SpectroCHIP II absorbs the energy of the laser and transfers it to the RNA fragments which subsequently become ionized. The ionized fragments are separated by the time it takes to arrive at the detector in at the end of the mass spectrometer’s flight tube under the influence of an electric field. The time of flight increases with higher mass. A fragment containing one or more CpG dinucleotides is called a CpG unit. If a CpG dinucleotide was methylated and protected from bisulfite conversion, the corresponding RNA fragment, the CpG unit, will be 16 Da heavier in mass when the CpG dinucleotide was methylated, resulting in a 16 Da shift in the mass spectrum. The
signal detected by the mass spectrometer for either fragments is proportional to the number of fragments. The number of fragments is quantified by the surface area of the corresponding peaks in the mass spectrum. The DNA methylation percentage of a given CpG is calculated by dividing the surface area of the peak representing the methylated fragment by the total surface area of the peaks of both the methylated and unmethylated fragment. For an effective application of EpiTYPER, a streamlined process of assay design, assay validation, bisulfite conversion, data generation, and data processing is necessary. These steps involve switching between lab and computer work. We will provide a step-wise description of all these steps and also include various tips. These steps are an addition to the protocol provided for EpiTYPER by Agena Biosciences.
Materials and Equipment Prerequisites Agena Bioscience Inc. provides several automated pipelines for the measurement of nucleotides (SNPs, gene-expression etc.) on R system. If a MassARRAY system is already the MassARRAY available EpiTYPER only requires an additional proprietary software suite, and some additional fine-tuning of the MALDITOF mass spectrometer by a specialized service engineer to function. If a MassARRAY system is not yet available EpiTYPER will require a significant investment in hardware, including a compatible provided MALDI-TOF mass spectrometer, an automated liquid handling system to transfer samples from 384
FIGURE 1 | Biochemical steps and methylation quantification with EpiTYPER® . EpiTYPER® resolves on re-sequencing DNA on mass. After bisulfite conversion DNA is amplified by PCR and the resulting PCR product is transcribed from the reverse strand of the PCR product. This single stranded product is cleaved after each T resulting in fragments of known mass. Fragments with a methylated cytosine are 16 Dalton heavier than fragments with a non-methylated cytosine, the size of the two peaks can be used to calculate the methylation ratio of the CpG dinucleotide. It is easy to envision that fragments can arise with the same mass or with a mass extremely close to that of another fragment. Such circumstances limit the detection of certain CpG dinucleotides.
Frontiers in Genetics | www.frontiersin.org
2
September 2015 | Volume 6 | Article 287
Quantitative DNA methylation EpiTYPER® measurements
Suchiman et al.
to download and use for non-commercial purposes, have good manuals and a large user base.
plates to the SpectroCHIP II and a dedicated server to process and store the data generated.
1. Install a recent version of R using the CRAN website: http:// cran.r-project.org/. 2. Start the latest version of R as administrator (in Microsoft Windows: right click on R in start menu or desktop icon and select “run as administrator”) and run the following lines in R: source (“http://bioconductor.org/biocLite.R”) biocLite(“MassArray”) install.packages(c(“reshape”,”ggplot2”,”gplots”, “devtools”)) Select a CRAN repository near to your location, install packages. Of note: R may prompt you to update certain packages. This is often not required for MassArray to work properly, but is advisable to perform. 3. Next, download the files with our custom scripts from Github: https://git.lumc.nl/molepi/EpiTyper.
Consumables Bisulfite Conversion 1. EZ-96 DNA methylation kit, Shallow-Well Format (ZYMO Research) or for less samples the EZ DNA methylation kit (ZYMO Research). For a large number of samples we advise to use the 96-well format to reduce the number of batches in the experiment. 2. Tris base (ROCHE). 3. Ethanol absolute (molecular biology grade).
EpiTYPER 4. Ethylenediaminetetraacetic acid disodium salt dihydrate (Sigma-Aldrich). 5. Thermo-Fast 384 PCR Plates (Westburg), or plastics appropriate for your PCR set-up. R II Array and Clean Resin Kit (Agena 6. SpectroCHIP Bioscience Inc). 7. MassCLEAVE , T Cleavage Kit (Agena Bioscience Inc). 8. Hotstar taq DNA polymerase (Qiagen, including buffer). 9. dNTP mix, PCR grade (Qiagen; 10 mM of each nucleotide).
Procedures
™
Amplicon Design Whether EpiTYPER is suitable for a study depends on the number of regions and samples you wish to measure. One experimental run entails 384 reactions resulting in 126 measurements in triplicate with additional genomic DNA (gDNA) and water control measurements. An EpiTYPER PCR amplicon ranges from 100 to 600 bp, but is typically between 250 and 450 bp. For tips on how to select a region to measure, see Note 1. After selecting a region of interest, the reference sequence is required as input for assay design software. The sequence of the region of interest can be obtained from various databases. The sequence should be annotated for deviations from the reference sequence (e.g., Single Nucleotide Polymorphisms (SNPs)) that may affect the measurement. If a specific strain of a (model) organism is used, Sanger sequencing of the region of interest can be used to identify deviations from the reference sequence. The steps outlined below are based on the human genome.
Solutions to Prepare 1. 1M Tris-HCl pH7.5 (1L): add 141.1 g Tris base to 800 ml ddH20, adjust pH by adding approximately 60 ml of HCl and sterilize. 2. 5.0 mM Tris pH7.5 (1L): 5 ml 1M Tris-HCl pH7.5 (or pH8.0 depending on the subsequent step), add ddH2O to 1L and sterilize. 3. 0.5M EDTA pH8.0 (1L): add 186.1 g Ethylenediaminetetraacetic acid disodium salt dihydrate to 800 ml of ddH20. Since this will solve difficult the use of a magnetic stirrer is advised. Adjust the pH to 8.0 by adding NaOH pellets, as soon as the pH of the solution nears 8.0, the salts will slowly go into solution. 4. TE−4 (1L): add 10 ml 1M Tris-HCl pH8.0 to 200 µl EDTA 0.5M pH8.0, to make final concentrations of resp. 10 and 0.1 mM, add ddH2O to 1L and sterilize. 5. Make an 80% ethanol Tris-based buffer by adding 20 ml sterilized 5.0 mM Tris pH 7.5 to 80 ml 100% ethanol. Please note: and < respectively. Run in R: Name_of_amplicon