Bias in the Flesh: Attack Ads in the 2008 Presidential Campaign ... tematically employ cues associated with negative implicit attitudes in attack ads has not been.
Bias in the Flesh: Attack Ads in the 2008 Presidential Campaign
0.7
0.7
Images of McCain (Color)
0.5 0.4 0.3 0.2 Value (V) P = 0.007
Saturation (S) P=0
●
●
●
●
0.4
●
●
●
●
●
●
●● ● ●● ● ●
● ● ●● ● ●
●
● ● ● ●
●
●
●
● ●
●
● ●
●
●
● ●
● ● ● ● ●
● ●● ●
● ●
●
● ● ● ● ● ● ● ● ● ● ● ●
● ● ●
● ●
●
● ●
●
● ●
●
●
● ● ●
●
● ●
● ●●
●
●
● ●
● ● ●
●
● ●
●●
●
●
●
●
●
● ●
●
● ●● ● ●
15Oct2008
9Mar2008
17Jun2008
25Sep2008
3Jan2009
27Jul2008
● ● ● ●
●
● ●
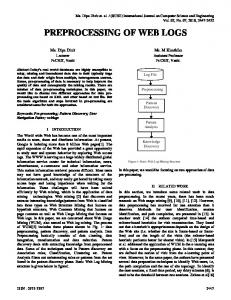
Figure 2: Data Pre-Processing
Children P = 0.014
Sinister Music P = 0.338
Buttondown P = 0.448
Figure 4: HSV Saturation (S) for McCain’s Skin Tone in Obama Ads
●
●
●
9Mar2008
● ● ● ●
● ● ● ● ● ●● ●
●
●
15Oct2008
●
●
● ● ●
● ● ●● ● ● ●● ● ● ●● ● ●● ●
●
● ● ● ● ● ● ● ● ●● ● ● ● ●●
●
●
●
●
●
●
17Jun2008
25Sep2008
●
●
● ●
●
● ●
● ●
●
● ●
●
●
●
●● ● ● ● ● ● ● ●● ●
● ● ● ● ● ●
● ● ● ● ● ● ●
● ●
●
3Jan2009
●
● ●
●● ●
● ● ●
● ● ●● ● ● ● ● ● ● ● ● ● ● ● ●● ● ● ● ●● ● ● ● ● ● ● ● ●● ● ● ●
●
● ● ●
● ●
●
● ●
●
● ●
●
● ●
●
● ●
●
●
●
● ●
●● ●
● ●
●
●
0.2
●
0.2 25Sep2008
4Nov2008
0.0 9Mar2008
17Jun2008
●
●
● ●
● ●
0.0 16Aug2008
●
0.8
●●
●
● ● ●
1.0
1.0 0.8
● ●
● ● ● ● ● ● ● ● ● ● ●● ● ●● ● ● ● ● ● ● ● ● ● ● ● ● ●● ● ● ● ● ● ● ● ● ●
25Sep2008
3Jan2009
●
● ● ● ●
●
● ●
16Aug2008
● ●
● ● ●●
●
●
●
● ● ● ●
● ● ●
● ●
●
●
● ●
● ● ●
● ● ●
● ● ●● ●
● ● ● ● ● ● ● ● ● ● ●
●
●● ● ●● ● ●
● ●●
●
●● ● ● ● ●
●
●
● ● ●
● ●
● ● ● ● ● ●
9Mar2008
●
● ● ● ● ● ●
● ● ●
● ●
17Jun2008
●
●●
● ● ● ●● ●● ● ● ● ●● ●
●
●
4Nov2008
● ● ● ●
●
● ●
●
●
●
● ●●
● ●
●
25Sep2008
● ●
● ● ●● ●
●
● ●● ●
●
●
●
●
●
●
●
0.6
● ●●
●
mean, P = 0.039 20% quantile, P = 0.047 10% quantile, P = 0.353
0.4
●●
●●
●● ●
●
0.2
●
●
● ● ●
●
●
0.2
Smile P = 0.833
● ●● ●
●
0.0
●●
●
● ●
● ●
●
0.0
0.0 0.3 0.0
0.1
0.2
Mean HSV Saturation (S)
0.4
Appears with Does not
0.4 0.3 0.2 0.1
Calculate RGB readings for every pixel using EBImage for R
0.0
Delineate facial pixels in R using coordinates
Mean HSV Saturation (S) of Least Saturated Image
Present Not Present
Database
Define facial Coordinates with Bio7
0.5
Appearance and McCain's Skin Tone in Obama Ads
0.5
Content and McCain's Skin Tone in Obama Ads
● ● ● ●
●
● ●● ●
HSV Saturation (S)
●
● ●
●●
0.6
1.0 ●
● ●
●
●
0.0
Measurement: Pre-processing
●●●
●
●
●
We borrow image analysis data reduction techniques from biology and computer science to extract S and V metrics. By utilizing open-source software packages including Bio7, R, ImageJ, and EBImage, we set up an interface that allows analysts to simply select part of an image and send the coordinates of the selection to a database for further analysis. For our study, analysts drew a polygon around each candidate’s face in each still (figure 2). We then calculated red-green-blue (RGB) metrics for each pixel.
●
● ●
● ●
● ● ●●
●
Images from Obama Ads Showing Obama
● ●
Figure 1: Data Pre-Processing
● ●
● ●
● ● ●●
●
●
mean, P = 0.138 20% quantile, P = 0.239 10% quantile, P = 0.036
0.4
● ● ●
●
●
●
●
HSV Saturation (S)
●
● ● ● ● ● ● ● ● ●● ●● ● ●● ● ● ● ● ● ● ● ● ●● ● ●●
● ●
● ●
● ●
0.8
● ●
0.6
0.6
●● ●
0.4
HSV Brightness (V)
●
● ●
● ● ●
●
● ●
● ● ● ●
●
mean, P = 0.134 20% quantile, P = 0.255 10% quantile, P = 0.473
● ● ● ●
●
HSV Brightness (V)
0.8
●
0.4
1.0
0.5 0.4
●
●
●
●
●
● ● ●
●
● ● ● ●● ●●
●
Likewise, there is some evidence that low facial color saturation could be part of a message that plays on widely held implicit attitudes about age. We suspect that people associate colorful images with youth and health—take the word “ruddy,” which refers both to a reddish complexion and a healthy appearance. In Obama campaign ads that include images of children, the image with the lowest saturation reading for McCain’s skin tone is significantly less vibrant than the least saturated image in other ads. It is possible that including children in the ad serves to contrast their youth with his age. Indeed, among these are the ads in which the Obama campaign claimed that McCain is “unable to use a computer,” has a tendency to “talk about the 60s,” and is generally “out of touch.” However, we did not find statistically significant relationships between color saturation and other variables related to content and appearance.
●
● ● ● ●
Images from Obama Ads Showing McCain Images from Obama Ads Showing Obama
mean, P = 0.776● 20% quantile, P = 0.909 10% quantile, P = 0.578
●
Figure 3: HSV Brightness (V) from Obama’s Skin Tone in McCain Ads
●
● ●
● ● ●
● ●
●
●
●
●
● ● ●
● ●
●
● ●
●
● ●
●
● ● ●
●
● ●●●● ●
Although the Obama campaign’s images of McCain do not appear to grow significantly less saturated as election day approached, the Obama campaign’s own images of Obama grew increasingly saturated (figure 7).
●
Buttondown Shirt P = 0.108
●● ●
● ●
●
●●
●
Figure 6: Key longitudinal relationship in McCain ads
●
Smile P = 0.07
●
●
●
●
● ● ●
● ●
●● ● ● ●● ●
● ●● ●
5Sep2008
●
Performance Attacked P = 0.06
●
●
●
●
Sinister Music P = 0.059
●
0.0
0.0
0.0
● ●
● ●
●
5Sep2008
●
●
● ●
27Jul2008
● ●
● ●
●
● ● ●●●
● ●
0.2
0.2
●
●
●
● ● ●
●
● ●
●
●
●
●
0.3
●
●
●
●●
0.2
●
●
● ●
● ●
●
● ● ●
●
●
● ●
●● ●
● ●
●
●
● ●
●
●
0.8
0.8
● ●
●
●
●
● ●
●
●
●
●
●
●
● ● ● ● ● ●
● ●
● ●
1.0
1.0
● ●
● ●
●
●
●● ● ● ● ● ●● ● ●●● ●● ● ● ● ● ● ● ● ●● ●● ● ●●● ● ● ● ● ● ● ●● ● ● ●● ● ● ●● ● ●● ● ● ● ●
0.6
●
●●
●
●
●
●
●● ●
●●
●● ●
● ●
● ●
● ●
● ●
●
● ● ●
●
●
0.4
● ●
● ● ●●
●
●● ●
0.2
0.6
●● ●● ● ●
● ● ●
● ●
0.6
●
● ●● ● ● ● ● ● ● ●● ● ●
●
● ● ● ●
●
0.0
● ●
●
●
Mean, P < 0.001 20% quantile, P < 0.001 10% quantile, P < 0.001
●●●● ●
●
●
McCain Images Showing McCain
HSV Saturation (S)
● ●
●
● ●
0.6
●
●
Criminal Association P = 0.034
V*S P=0
Mean, P = 0.526 20% quantile, P = 0.869 5% quantile, P < 0.001
● ● ● ● ●
●
●● ● ●
●
HSV Brightness (V)
0.8
● ●
●
● ●
0.8
● ●
Mean, P = 0.049 20% quantile, P = 0.020 ● ● 10% quantile, P = 0.155●
0.4
Mean, P = 0.639 20% quantile, P = 0.031 10% quantile, P = 0.072
Images from Obama Ads Showing McCain
0.1
Saturation (S) P=0
McCain Images Showing Obama
HSV Saturation (S)
1.0
McCain Images Showing McCain
0.4
1.0
McCain Images Showing Obama
0.2
0.7
Appears with Does not 0.6
Content Present Content Absent
Value (V) P = 0.987
However, as the election approached and the campaigns “went negative,” the McCain campaign’s darkest and least saturated images of Obama grew darker and less saturated, while the campaign’s own images of McCain grew brighter and more saturated (figure 6).
Additionally, Obama’s skin tone appears darker in images from McCain campaign ads that depict him without a smile and in casual attire (lacking a button-down shirt) (figure 3). We suspect that the presence of a smile diminishes implicit affective bias and that formal attire diminishes the salience of Black stereotypes related to ostentatious and/or gang-affiliated clothing. Appearance and Obama's Skin Tone in McCain Ads
V*S P = 0.036
Figure 5: HSV Readings of Each Candidate by Campaign
●
Content and Obama's Skin Tone in McCain Ads
0.0
0.1 0.0
0.1
0.2
0.3
0.4
HSV Readings
HSV Readings
0.5
0.6
McCain Campaign Obama Campaign
0.6
Obama Campaign McCain Campaign
HSV Brightness (V)
We found several key relationships in the direction that would be expected if candidates used cues that play on widely held implicit attitudes about race and age in attack ads. We expected that in ads that associate Obama with crime, we might see darker or darkened images of Obama. Research has shown that Americans associate Blacks with a fear of crime (Gilliam et al. 1996). Indeed, for McCain ads that associated Obama with alleged criminal activity (such as crimes the McCain campaign associated with William Ayers and ACORN), the darkest image of Obama in the ad is significantly darker than the darkest images in other ads (figure 3). We found a similar pattern in ads that featured music that analysts determined to be sinister and in ads that attacked Obama’s past performance (figure 3). We focus on the darkest images of Obama and the least saturated images of McCain based on the assumption that the most bias-consistent images are those most likely to make implicit attitudes salient, and thus the images at the low end of the V and S spectrums can be expected to have an inordinate impact.
Mean HSV Brightness (V)
The two aesthetic skin properties of interest—darkness and color vibrance—basically correspond to the value (brightness) and color saturation measures provided in the HSV colorspace (figure 1). Moving along the grayscale ramp from the far bottom corner of the color space to the near top corner corresponds to value (brightness). Coordinates located further away from the grayscale ramp are more saturated with color.
Images of Obama (Color)
Results
0.7
To select ads for our study we drew on the 2008 McCain versus Obama Campaign Archive, created by the Political Communication Lab at Stanford. This archive consists of over 700 ads downloaded from candidate websites, YouTube channels, the press, and third party websites to construct the 2008 McCain versus Obama Campaign Archive. This study focuses on the 126 ads authored directly by the McCain and Obama campaigns, released from late July through election day in November. We analyze only the still images that appeared in the ads—each time an advertisement showed a still image of Obama or McCain, that still image was captured (N = 781).
We see additional differences between facial skin tones depending on which campaign produced each ad (figure 5). It is clear that each campaign used images of their opponents that are less saturated than their own campaign’s images. Interestingly, it appears that the McCain campaign did not use systematically darker images of Obama than did the Obama campaign—in fact the McCain campaign used significantly brighter images of Obama.
Each advertisement’s content was also coded by human analysts. Analysts coded the type of ad, issue area, and aural and visual elements within each ad. Analysts also coded candidate facial expressions in each still.
0.6
Data and Methods
V − min(R, G, B) S= V
Stanford University
Once the HSV metrics for the facial pixels in each image were calculated, we used the R package “maps” to return the exact pixels in each image that fell within the candidate’s face-polygon (figure 2). We then took the mean S and V measures for these facial pixels.
0.5
We devised a method to quantitatively assess the extent to which the 2008 McCain and Obama campaigns depicted their opponents in ways that can play on the public’s implicit attitudes about race in the case of Obama and age in the case of McCain. Research has shown that darkening skin-tones makes negative racial attitudes more salient (Maddox and Gray 2002). Similarly, we theorized that lowering color saturation in skin tones can be expected to make negative attitudes about age more prominent. Thus, we collected ads from each campaign and quantitatively assessed the relationship between skin tone and content. This allows us to examine the extent to which each campaign used cues associated with negative implicit attitudes in attack ads. (We do not speculate about whether either campaign purposefully tried to make salient negative implicit attitudes about their opponent—it is possible that the use of images with such cues was unconcious and/or accidental.)
V = max(R, G, B) ;
0.4
In a typical election, campaigns deliver many controversial ads to the public. Some contain cues that play on implicit attitudes—automatic associations of attributes with people who belong to a particular group. Ads that link a candidate to negative implicit attitudes can affect the way people vote (Valentino et al. 2002). Although it is clear that politicians alter images of their opponents to make them look “bad” (Jamieson 1992), the extent to which today’s political campaigns systematically employ cues associated with negative implicit attitudes in attack ads has not been documented.
and Electrical
2 Engineering ,
In order to produce data that provided information about skin tone darkness and color vibrance, V and S metrics were extracted from the RGB readings via this conversion:
0.3
Introduction
Departments of
1 Communication
0.2
Maria
2 Jabon
0.1
Ethan
1 Plaut ,
Mean HSV Brightness (V) of Darkest Images
Solomon
1 Messing ,
● ●
●
●
● ● ● ● ● ● ● ● ●
25Sep2008
3Jan2009
Figure 7: Key longitudinal relationships in Obama Ads
Conclusions This analysis provides evidence that in attack ads, the 2008 presidential campaigns selected or altered images in ways that play on the public’s implicit attitudes. The relationship between Obama’s facial skin tone darkness and attempts to tie Obama to crime in the McCain campaign’s ads provides the strongest evidence. Additionally, the McCain campaign used darker images of Obama as election day approached and the campaign “went negative.” Indeed, we see anecdotal evidence suggesting that the McCain campaign’s most vitriolic ads—including attempts to tie Barack Obama to domestic terrorist Bill Ayers and allegations of misconduct related to the ACORN organization—contain the darkest images of Obama and were relased after the midpoint of the presidential campaign. The evidence is not as clear for the Obama campaign, however. There is a relationship between McCain’s facial color saturation and the presence of images of children in Obama’s ads, which could be interpreted as a play on implicit attitudes about age. Yet, there are no other significant relationships between facial color saturation, candidate appearance, and ad content. Furthermore, depictions of McCain did not grow less colorful as election day approached. An anecdotal examination reveals one common thread in Obama’s least saturated images of McCain—attempts to paint McCain as confused and out of touch—but this strategy is common in political campaigns (Fiorina 1989) and we cannot draw any meaningful conclusions without further analysis. Nonetheless, it appears that—intentionally or not—when producing attack ads, some campaigns select or alter images in ways that play on the public’s implicit attitudes.