IEEE GEOSCIENCE AND REMOTE SENSING LETTERS, VOL. 15, NO. 3, MARCH 2018
325
Design of a Configurable Monitoring Station for Scintillations by Means of a GNSS Software Radio Receiver Calogero Cristodaro, Fabio Dovis, Nicola Linty , and Rodrigo Romero Abstract— This letter addresses the design and implementation of a monitoring station for Global Navigation Satellite Systems signals based on the software-defined radio paradigm. The monitoring platform exploits a digital data grabber based on the use of Universal Software Radio Peripheral devices and a satellite navigation fully software receiver; with respect to a traditional commercial receiver, this implementation solution grants a higher level of flexibility for the processing strategy, enabling the possibility of a deeper analysis of the signals in case of meaningful events, such as ionospheric scintillations or radio frequency interference, through the storage of raw samples. Such an implementation approach yields valuable advantages in critical and remote areas, such as polar regions, where resources are limited and installation, maintenance, and replacement of hardware may be critical. Index Terms— Ionospheric scintillations, satellite navigation systems, software defined radio.
I. I NTRODUCTION N RECENT times, the increased use of Global Navigation Satellite System (GNSS) for a widespread of applications and services has clearly highlighted how one of the essential performance metrics to take into account is the reliability of the estimation of the user position. It is well known, in fact, that the signals that are currently broadcast for civil use by the GNSSs are not granted. For this reason, in parallel to the development of advanced algorithms and receiver architectures able to improve the accuracy and precision of the estimated position, a number of monitoring procedures able to assess the quality of the measurements are designed and developed. Autonomous integrity monitoring algorithms at the receiver level, such as the receiver autonomous integrity monitoring, have been designed since a long time [1]. These algorithms monitor the pseudorange quality to detect anomalies in the measurement and possibly exclude them from the positioning procedure. A different approach can be undertaken by observing the received signal itself and detecting and characterizing possible threats by means of signal processing techniques. However, received GNSS signals exhibit an extremely low
I
Manuscript received July 27, 2017; revised September 19, 2017 and November 15, 2017; accepted November 28, 2017. Date of publication January 30, 2018; date of current version February 23, 2018. This work was supported by the Italian Ministry of Education, Universities and Research. (Corresponding author: Nicola Linty.) The authors are with the Department of Electronics and Telecommunications, Politecnico di Torino, 10129 Turin, Italy (e-mail:
[email protected];
[email protected];
[email protected];
[email protected]). Color versions of one or more of the figures in this letter are available online at http://ieeexplore.ieee.org. Digital Object Identifier 10.1109/LGRS.2017.2778938
signal-to-noise ratio. Anomalies in the signal structure can be observed only exploiting high-gain antennas [2], which is often not practical, cost effective, and anywhere implementable. On the other hand, the use of software-defined radio (SDR) approach allows the development of low-cost sensors, which can be used to collect raw samples of the received signals, and tailored architectures of GNSS processors, in order to assess the presence of specific threats [3], [4]. Results of the monitoring can then be used either to raise reliability warnings to the users or for scientific purposes to develop error models of more general validity. As an example, the use of GNSS signals as probes for ionosphere monitoring has become quite popular, since such signals are available almost everywhere on the globe. The ionospheric tomography that can be obtained by their observation is often sufficient to avoid the installation of other large and expensive equipment, such as ionosondes [5]. For all the above-mentioned reasons, it is quite valuable to have the possibility to implement monitoring stations for GNSS signals at low cost and low complexity. In addition, in many cases, it is important to be able to record the event and to playback the scenario for deeper and refined analyses. Events may be rare and the analysis in real time might not provide sufficient information. For example, high latitudes scintillations do not appear on a regular basis, being related to the presence of solar storms. Furthermore, interesting events are usually monitored from stations located in areas not easily accessible and lacking of structured and robust infrastructures. However, it is also recognized that the possibility to work in the field, and to process the real signals looking at the real threats, is also extremely valuable to corroborate the theoretical results. Further benefits of recording raw data have been outlined in [6]–[8]. The innovative aspect of this letter resides in the faithful description of the SDR approach in the field of GNSS-based environmental and threats monitoring, along with the design and implementation of a real GNSS data acquisition station, presented as a case study. Its objective is to show how these monitoring stations can be a valid alternative to hardware receivers, granting the same functionality, the same performance level, while providing some added values. Section II presents the SDR approach as a valuable tool for the design of monitoring stations. Then, Section III gives a background on ionospheric scintillation. The design and the implementation of the monitoring stations are discussed in Section IV. The results, presented in Section V, confirm the validity of the SDR solutions proposed in this letter. In Section VI, the conclusions are provided.
This work is licensed under a Creative Commons Attribution 3.0 License. For more information, see http://creativecommons.org/licenses/by/3.0/
326
Fig. 1.
IEEE GEOSCIENCE AND REMOTE SENSING LETTERS, VOL. 15, NO. 3, MARCH 2018
Common architecture of an SDR-based GNSS data acquisition and processing system.
II. S OFTWARE -D EFINED R ADIO A PPROACH The traditional way in monitoring nuisances due to ionospheric propagation envisages the use of professional commercial hardware receivers, such as ionospheric scintillation monitoring receivers (ISMRs) [9]–[11]. Nonetheless, some recent works consider SDR as a valuable, competitive, and cost-effective alternative for the design of monitoring stations [3], [12]–[14]. SDR receivers are radio communication architectures, which are made up of configurable hardware and software blocks and performing advanced signal processing operations. Dedicated hardware components are realized in software on programmable platforms, such as highperformance general purpose processors [15]. With respect to commercial GNSS receivers, in which only the storage of postprocessed data is possible, SDR receivers allow to access intermediate and low-level signal processing stages; therefore, in monitoring devices, they offer to the user a larger subset of observables. This fact leads to higher flexibility and reconfigurability and, in turn, enables the possibility to design and implement innovative monitoring techniques and algorithm for mitigating the impact of signal nuisances. A. SDR Architecture The most common architecture of SDR-based data acquisition and monitoring system is composed of an antenna, a radio front end (RFE), and a software processing unit, as depicted in Fig. 1. The RFE is in charge of signal conditioning and data grabbing. It first amplifies and filters the analog signal coming from the antenna to minimize out-of-band contributions; then, it downconverts the radio frequency (RF) signal to intermediate frequency (IF) or to baseband in order to allow digital conversion. An automatic gain control can be used to automatically adjust the signal dynamics, though it is often not employed in the particular case of scintillation and interference monitoring. At this point, the signal, still in its analog form, is converted into digital samples, exploiting an analog-to-digital converter (ADC), and quantized. This stream of digital samples is commonly denoted as GNSS raw signal or raw IF signal, and has not to be confused with the I and Q postcorrelation samples, sometimes denoted as raw data. The raw signal is normally stored in memory as a binary file, for later postprocessing, or directly processed by a fully software receiver in real time. This last block is the actual stage of the receiver that is SDR implemented: all the baseband signal processing stages (e.g., acquisition, tracking, navigation solutions, and ionospheric indices computation) are
implemented in software, unlike in traditional hardware-based ISMR. The availability of raw IF data related to interesting events enables two key features: 1) the possibility to develop advanced, innovative, and ad hoc signal processing techniques, tailored to scintillation impact mitigation; 2) the possibility to the replay the original scenario, evaluating the performance of different receiver configurations and architectures, or even using different receivers. This approach is valuable if the core structures of the data collection system do not mask or modify the features of the collected signals, assuring that the information on scintillation is preserved. The SDR receiver, as well, has to grant the quality of the monitoring at least at the level of what is considered today state of the art. The case study later introduced will demonstrate that these two requirements can be matched, and how this fact is of value in critical environments such as the polar scenario, where compelling constraints are experienced. III. OVERVIEW ON I ONOSPHERIC S CINTILLATIONS As GNSS signals propagate through Earth’s upper atmosphere, they undergo severe propagation nuisances, such as phase shifts, group delays, and amplitude variations. Propagation of the GNSS signals through the ionosphere is indeed the most severe and variable cause of errors in GNSS positioning [10]. In fact, the upper atmosphere of the Earth, known as ionosphere, presents a region particularly rich of free electrons. In particular, the ionosphere at low and high latitudes is particularly prone to irregular electron density concentrations, due to geomagnetic storms and substorms occurring under disturbed heliogeophysical conditions, which induce rapid fluctuations in signal intensity (amplitude scintillation) and phase jittering (phase scintillation) [16]. This kind of nuisances cannot be empirically modeled and can have a serious impact on the receiver tracking performance, inducing cycle slips, phase errors, and increased carrier Doppler jitter. The receiver measurements can, thus, be heavily corrupted, resulting in positioning errors of tens of meters or, in the most severe cases, in complete outages due to loss of lock. Such a threat has a disruptive impact on submeter navigation and precise positioning, which are needed for several critical applications [17]–[19]. If, on one hand, the ionosphere is a threat for the GNSS signals, by converse GNSS received signals can be exploited to infer important information on the ionosphere behavior. A detailed knowledge of these effects is essential for modeling the ionosphere and predicting the short-term behavior without
CRISTODARO et al.: DESIGN OF A CONFIGURABLE MONITORING STATION FOR SCINTILLATIONS
327
digital samples and to run the software receiver for postprocessing the GNSS signals; 9) storage devices, such as external hard drives, to store the raw IF data. This modular approach makes the front end extremely versatile and flexible in terms of configuration. B. Bottleneck of Data Storage The storage of raw IF samples is not an easy task, since it requires large storage capabilities, which are either not available or difficult to be deployed. As an example, 30 min of double frequency raw data amount to
Fig. 2.
GNSS raw IF data monitoring station architecture.
using ad hoc installed infrastructures, as well as for designing new generations of robust GNSS receivers. GNSS receivers are able to measure the amount of scintillation affecting a satellite signal in both amplitude and phase by making use of 50-Hz rate data from the tracking processing blocks. Two indices, computed over an observation interval of 1 min, are employed for this end. Amplitude scintillation is monitored by computing the S4 index, which is the standard deviation of the received power as computed from the prompt correlator samples normalized by its mean value. Phase scintillation monitoring is achieved by computing the σφ index, which is the standard deviation of the detrended carrier-phase measurements. GNSS raw data acquisition systems and software receivers have been successfully used for monitoring ionosphere in equatorial regions since few years [3], [20], [21]. IV. M ONITORING S TATION D ESIGN AND I MPLEMENTATION A. Monitoring Station Architecture The GNSS double frequency raw IF data acquisition system, developed for scintillation monitoring in this letter, is reported in Fig. 2. It consists of the following equipment: 1) a GNSS antenna used to capture the GNSS signal; 2) an RF power splitter used to distribute the signal to different devices (RFE and ISMR, used as a benchmark); 3) a low-noise amplifier; 4) a second RF splitter used to separate the received signal into the L1 and the L2 branches; 5) a bit grabber, made up of two Universal Software Radio Peripheral (USRP) N210 devices, for acquiring L1 and L2 bandwidths, respectively [3], [22]; 6) a rubidium atomic clock, providing a very accurate and stable reference to the ADC within both USRPs, which is required for reliable phase scintillation measurements; 7) a multiple input multiple output cable used to provide synchronization between the data stream of the two USRPs and to propagate the atomic clock reference; 8) an external processing unit, such as a personal computer, used both to manage the storing of the GNSS raw
S = f s · Nbands · Ns · Q · T = (5 · 106 ) · 2 · 2 · (16/8) · 1800 = 72 GB
(1)
where f s is the sampling frequency of the ADC, in samples per second, and in this case, it is equal to 5 Msamples/s; Nbands is the number of frequency bands considered, and in this case, it is equal to 2 (L1 and L2); Ns is the number of samples per instant, and in this case, it is equal to 2 (I and Q sampling); Q is the number of quantization levels, or bit resolution, i.e., of the number of bits necessary for the representation of the digital signal, in bits per sample, and in this case, it is equal to 16 bits/s, or 16/8 = 2 bytes/s; and T is the total time considered, and in this case, it is equal to 30 min (1800 s). C. Quantization Tradeoff It can be proved that the assessment of the scintillation indices does not require a large number of quantization bits. Raw GNSS data affected by strong scintillation, collected in Presidente Prudente, Brasil, on March 25, 2015, between 20:55 and 22:00 local time (postsunset) are considered. The original data collection system was configured to store the signal with a 16-bit resolution. Afterward, the original signal has been downconverted, respectively, to 8, 4, 2, and 1 bit exploiting a software routine, and postprocessed using the same software receiver. The plot in Fig. 3 shows the S4 and σφ indices of global positioning system (GPS) pseudorandom noise (PRN) 1, as computed by the software receiver on the raw data. Fig. 3 clearly shows how, decreasing the number of quantization bits, the loss with respect to the reference case (16 bits) is negligible. In the case of S4 , even just using a single quantization bit, the difference is less than 0.1; in this case, the noise level is slightly increased. In the case of σφ , the curves coincide. Thus, looking at this result, it seems straightforward to choose a 1-bit quantization level for SDR monitoring stations in order to save in storage mass. However, the limitation of such an extreme choice is that most of the information is lost during the nonlinear quantization process. One of the main advantages of storing the raw samples is indeed the possibility to replay the event. A strong limitation of the number of quantization levels may reduce the fidelity of the replayed scenario, sometimes introducing artifacts in the results. The data collected can be, of course, postprocessed, but there is no much room for the application of advanced signal processing algorithms that either could highlight a less global information
328
IEEE GEOSCIENCE AND REMOTE SENSING LETTERS, VOL. 15, NO. 3, MARCH 2018
TABLE I L OCATION OF THE M ONITORING S TATIONS
Fig. 3. Comparison of the value of the scintillation indices for different quantization levels.
such as the S4 is (averaged over long time windows) or could make the data usable to replay realistic scenarios. Similar considerations can be drawn concerning the bandwidth and the sampling frequency. Although no relevant degradation on the computation of the scintillation indices is experienced, the possibility of using higher sampling frequencies improves the fidelity of the recorded signal to the physical one. D. Bottleneck of Data Transfer A second problem is related to the data transfer. The bandwidth resources available in any remote research station do not allow transferring such amounts of data. The data can only be moved physically transferring the hard drives on which they are stored. The raw GNSS data will be then available for postprocessing only at the end of the campaign, when the system will be disassembled and the hard drives physically shipped back, or taking advantage of material that can be transferred along the year from the stations. Nevertheless, by exploiting a slow remote network connection, it will be possible to run the software receiver on selected raw data directly on the computer of the monitoring station, and then to transfer only the results in a compact format, which can cope with the limited bandwidth available [23]. V. R ESULTS This section reports the results obtained by exploiting the SDR technology described in this letter. GNSS raw IF data affected by scintillation events have been postprocessed by means of software receiver to compute the scintillation indices. Data have been collected in the frame of two different projects: MImOSA2 (Monitoring Ionosphere Over South America to support high precision applications) from March 23 to March 27, 2015, at Presidente Prudente (Brasil) [21] and DemoGRAPE throughout 2016, in the Antarctic stations SANAE IV (South Africa) [24]. Table I reports the station’s coordinates. Figs. 4 and 5 report the results of the SDR-based receiver, plotted using a continuous line, for different PRNs and for
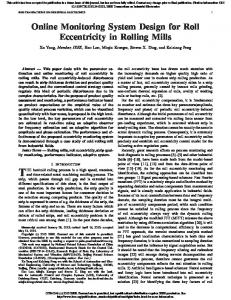
Fig. 4. Amplitude scintillation index, March 26, 2015—USRP (continuous line) versus Septentrio (dashed line) at Presidente Prudente.
different constellations (GPS, Galileo). For the sake of comparison, also the results obtained from a Septentrio PolaRxS ISMR, considered as a benchmark, are reported, using a dashed line. The scintillation indices are computed at a 1-min interval; the cutoff frequency of the carrier-phase detrending filter is 0.1 Hz and C/N0 correction is applied when computing the S4 index. No elevation angle masking is applied at this stage. The good match between the curves of the SDR and the hardware receivers is a confirmation of the validity of the software approach in monitoring ionosphere. More in detail, Fig. 4 depicts the S4 scintillation index for a chunk of data collected at Presidente Prudente, at postsunset, 21.00 local time. The curves of three GPS satellites are reported (PRNs 1, 3, and 23). The plot shows that moderate (0.4 ≤ S4 < 0.7) and strong (S4 ≥ 0.7) scintillations affect all signals at different instants. While PRN 23 is affected by amplitude scintillation for the whole data collection, relevant effects can be observed for PRNs 1 and 3 starting at 21:14 and 21:35, respectively. Fig. 5 reports the phase scintillation index for a chunk of data collected at SANAE IV. In this case, Galileo satellites are reported to prove the multiconstellation capabilities of the SDR approach. In particular, the curves of the two different implementations match well in the presence of scintillation, while they differ slightly when no scintillation activity is present. This mismatch is due to the different quality of the local oscillators employed in the two receivers, and it is not relevant for scintillation-related studies. Analog results for different signals, bandwidths, and constellations can be obtained by exploiting the same architecture and by changing the grabber and receiver configurations. In [24] and [25], the scintillation activities have been monitored by processing GPS signals, such as L1, L2C, and L5, and Galileo signals, such as E1bc and E5a.
CRISTODARO et al.: DESIGN OF A CONFIGURABLE MONITORING STATION FOR SCINTILLATIONS
Fig. 5. Phase scintillation index, January 20, 2016—USRP (continuous line) versus Septentrio (dashed line) at the SANAE IV station.
VI. C ONCLUSION This letter described the design and implementation of a monitoring station for satellite navigation signals based on the SDR technology as an alternative to commercial hardware receivers. Generally speaking, the main advantage is indeed the high level of configurability and modularity of the grabbing and postprocessing phases, which makes SDR-based systems flexible and tailored to the specific monitoring task. In addition, the availability of raw IF data enables deeper and refined analyses of the GNSS signal and the event under monitoring. Concerning the particular case of ionospheric scintillation, it has been proven that SDR implementation grants the same functionality and performance level of traditional equipment while offering several advantages. First, the user can configure the parameters of the system and modify or replace the processing algorithms, thus adapting the monitoring installation to the requirements and resources available. The availability of raw IF samples allows the replay of particular scintillation events at the RF and to test the performance of different hardware receivers on the original scenario. At the same time, IF data can be postprocessed by means of customized software receivers (e.g., higher order loops and innovative tracking architectures, including those yet to be developed). Finally, it represents a cost-effective solution. ACKNOWLEDGMENT The authors would like to thank P. Cilliers (on behalf of SANSA), J. Fortuny-Guasch (on behalf of the EC JRC), and L. Alfonsi (on behalf of INGV) for thoroughly supporting the work performed. The data used in this letter were collected in the framework of the DemoGRAPE Project through the Italian National Research Programme for Antarctica under Contract 2013/C3.01 and the MImOSA2 Project through the ESA ALCANTARA Initiative under Contract 4000112418/14/F/MOS. R EFERENCES [1] R. G. Brown, “A baseline GPS RAIM scheme and note on the equivalence of three RAIM methods,” Navigation, vol. 39, no. 3, pp. 301–316, 1992. [2] M. Pini and D. M. Akos, “Exploiting GNSS signal structure to enhance observability,” IEEE Trans. Aerosp. Electron. Syst., vol. 43, no. 4, pp. 1553–1566, Oct. 2007.
329
[3] S. Peng and Y. Morton, “A USRP2-based reconfigurable multiconstellation multi-frequency GNSS software receiver front end,” GPS Solutions, vol. 17, no. 1, pp. 89–102, 2013. [4] J. T. Curran, M. Bavaro, A. Morrison, and J. Fortuny, “Developing a multi-frequency for GNSS-based scintillation monitoring receiver,” in Proc. (ION GNSS+), Tampa, FL, USA, Sep. 2014, pp. 1142–1152. [5] P. Yin et al., “Imaging of the Antarctic ionosphere: Experimental results,” J. Atmos. Solar-Terrestrial Phys., vol. 71, nos. 17–18, pp. 1757–1765, 2009. [6] G. Lachapelle and A. Broumandan, “Benefits of GNSS IF data recording,” in Proc. Eur. Navigat. Conf. (ENC), 2016, pp. 1–6. [7] N. Linty, R. Romero, F. Dovis, and L. Alfonsi, “Benefits of GNSS software receivers for ionospheric monitoring at high latitudes,” in Proc. 1st URSI Atlantic Radio Sci. Conf. (URSI AT-RASC), Gran Canaria, Spain, May 2015, pp. 1–6. [8] N. Linty, F. Dovis, R. Romero, C. Cristodaro, L. Alfonsi, and E. Correia, “Monitoring ionosphere over Antarctica by means of a GNSS signal acquisition system and a software radio receiver,” in Proc. Int. Tech. Meeting Inst. Navigat., Monterey, CA, USA, Jan. 2016, pp. 549–555. [9] A. J. Van Dierendonck, J. Klobuchar, and Q. Hua, “Ionospheric scintillation monitoring using commercial single frequency C/A code receivers,” in Proc. ION GPS, 1993, pp. 1333–1342. [10] S. Shanmugam, J. Jones, A. MacAulay, and A. J. Van Dierendonck, “Evolution to modernized GNSS ionoshperic scintillation and TEC monitoring,” in Proc. IEEE/ION PLANS, Apr. 2012, pp. 265–273. [11] V. Romano, G. Macelloni, L. Spogli, M. Brogioni, G. Marinaro, and C. N. Mitchell, “Measuring GNSS ionospheric total electron content at Concordia, and application to L-band radiometers,” Ann. Geophys., vol. 56, no. 2, pp. 1–10, 2013. [Online]. Available: http://www. earth-prints.org/bitstream/2122/8734/1/2013_Romano_et_al_AG_TEC_ Concordia.pdf [12] B. Motella, S. Savasta, D. Margaria, and F. Dovis, “Method for assessing the interference impact on GNSS receivers,” IEEE Trans. Aerosp. Electron. Syst., vol. 47, no. 2, pp. 1416–1432, Apr. 2011. [13] S. Skone, G. Lachapelle, D. Yao, W. Yu, and R. Watson, “Investigating the impact of ionospheric scintillation using a GPS software receiver,” in Proc. ION GNSS, Long Beach, CA, USA, 2005, pp. 1126–1137. [14] S. Ganguly et al., “Ionospheric scintillation monitoring and mitigation using a software GPS receiver,” Radio Sci., vol. 39, no. 1, 2004. [15] L. Lo Presti, E. Falletti, M. Nicola, and M. Troglia Gamba, “Software defined radio technology for GNSS receivers,” in Proc. IEEE Metrol. Aerosp. (MetroAeroSpace), May 2014, pp. 314–319. [16] G. De Franceschi et al., “Dynamics of high-latitude patches and associated small-scale irregularities during the October and November 2003 storms,” J. Atmos. Solar-Terrestrial Phys., vol. 70, no. 6, pp. 879–888, 2008. [17] K. de Jong, M. Goode, X. Liu, and M. Stone, “Precise GNSS positioning in Arctic regions,” in Proc. Offshore Technol. Conf., 2014, p. 10. [18] “The effect of space weather phenomena on precise GNSS applications,” Fugro Satellite Positioning, Eight Mile Plains, QLD, Australia, White Paper A12321850TCBRC1, Dec. 2014. [Online]. Available: https:// fsp.support/library/12321850_C1_Space_Weather_Phenomena_Precise_ GNSS_Applications.pdf [19] Y. Xu, Y. Yang, and G. Xu, Precise Determination of GNSS Trajectory in the Antarctic Airborne Kinematic Positioning. Berlin, Germany: Springer, 2012, pp. 95–105. [20] G. Povero et al., “Ionosphere monitoring in South East Asia in the ERICA study,” Navigation, vol. 64, no. 2, pp. 273–287, 2017. [21] C. Cesaroni et al., “Monitoring ionosphere over South America: The MImOSA and MImOSA2 projects,” in Proc. Int. Assoc. Inst. Navigat. World Congr. (IAIN), Prague, Czech Republic, Oct. 2015, pp. 1–7. [22] Ettus Research. (May 2017). USRP N210 Software Defined Radio (SDR)—Ettus Research. [Online]. Available: https://www.ettus. com/product/details/UN210-KIT [23] A. Favenza, N. Linty, and F. Dovis, “Exploiting standardized metadata for GNSS SDR remote processing: A case study,” in Proc. 29th Int. Tech. Meeting Satellite Divis. Inst. Navigat. (ION GNSS), vol. 1. Piscataway, NJ, USA, Sep. 2016, pp. 77–85. [24] L. Alfonsi et al., “First observations of GNSS ionospheric scintillations from DemoGRAPE project,” Space Weather, vol. 14, no. 10, pp. 704–709, 2016. [25] R. Romero, N. Linty, C. Cristodaro, F. Dovis, and L. Alfonsi, “On the use and performance of new Galileo signals for ionospheric scintillation monitoring over Antarctica,” in Proc. Int. Tech. Meeting Inst. Navigat., Manassas, VA, USA, 2017, pp. 989–997.