33rd Annual International Conference of the IEEE EMBS Boston, Massachusetts USA, August 30 - September 3, 2011
Design of a Instrumentation Module for Monitoring Ingestive Behavior in Laboratory Studies Juan M. Fontana, Paulo Lopez-Meyer and Edward S. Sazonov, Member, IEEE
Abstract—The development of accurate and objective tools for monitoring of ingestive behavior (MIB) is one of the most important needs facing studies of obesity and eating disorders. This paper presents the design of an instrumentation module for non-invasive monitoring of food ingestion in laboratory studies. The system can capture signals from a variety of sensors that characterize ingestion process (such as acoustical and other swallowing sensors, strain sensor for chewing detection and self-report buttons). In addition to the sensors, the data collection system integrates time-synchronous video footage that can be used for annotation of subject’s activity. Both data and video are simultaneously and synchronously acquired and stored by a LabVIEW-based interface specifically developed for this application. This instrumentation module improves a previously developed system by eliminating the post-processing stage of data synchronization and by reducing the risks of operator's error.
I. INTRODUCTION
T
HE balance between energy intake and energy expenditure is one of the most important factors for maintaining a healthy lifestyle. A positive energy imbalance towards the energy intake may lead to serious health problems such as overweight, obesity and other eating disorders. The World Health Organization estimated that the overweight adult population will increase from 1.5 billion in 2008 to 2.3 billion in 2015 and that obese population would rise from 500 to 700 million worldwide during the same period [1]. Studies have shown that obese individuals have an increased risk of developing chronic diseases such as cardiovascular and musculoskeletal diseases, diabetes and cancer [2]-[4]. Accurate measurement of energy content of ingested food during long-time periods is one of the major challenges facing obesity research. Several methods have been proposed and used to measure energy intake under freeliving conditions. Among them, the most precise method is the doubly-labeled water [5], which provides an indirect Manuscript received March, 25 2011. This work was partially supported by a grant 1R21DK085462 "Objective Monitoring of Energy Intake and Ingestive Behavior in a Free Living Population" from the National Institutes of Health. Juan M. Fontana is with the Department of Electrical and Computer Engineering, University of Alabama, Tuscaloosa, AL 35487 USA (e-mail:
[email protected]). Paulo Lopez-Meyer is with the Department of Electrical and Computer Engineering, University of Alabama, Tuscaloosa, AL 35487 USA (e-mail:
[email protected]). Edward S. Sazonov is with the Department of Electrical and Computer Engineering, University of Alabama, Tuscaloosa, AL 35487 USA (phone: 205-348-1981; e-mail:
[email protected]).
978-1-4244-4122-8/11/$26.00 ©2011 IEEE
measurement. The high-cost associated with tools and involved analytical methods make this approach impractical. Other methods, such as food-frequency questionnaires [6], [7] and self-reported diet diaries [8], [9], often lead to inaccurate estimations of energy intake due to individuals tend to miscalculate and underreport their daily intake. The introduction of multimedia diet records that include cameras has been also proposed to assess food intake but with the same results of people underreporting their food intake [10]. In addition, all these methods are tedious and lack of robustness for long-term studies or interventions. In an effort to objectively quantify the ingestive behavior and energy intake of individuals, our group is working on development of methodologies for monitoring and characterization of food intake in free living environment. Our approach is based on monitoring of ingestion by noninvasive wearable sensors that capture chewing and swallowing of an individual. Development of such wearable sensors starts with laboratory studies in which ingestion is observed by an instrumentation module consisting of sensors and a video monitoring system. Video monitoring is key step which allows for annotation of the ingestion process by a human observer. During annotation, the video stream is used to label all events of interest on the sensor recording (such as bites, periods of chewing, swallows). These labels are subsequently used in developing of the signal processing and pattern recognition algorithms. The instrumentation module presents several challenges: first, it should accommodate a wide variety of sensors; second, it should be capable of multi-channel high-throughput data acquisition and, third, should be capable of time-synchronous acquisition of multimedia data. In [11] we presented an earlier prototype of a laboratory instrumentation module consisting of a camcorder, two sounds cards and USB data acquisition card. The system was used to capture signals from the following sensors: miniature microphones located over the laryngopharynx, mastoid bone and inside ear canal were used to detect sounds of deglutition; a strain gauge sensor located below the outer ear was used to detect periods of mastication; a self-report button was used by subjects to report individual swallows; a camcorder was used for video observation. Data collected from 21 subjects during periods of food intake and quiet sitting was used by our research team to develop and evaluate monitoring ingestive behavior (MIB) methods to study the behavioral patterns of food consumption and to estimate the weight of ingested food [12]-[14]. The data collection software implemented in [11] combined multi-
1884
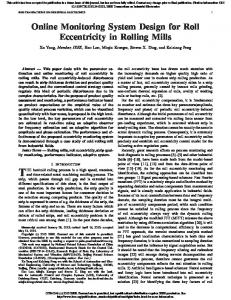
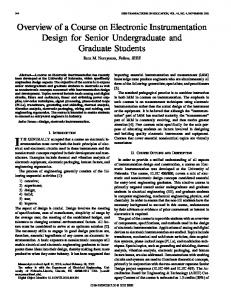
media data from all channels. Even thouugh all data was collected simultaneously, it was necesssary to provide audiovisual signals to synchronize video annd sensor signals. The disadvantages of the instrumentationn module in [11] included substantial clock drift between diffferent channels of data acquisition which resulted in asyncchronicity on the order of several seconds per each hour of recording and an arduous post-processing stage that was required to resynchronize all data. Moreover, arounnd 16% of the recordings had partially incomplete daata that can be allocated to a single reason of operator's erroor [11]. In this paper we propose an improvedd instrumentation module that simultaneously and synchronoously captures the multi-modal data from several high-baandwidth sensor channels and a webcam. Analog signals aree first merged into a single pre-amplification board for condiitioning and then inputted to a multi-channel DAQ board. T The synchronicity of the sensor signals with the webcam is ppreserved by time stamping of video frames. A LabVIEW based interface was developed to display and store the data forr further analysis. Experimental tests suggested that this moddule significantly reduced the clock drift and eliminated thee post-processing stage of synchronization. II. METHODS The block diagram presented in Fig. 1 shows the proposed instrumentation module. It encompassees sensors and associated hardware and software for data ccollection. A preamplification board received analog siignals from the different sensors for conditioning. A 116-bit resolution multichannel data acquisition board US SB-1608HS-2AO (Measurement Computing) was used to saample the signals from the pre-amplification board into the coomputer via USB 2.0. An interface developed in LabV VIEW (National Instruments) allowed a time-synchronous caapture and a realtime display and storage of multimeddia data. Fig. 2 illustrates a typical setup of the instrumenntation module to collect data for monitoring ingestive behavior.
swallowing. This sensors provide a dynamic range of 46 ± 2 Hz that includes 3 dB with a frequency range of 20-8000 the peak frequency of swallowin ng reported to be in the range of 1083.02-3286.73 Hz. Tw wo different pre-amplifier options were designed for con nditioning the acoustic signals: a) DC coupled amplifierr and b) AC coupled. In both cases, the gain of the amplifiers was set experimentally to reliably captture swallowing sounds while avoiding saturation of am mplifiers during normal speech. Swallowing signals rangeed from 0-3 V and were sampled at a rate 44,100 Hz and quantized q with 16 bits. 2. Chewing sensor was placed below w the outer ear to capture specific motions of the lower jaaw. A piezoelectric film strain gauge that produced more m than 10 mV per microstrain was used to detecct changes in the skin curvature during mastication. Thee strain sensor signal was buffered before acquisition using a custom-designed amplifier with input impedance of o approximately 10 MΩ. The amplitude of the buffered siignal ranged from 0-2 V and was sampled at 44,100 Hz and d quantized with 16 bits. 3. Ambient microphones were locateed at one side of subject's neck and directed outward to deteect background noise and talking. The importance of ambien nt sound detection is that it could potentially be used to im mprove the outcomes in sound recognition experiments. The T acoustic signals were amplified using a custom-built pre-amplifier and then sampled at 44,100 Hz. 4. A handheld push-button was used to mark each r as a pulse of 1.5 swallowing instance, which was recorded V. This self-report signal was allso acquired through the DAQ board and sampled at 44,100 0 Hz.
Fig. 2. A view of the instrumentation modulee for detection of food intake
Fig. 1. Block diagram of the proposed instrumentation module.
A. Sensors and Data Acquisition Hardwaare Implementation of the sensor interface based on a USB data acquisition card allowed for simultaaneous and timesynchronous capture of the following sensorr modalities: 1. Acoustical swallowing sensors were pplaced over the laryngopharynx to detect characteristic sounds of
Implementation of a video monito oring system consisted of a digital camera that registered subjject activity at 30 frames per second (fps). Each frame was marked m with a timestamp to synchronize video and sensor daata and then compressed and stored in the computer's hard driive. B. Data Collection Software An interface application was dev veloped in LabVIEW to collect, display and save the data into separate files. The o and the sensors signals real-time visualization of the video helped the operator to adjust both the camera position and
1885
C. Module Testing Initial testing of the system consisted of a function generator providing the same sinusoidal signal to all analog channels. Data recorded during a 30 minutes period was used to determine the amount of data lost and to check for any drift among sensor signals. Next, three different cameras were tested to determine the most suitable camera for this application: a PlayStation3 eye camera, a FireWire 1394 camcorder and a USB Phillips webcam. Performances were compared in terms of the acquisition rate obtained after ten minutes of signal and video recording. In addition, several compression filters were tested in terms of average writing time, video quality and compression rate to select the most appropriate filter. The synchronization provided by each time stamping method was tested by recording multimedia data for one hour periods. During the tests, the push-button was used to turn on an LED every 5-10 minutes. The video camera was pointing at the LED, so at each moment the LED was turned on, the timestamp of the frames were compared to the time course of the push-button signal to calculate the clock drift. The whole system was then tested to assess its capability of collecting high-throughput data and to determine the number of lost frames resulted after long periods of video and data acquisition. Three one-hour tests were performed, in which all sensors were connected to the DAQ board and the camera was pointing to a fixed location. The amount of data collected was compared among channels to check for incomplete data. The number of frames acquired was stored to determine the number of lost frames. The utility of the system was verified during collection of test data on 2 subjects. The ingestive behavior of each subject was monitored during a laboratory visit, which was divided into three parts: 1) 5 min rest interval, in which the subject was quietly seated; 2) meal, in which the subject had unlimited time to eat a meal of their choice; 3) a second 5 min rest interval. A custom designed annotation software developed in [11] was used to analyze the data collected.
Strain sensor signal
Amplitude (V)
1.4 1.2 1
0.8 850
855
860
865
870
875
880
885
875
880
885
Time(s) Throat mic signal 1 0.9 Amplitude (V)
the sensor locations to obtain proper data. The acquisition of multimedia data was carried out by two independent functions that run simultaneously. One of them was used to read, compress and store each video frame, while the other function read and saved each channel of data from the sensors. Sensor signals were saved as binary files. The interface was prepared to manage high-throughput data. For a typical one-hour food intake experiment the minimum storage requirements for 16-bit data sampled at 44,100 Hz was of the order of 310 megabytes for each channel. Video footage was captured at 30 fps and each frame was compressed and saved in an AVI file. The synchronization between video and sensor signals was maintained by time stamping each video frame. Those timestamps were written at the moment the frames were read from the buffer by using one of two different clocks: a) the USB-1608FS-2AO internal clock and b) the CPU system time.
0.8 0.7 0.6 0.5 850
855
860
865
870 Time(s)
Fig. 3. Chewing (top) and throat microphone (bottom) signals collected on one of the experiment. Self-report of swallowing overlays both graphs.
III. RESULTS The initial tests showed two main results. First, no data was lost during 30 minutes of acquisition due to the amount of data collected was equivalent to the test length. Second, correlation coefficient among channels was equal to 1 in all cases showed that all signals were perfectly synchronized. Ten minutes of signal and video recordings indicated that the PS3 camera overcame camcorder and Philips webcam. Only 3 out of 18,000 frames were lost using PS3, which gave an average frame rate of 29.99 fps. Regarding to the encoder selection, 'DV Video' was chosen because of the fastest average time to write an image into a file (approximately 1.3 ms for a 640x480 image) , the high video quality when compared with the uncompressed video (98% quality for DV vs. 100% quality for uncompressed video), and the small file size obtained (10 times smaller than uncompressed video). The use of the internal clock of the data acquisition board instead of the internal CPU clock was found to be the best way to write the timestamps. The use of the CPU system time to mark each image generated a drift between the video and sensors signals. This drift constantly increased over time making the CPU clock not suitable, especially for long-term recordings (> 30 minutes). On the other hand, the use of the USB-1608FS-2AO internal clock generated synchronous timestamps with a negligible drift that ranged between 0-40 ms during the entire recordings. Three one-hour tests were performed to determine the performance of the system for long-term experiments. Fig. 3 illustrates a 30 s period of two different signals acquired during one of the experiments. All channels collected the same amount of data which suggests that no data was lost during the recordings. On the video file, a total of 180,000 frames were expected. The average number of lost frames over the three tests was found to be 61 (approximately 2 sec) and the maximum number of consecutive lost frames was 15, meaning that the video will jump approximately half of a second in the worst case. This problem was solved by changing the way the frames were read from the buffer's ring structure. In the new approach, a frame was read from consecutive buffers instead of reading it from the next
1886
available buffer which sometimes skipped a buffer (frame lost). Results of several one-hour tests indicated that no frames were lost and that no additional drift was generated. The ingestive behavior of 2 individuals in a laboratory environment was monitored using the proposed instrumentation module to verify the system utility. The feasibility of the video and data collected was evaluated during the annotation of food intake events. A human rater was able to identify bites, chews and swallows using a previously developed software without the tedious and timeconsuming preprocessing stages (video deinterlace and signal synchronization) required by our earlier instrumentation prototype [11].
V. CONCLUSION An instrumentation module was presented for monitoring ingestive behavior in a controlled environment. This module captured data from several sensors and a digital camera. A LabVIEW-based interface collected, displayed and saved the data in real-time. Experimental results indicated that the proposed system was capable of high-throughput and timesynchronous acquisition of multi-modal data, which can be used for manual annotation of ingestion processes. These scores would serve as the gold standard dataset for a further development of methods for the objective detection of periods of food intake. REFERENCES
IV. DISCUSSION The most important advantage of the proposed data collection system was the integration of multi-modal, highbandwidth sensor signals and video footage into a single module. A time-synchronous acquisition was a key factor that avoided clock drift among data collected. In our earlier instrumentation prototype [11], video was recorded independently, and the sensor signals were collected from different modules. The result was a drift of several seconds per each hour of recording plus an arduous post-processing stage for synchronizing all data. In the proposed application, all sensor signals were synchronously collected by the DAQ board. The synchronization between video and sensors was preserved by time stamping the video frames by using the internal clock of the DAQ board. This method significantly reduced the drift to 0-40 ms, which was an acceptable value because it is comparable to the video acquisition period (approx. 33ms period between two consecutive frames). Another advantage of the proposed instrumentation module was that it expedited the stage in which data was prepared for annotation of the ingestion process. Two main reasons support that statement. First, acquisition of timesynchronous data, as explained in the paragraph above, eliminated the post-processing stage to synchronize data. Second, in the previous prototype, a camcorder captured video in an interlaced format, which required an additional deinterlace stage to obtain progressive video. In the proposed module, the deinterlace stage is eliminated because the PS3 camera captured video in a progressive format. Several other problems presented [11] were solved by the instrumentation module presented in this study. First, the acquisition of data through multiple modules sometimes led incomplete data. By capturing multi-modal data through a single acquisition board, no data was lost after long periods of data collection. Second, failure of the operator to turn on the camcorder or to provide the synchronization signal was observed in [11]. In the proposed software, the operator's task is reduced to simply select a name for the files and run the application which significantly reduced the risk of error. Finally, the acquired video was compressed and saved to the computer's hard drive thus reducing the risk of running out of camcorder tape as presented in [11].
[1] [2]
[3]
[4] [5] [6]
[7]
[8]
[9] [10]
[11] [12] [13]
[14]
1887
“WHO | Obesity and overweight.” [Online]. Available: http://www.who.int/mediacentre/factsheets/fs311/en/. Mar-2011. W. P. James, “What are the health risks? The medical consequences of obesity and its health risks,” Experimental and Clinical Endocrinology & Diabetes: Official Journal, German Society of Endocrinology [and] German Diabetes Association, vol. 106 Suppl 2, pp. 1-6, 1998. R. H. Eckel and R. M. Krauss, “American Heart Association call to action: obesity as a major risk factor for coronary heart disease. AHA Nutrition Committee,” Circulation, vol. 97, no. 21, pp. 2099-2100, Jun. 1998. S. J. Olshansky et al., “A potential decline in life expectancy in the United States in the 21st century,” The New England Journal of Medicine, vol. 352, no. 11, pp. 1138-1145, Mar. 2005. D. A. Schoeller, “Measurement of energy expenditure in free-living humans by using doubly labeled water,” The Journal of Nutrition, vol. 118, no. 11, pp. 1278-1289, Nov. 1988. A. M. Prentice, A. E. Black, P. R. Murgatroyd, G. R. Goldberg, and W. A. Coward, “Metabolism or appetite: questions of energy balance with particular reference to obesity,” Journal of Human Nutrition and Dietetics, vol. 2, no. 2, pp. 95-104, Apr. 1989. C. M. Champagne et al., “Energy Intake and Energy Expenditure: A Controlled Study Comparing Dietitians and Non-dietitians,” Journal of the American Dietetic Association, vol. 102, no. 10, pp. 1428-1432, Oct. 2002. N. Day, N. McKeown, M. Wong, A. Welch, and S. Bingham, “Epidemiological assessment of diet: a comparison of a 7-day diary with a food frequency questionnaire using urinary markers of nitrogen, potassium and sodium,” International Journal of Epidemiology, vol. 30, no. 2, pp. 309 -317, Apr. 2001. J. M. De Castro, “Methodology, Correlational Analysis, and Interpretation of Diet Diary Records of the Food and Fluid Intake of Free-living Humans,” Appetite, vol. 23, no. 2, pp. 179-192, Oct. 1994. C. H. Kaczkowski, P. J. H. Jones, J. Feng, and H. S. Bayley, “FourDay Multimedia Diet Records Underestimate Energy Needs in Middle-Aged and Elderly Women as Determined by Doubly-Labeled Water,” The Journal of Nutrition, vol. 130, no. 4, pp. 802-805, 2000. E. Sazonov et al., “Non-invasive monitoring of chewing and swallowing for objective quantification of ingestive behavior,” Physiological Measurement, vol. 29, no. 5, pp. 525-541, May. 2008. E. S. Sazonov et al., “Toward Objective Monitoring of Ingestive Behavior in Free-living Population,” Obesity (Silver Spring, Md.), vol. 17, no. 10, pp. 1971-1975, Oct. 2009. P. Lopez-Meyer, S. Schuckers, O. Makeyev, and E. Sazonov, “Detection of periods of food intake using Support Vector Machines,” in Engineering in Medicine and Biology Society (EMBC), 2010 Annual International Conference of the IEEE, 2010, pp. 1004-1007. E. S. Sazonov, O. Makeyev, S. Schuckers, P. Lopez-Meyer, E. L. Melanson, and M. R. Neuman, “Automatic Detection of Swallowing Events by Acoustical Means for Applications of Monitoring of Ingestive Behavior,” Biomedical Engineering, IEEE Transactions on, vol. 57, no. 3, pp. 626-633, 2010.