One route design guideline evidently followed by the AC Transit is that a passenger ..... We call the stops at activity centers and transfer points âmajor stopsâ and.
CALIFORNIA PATH PROGRAM INSTITUTE OF TRANSPORTATION STUDIES UNIVERSITY OF CALIFORNIA, BERKELEY
Design of a Demand-Responsive Transit System Yuwei Li, Jessica Wang, Justin Chen, Michael Cassidy University of California, Berkeley California PATH Working Paper
UCB-ITS-PWP-2007-4
This work was performed as part of the California PATH Program of the University of California, in cooperation with the State of California Business, Transportation, and Housing Agency, Department of Transportation, and the United States Department Transportation, Federal Highway Administration. The contents of this report reflect the views of the authors who are responsible for the facts and the accuracy of the data presented herein. The contents do not necessarily reflect the official views or policies of the State of California. This report does not constitute a standard, specification, or regulation. Report for Task Order 5402 August 2007 ISSN 1055-1417
CALIFORNIA PARTNERS FOR ADVANCED TRANSIT AND HIGHWAYS
Design of a Demand-Responsive Transit System Yuwei Li, Jessica Wang, Justin Chen, and Michael Cassidy Institute of Transportation Studies University of California at Berkeley 416 McLaughlin Hall Berkeley, CA 94720
Acknowledgement This work was performed as part of the California PATH Program of the University of California, under PATH Task Order 5402. The contents of this report reflect the views of the authors who are responsible for the facts and the accuracy of the data presented herein. We thank Robin Little, Tony Divito, Heather Barber, and Howard Der of AC Transit for meeting with us, furnishing data and providing valuable input on the service design. We also thank Dan Lovegren and Lindsee Tanimoto of Caltrans Division of Research and Innovation for their insights and managerial support.
1
Abstract This research investigates the feasibility of offering demand-responsive transit (DRT) service to the general public in situations of low demand density. The study region is AC Transit District 2 which consists of the cities of Fremont and Newark, California. We developed a methodology to evaluate operating efficiencies of existing bus lines and line segments, and identified areas suitable for DRT service based on year 2001 data. We proposed an alternating strategy of checkpoint DRT service and compared it to other strategies. The report also described the schema for an automated reservation and scheduling system. Our initial findings are: the service cuts and route changes implemented by AC Transit district 2 after 2001 largely concur with our analysis of the 2001 system; by making very limited additional changes to the fixed routes and using the proposed checkpoint service, AC Transit could have a net savings of 2-3 buses; and finally, this service offers considerable advantage in passenger access, reliability and service cost. Keywords: Automated Demand-responsive Dispatching System, Public Transit
2
Executive Summary The objective of this research is to investigate the feasibility of offering demand-responsive transit (DRT) service to the general public in situations of low demand density. The study region is the cities of Fremont and Newark, California. Fixed-route buses operated by AC Transit District 2 currently serve the region. We proposed and evaluated a hybrid checkpoint DRT operating strategy as an alternative to door-to-door DRT service, which is costly to transit agencies. In a checkpoint DRT system, passengers are picked up and dropped off on demand at predetermined checkpoints near their trip ends, and unrequested checkpoints are skipped. Under the proposed hybrid strategy, dense checkpoints are located along a route, and a bus would alternate between a checkpoint run and a fixed-route run. Compared to fixed-route schemes, the hybrid checkpoint DRT strategy have generally offered equal or better service with comparable agency cost in situations of low demand density. This report is organized as follows. In chapter 1, we describe the fixed-route bus system in the study region and the specific reasons that prompted this research. In chapter 2, we develop a methodology to evaluate operating efficiencies of existing bus lines and line segments and identify areas suitable for DRT service based on year 2001 data. In chapter 3, we present an alternating strategy of checkpoint DRT service and compare it to others. In chapter 4, we describe the schema for an automated reservation and scheduling system. Our findings are: the service cuts and route changes implemented by AC Transit district 2 after 2001 largely concur with our analysis of the 2001 system; by making very limited additional changes, AC Transit could free up four buses from fixed routes1 ; the proposed hybrid checkpoint DRT service offers considerable advantage in passenger access, reliability and service cost. We recommend that of the four buses freed up from our proposed changes to the existing routes, 1 or 2 buses be used to provide DRT service as part of a pilot program. In December 2004, we presented our findings and recommendations to AC Transit and Caltrans. AC Transit expressed strong interest in the development of an automated reservation and scheduling system that could be used to field test and deploy the proposed DRT service. In the remaining months of this project, we will evaluate the capabilities and constraints of information systems installed on buses, conduct a search of available commercial products that may serve as modules of the reservation and scheduling system, develop detailed specifications of the system, and estimate costs for these schemes.
1
It costs AC Transit approximately $300, 000 to purchase a bus and $300, 000 each year to operate it.
3
Contents 1 Background
1
2 Fixed-route System Evaluation 2.1 Performance Measures . . . . . . . . . . . . . . . . . 2.2 Evaluation of Lines . . . . . . . . . . . . . . . . . . . 2.3 Evaluation of Line Segments . . . . . . . . . . . . . . 2.3.1 Route OD Matrix Estimation . . . . . . . . . 2.3.2 Proposed Algorithm and Verification Method 2.4 Analysis of Low-Performance Lines . . . . . . . . . . 2.4.1 Line 232 . . . . . . . . . . . . . . . . . . . . . 2.4.2 Line 215 . . . . . . . . . . . . . . . . . . . . . 2.4.3 Line 218 . . . . . . . . . . . . . . . . . . . . . 2.4.4 Line 219 . . . . . . . . . . . . . . . . . . . . . 2.4.5 Line 231 . . . . . . . . . . . . . . . . . . . . . 2.4.6 Other Lines . . . . . . . . . . . . . . . . . . . 2.5 Summary and Impacts of Proposed Changes . . . . .
. . . . . . . . . . . . .
4 4 5 8 8 10 11 11 14 15 16 16 16 18
3 DRT Service Design 3.1 Performance Models of Fixed-route and DRT Services . . . . . . . . . . . . . 3.2 Checkpoint DRT Service . . . . . . . . . . . . . . . . . . . . . . . . . . . . . 3.3 Checkpoint DRT Service Pilot Porgram . . . . . . . . . . . . . . . . . . . . .
21 22 23 24
4 Schema of Automated Reservation and 4.1 System Components . . . . . . . . . . 4.2 Hardware and Software Requirements . 4.3 Supplemental Requirements . . . . . . 4.4 Next Steps . . . . . . . . . . . . . . . .
28 28 30 30 31
A Characteristic Plots
Dispatching . . . . . . . . . . . . . . . . . . . . . . . . . . . . . . . .
. . . . . . . . . . . . .
. . . . . . . . . . . . .
. . . . . . . . . . . . .
. . . . . . . . . . . . .
. . . . . . . . . . . . .
. . . . . . . . . . . . .
System . . . . . . . . . . . . . . . . . . . . . . . .
. . . . . . . . . . . . .
. . . .
. . . . . . . . . . . . .
. . . .
. . . . . . . . . . . . .
. . . .
. . . . . . . . . . . . .
. . . .
. . . . . . . . . . . . .
. . . .
. . . . . . . . . . . . .
. . . .
. . . .
33
i
List of Figures 1.1 1.2
Map of San Francisco Bay Area . . . . . . . . . . . . . . . . . . . . . . . . . Map of Fremont/Newark Region . . . . . . . . . . . . . . . . . . . . . . . . .
2.1 2.2 2.3 2.4 2.5 2.6 2.7 2.8 2.9
Characteristic Plot for Line 210 Southbound, AM Peak . Distribution of Line Pieces on Performance Measures . . Characteristic Plot for Line 232 Southbound, AM Peak . Alighting Estimation for Line 232 Southbound, AM Peak Impact of Eliminating a Portion of Line 232 Southbound, Segmentation of Line 232 Southbound, AM Peak . . . . Segmentation of Line 218 Southbound, AM Peak . . . . Map of Line 231 . . . . . . . . . . . . . . . . . . . . . . . Proposed Additional Changes to Fixed Routes . . . . . .
. . . . . . . . .
6 7 9 12 13 14 15 17 19
3.1
Map of Proposed Checkpoint DRT Service . . . . . . . . . . . . . . . . . . .
25
4.1
Components of the Reservation and Dispatching System . . . . . . . . . . .
29
A.1 Characteristic A.2 Characteristic A.3 Characteristic A.4 Characteristic A.5 Characteristic A.6 Characteristic A.7 Characteristic A.8 Characteristic A.9 Characteristic A.10 Characteristic A.11 Characteristic A.12 Characteristic A.13 Characteristic A.14 Characteristic A.15 Characteristic
Plots Plots Plots Plots Plots Plots Plots Plots Plots Plots Plots Plots Plots Plots Plots
for for for for for for for for for for for for for for for
Line Line Line Line Line Line Line Line Line Line Line Line Line Line Line
210 . 211 . 212 . 213 . 214 . 215 . 217 . 218 . 219 . 231 . 232 . 233 . 234 . 235 . 258 .
. . . . . . . . . . . . . . .
. . . . . . . . . . . . . . .
ii
. . . . . . . . . . . . . . .
. . . . . . . . . . . . . . .
. . . . . . . . . . . . . . .
. . . . . . . . . . . . . . .
. . . . . . . . . . . . . . .
. . . . . . . . . . . . . . .
. . . . . . . . . . . . . . .
. . . . . . . . . . . . . . .
. . . . . . . . . . . . . . .
. . . . . . . . . . . . . . .
. . . . . . . . . . . . . . .
. . . . . . . . . . . . . . . . . . . . . . . . AM Peak . . . . . . . . . . . . . . . . . . . . . . . .
. . . . . . . . . . . . . . .
. . . . . . . . . . . . . . .
. . . . . . . . . . . . . . .
. . . . . . . . . . . . . . .
. . . . . . . . . . . . . . .
. . . . . . . . . . . . . . .
. . . . . . . . .
. . . . . . . . . . . . . . .
. . . . . . . . .
. . . . . . . . . . . . . . .
. . . . . . . . .
. . . . . . . . . . . . . . .
. . . . . . . . .
. . . . . . . . . . . . . . .
. . . . . . . . . . . . . . .
2 3
34 35 36 37 38 39 40 41 42 43 44 45 46 47 48
List of Tables 3.1
Select modal characteristics for AC Transit, 2003 . . . . . . . . . . . . . . .
iii
23
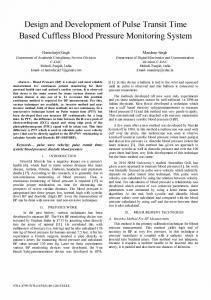
Chapter 1 Background The cities of Fremont and Newark are located in the east San Francisco Bay, between the major cities of Oakland and San Jose (see Figure 1.1). Together Fremont and Newark cover an area of 90.7 squares miles, and as of year 2002, have a combined population of approximately 247, 000. The local fixed-route bus service in Fremont and Newark is operated by AC Transit. Fremont and Newark are designated “Special Transit Service District 2” because the property tax collection and the allocations for local sales tax assistance in support of AC Transit operations there are separated from the rest of the AC Transit system. The Bay Area Rapid Transit (BART) connects Fremont and Newark to Oakland and San Francisco via two stations: one in Fremont and one in Union City (see Figure 1.2)1 . As such, many AC Transit bus lines serving district 2 terminate at one of these BART stations 2 . The Newpark mall, Lido Faire shopping center, and Ohlone College are also major activity centers where bus lines often terminate (see again Figure 1.2). In December 2000, AC Transit drastically changed bus routes and schedules in District 2 to accommodate projected travel patterns. Direct, grid-like new routes connecting BART stations to major activity centers, complemented by secondary feeder routes, replaced old routes that meandered through residential neighborhoods. Fifty percent more hours of service were added. In 2001, AC Transit operated 69 buses in District 2 during peak hours. For this service, local residents paid $23.5 million in property taxes and in fares. Following a downturn in the economy, AC Transit found that the new routes and schedules became financially unsustainable, and asked in 2002 for additional financial assistance to maintain the then-current level of service. District 2 opted out, partly because some residents perceived the bus system as not being sufficiently utilized. Consequently in 2003, AC Transit implemented significant service cuts and route restructuring. Small adjustments continue to occur. One route design guideline evidently followed by the AC Transit is that a passenger should walk at most 14 mile (or 5 minutes, assuming a walking speed of 3 miles per hour) to access the closest bus line. Notably however, the removal of poorly-utilized lines in low density areas would typically violate this guideline. The need to explore the feasibility of DRT service in low demand densities thus became apparent. AC Transit supplied the research team with data, including boarding/alighting counts at all stops for all lines from the AC 1 2
The straight-line distance between the two BART stations is 3.1 miles. Local service within Union City is operated by Union City Transit.
1
Figure 1.1: Map of San Francisco Bay Area
2
Figure 1.2: Map of Fremont/Newark Region
Transit Fall 2001 South County Boarding and Alighting Survey. These data were collected over several weeks and presumably represent a composite estimate of passenger activity for all trips listed in the public timetable for a single weekday.
3
Chapter 2 Fixed-route System Evaluation This chapter describes proposed changes to the fixed-route system of AC Transit District 2 that would open up an opportunity for demand-responsive transit. Given the normal budget considerations, an experimental DRT service would ideally replace portions of existing fixed routes rather than serving a previously-unserved area. A methodology for evaluating the structuring of routes was thus developed and described first.
2.1
Performance Measures
For this research, we adopt two performance measures: 1) average number of passengers onboard weighted by vehicle revenue mile, i.e. average onboard counts (AOC); and 2) average number of boardings per vehicle revenue mile, i.e. average boarding counts (ABC). The AOC and ABC measure how effectively longer and shorter passenger trips are served, respectively. The reader might imagine two lines X and Y with equal vehicle revenue miles. Passengers on line X all board at one end and alight at the other, while a a greater number of passengers board line Y but each travels a short distance on the route. AOC would reflect favorably on X but not so for Y. ABC would bode well for Y but not for X. Whether short trips or long trips should be served with priority is largely a value judgement of the community. However, if both ABC and AOC are low, they together indicate an ineffective line for the general public. As shown below, the two measures bear close relationship with other widely-used performance measures. The Federal Transit Administration (FTA) maintains the National Transit Database that reports validated financial and operating data of transit agencies nationwide. The database is updated annually. The 2001 summary sheet for AC Transit contain a section of performance measures. Six measures are listed under three categories: • Service Efficiency: – Operating Expense per Vehicle Revenue Mile (P1) – Operating Expense per Vehicle Revenue Hour (P2) • Cost Effectiveness: – Operating Expense per Passenger Mile (P3) 4
– Operating Expense per Unlinked Passenger Trip (P4) • Service Effectiveness: – Unlinked Passenger Trips per Vehicle Revenue Mile (P5) – Unlinked Passenger Trips per Vehicle Revenue Hour (P6) It should be noted that efficiency measures, P1 and P2, largely depend on the cost structure (e.g. labor, technology, maintenance) and management of the agency. Those factors do not differentiate individual lines. We have the following relationships: AOC =
P1 , P3
and
P1 P1 ∗ P6 = . P4 P2 Thus, using AOC and ABC is equivalent of using P3, P4, P5 and P6 to evaluate individual lines, assuming P1 and P2 are constant across lines1 . To calculate AOC and ABC for a line, boarding and alighting counts at each stop, as well as the distance between adjacent stops, are needed. Using these data, we can plot cumulative boardings and alightings along the route, as shown in Figure 2.1. We call this the Characteristic Plot. The horizontal axis is the distance along the line from the line’s origin. The vertical axis is the number of passengers. The upper curve shows cumulative boardings along the line, and the lower curve shows cumulative alightings. At any location along the line, the vertical distance between the two curves is the number of passengers onboard. Dividing the area between the two curves by the length of the line, we obtain AOC. ABC is simply the cumulative number of boardings along the line divided by the length of the line. ABC = P 5 =
2.2
Evaluation of Lines
In this research, we evaluate performance of lines at weekday peak hours (i.e. 6-9am and 4-7pm). This is because the number of vehicles required for peak service is a primary determinant of the overall service cost. It is typical that for each line, the ridership patterns in different directions, and during AM and PM peaks, are distinct. We call a time-direction combination a “piece” of a line. Therefore, for a line that runs in two directions (denoted 0 and 1), we produce a Characteristic Plot for each of 4 pieces: AM Direction 0, PM Direction 0, AM Direction 1, and PM Direction 1. For a line that runs circularly without change in direction, we produce a Characteristic Plot for an AM and a PM piece. The plots for all lines that have weekday peak service are included in Appendix A. For each line, and for every run of a weekday, we have as data the boarding and alighting counts for each stop. Each Characteristic Plot for a piece in Appendix A represents the 1
Average bus travelling speed, with stopping time taken into account, is approximately 12 miles per hour for all lines.
5
Line 210−0 Southbound AM Peak 50 ABC=2.24 pax/mile 45 AOC=8.84 pax 40
35
passengers
30
25
20
15
10
5
0
0
2
4
6
8
10 miles
12
14
16
18
20
Figure 2.1: Characteristic Plot for Line 210 Southbound, AM Peak
6
Performance of lines during peak periods 15
AOC
10
5
0
0
0.5
1
1.5
2 ABC
2.5
3
3.5
4
Figure 2.2: Distribution of Line Pieces on Performance Measures
average of multiple runs. For example, the morning peak is three hours. If the headway of buses on a line is 30 minutes, we typically have the average of six runs. Each Characteristic Plot is associated with a (ABC, AOC) value-pair that indicates the performance of the line. Summarizing the data for all pieces, we produced a X-Y plot, with ABC on the X-axis and AOC on the Y-axis (see Figure 2.2). Although some pieces have similar AOC values but not similar ABC values, we observe that there is a strong positive correlation between the two performance measures. This is not surprising. However, it is striking that there is a somewhat even distribution of pieces over a spectrum that goes from (0, 0) to (3+, 10+). The data show that the low-performance lines2 are 215, 218, 219, 231, 232, 234, 253, 258. During 2003 and 2004, AC Transit had implemented a series of route restructuring in district 2. Some route numbers were changed; some routes were cut, and some were combined. An analysis of the changes reveal that their cumulative effect for weekday peaks is mainly the following: lines 213, 215, 218, 219 run on reduced frequency; the New Park Mall-Ohlone College segment of line 232 is cut; lines 234, 253 and 258 were eliminated; for 231, the segment between Union City BART and Blacow runs on reduced frequency, and the segment between Blacow and Irvington is replaced by a new segment between Blacow 2
A low-performance line is defined as having the majority of its pieces meeting the criteria of AOC < 4 and ABC < 1/mile.
7
and Fremont BART along Sundale Ave. 3 The elimination of 234, 253 and 258 are well justified. Lines 253 and 234 are the two worst performing lines. Line 258 is a low-performance line, and the relatively well-utilized portion of it, between Union City BART and Ardenwood/Paseo Padre, was already served by line 232. Interestingly, the New Park Mall-Ohlone College segment of line 232 was cut. This gives rise to the following question: when should a segment of a line be cut, and how would the cut affect the performance of the remaining segment? This question is addressed below.
2.3
Evaluation of Line Segments
If a line does not perform well, the feasibility of improving its performance by cutting a segment depends on the number of passengers travelling a distance that spans the cut. If the end segment of a line is cut, calculating the change in ABC is straight-forward: the cumulative alighting at the cut-off point will become the cumulative boarding count for the segment that remains. However, the impact on AOC is not easily predictable, as illustrated below. In Figure 2.1, the 0-to-4-mile segment can be separated from the rest because almost all passengers boarding in the segment also alight along that segment. Therefore, cutting this low-performance segment would have little impact on the boarding and alighting patterns of the remaining segment, which has better performance. In contrast, in Figure 2.3, there are very few boardings after mile 9, where a few passengers alight. Cutting the segment after mile 9 would clearly improve ABC. If most passengers alighting after mile 9 board after mile 6 (i.e. their trips are short), cutting the segment is likely to improve AOC. On the other hand, if most passengers alighting after mile 9 board at mile 0 (i.e. their trips are long), AOC is likely to become worse if the segment after mile 9 is cut. The available data contain boarding and alighting counts at each stop but do not provide the origin and destination stops of passengers. In order to determine the impact on AOC, we need to estimate the route OD matrix using the boarding/alighting counts.
2.3.1
Route OD Matrix Estimation
The need to estimate the route OD matrix using the boarding/alighting counts arises in many other situations, as documented in [5]. Boarding/alighting counts are far more readily available than is an OD matrix, mainly because of the costs associated with obtaining the latter. Consequently, the bus route OD matrix estimation problem has been extensively studied in the literature. For a given OD matrix with rows representing origins and columns representing destinations, the row and column totals represent boarding and alighting counts respectively. A given set of boarding/alighting counts can correspond to many OD matrices. The essential 3
Some routes in the 2001 system got different route numbers after 2001. For example, line 233 in the 2001 system was replaced by portions of lines 213 and 214 in the 2004 system. The cumulative effect on the original line 233 is considered none.
8
Line 232−0 Southbound AM Peak 20 ABC=0.92 pax/mile 18 AOC=4.81 pax 16
14
passengers
12
10
8
6
4
2
0
0
2
4
6
8
10 miles
12
14
16
18
20
Figure 2.3: Characteristic Plot for Line 232 Southbound, AM Peak
9
task is to pick, among all OD matrices that agree with the set of row and column totals, the one that is most appropriate.4 A common approach is the balancing method (see [2], [6] and [1]). The theoretical foundation of the method is the following: a seed matrix (e.g. a small or outdated OD matrix) exists; the objective is to pick the OD matrix that conforms to the boarding/alighting counts but provides minimum information over the seed matrix;5 a unique optimal solution exists if there is a feasible solution; and an iterative algorithm that balances row and column totals one at a time is proven to converge to the optimal solution. The seed matrix is supposed to incorporate the knowledge about the travel pattern. In most practical applications, all OD combinations were presumed equally probable. In this case, a single-pass algorithm, proposed by Tsygalnitsky [9], could be used. Tsygalnitsky’s method can be characterized by a fluid analogy (see [7]): passengers on the bus are considered a thoroughly-mixed fluid; boarding passengers are added to the fluid after travelling a minimum distance; alighting passengers are drawn from the fluid in proportion to their representation in the fluid. It was proven in [5] that Tsygalnitsky’s method is the same as the balancing method using a null seed matrix. Tsygalnitsky’s method can accommodate one assumption: passengers do not ride a very short distance because walking may be more convenient. The equivalent balancing method specifies that in the null seed matrix, elements corresponding to short-distance travel be zero while all other elements be one. When no minimum ride distance is specified, Tsygalnitsky’s method guarantees a unique solution. When a minimum distance is specified, a feasible solution may not exist but this is easily detected and the minimum ride distance assumption can be temporarily nullified to allow a feasible solution. The fluid analogy may not be close to reality on some routes. Finding that Tsygalnitsky’s method fits data well for some routes imply little about its applicability on other routes. Considering that the lines in the study region all start and end in a few major activity centers (i.e. BART stations, shopping malls), we can reasonably assume that a line mainly serves to carry people between their residences and the activity centers, or a few major transfer points. We call the stops at activity centers and transfer points “major stops” and others “minor stops”. Travelling between minor stops can be assumed less likely than other types of travel. The major/minor-stop assumption can be incorporated into the seed matrix for the balancing method by specifying that the elements corresponding to minor-to-minor travel be smaller than others. However, a feasible solution may not exist for the problem, then the balancing method may not converge.
2.3.2
Proposed Algorithm and Verification Method
Alternatively, we propose a generalized single-pass algorithm for estimating the route OD matrix using only the boarding/alighting counts. The proposed method can distinguish between different types of stops, and incorporate the assumption about people’s boarding/alighting patterns at these stops. Specifically, if a is an onboard passenger who 4 5
Sometimes the requirement on the agreement to row/column totals may be relaxed. Equivalently, the objective is to pick the OD matrix with maximum likelihood.
10
boarded at a major stop, the probability of that passenger alighting at stop s is denoted as pas ; if b is an onboard passenger who boarded at a minor stop, denote the probability that she alights at stop s as pbs . We assume that for any minor stop s, pas 1−α = pbs α
(2.1)
where α ∈ (0, 1]; and for any major stop s, ppas = 1. Apparently, Tsygalnitsky’s algorithm is bs a special case of our proposed algorithm, when all stops are indistinguishable and α = 0.5. Once α is specified, passengers alighting at minor stops then should be drawn from the onboard passengers according to the assumed probability ratios. Suppose at a minor stop, there are Na onboard passengers who boarded at major stops and Nb onboard passengers who boarded at minor ones. Among the N passengers that alight the minor stop, n boarded at major stops. It can be proven that if the assumption of ppas = 1−α can be satisfied, then α bs n is given by n=
(1 − α)Na N (1 − α)Na + αNb
(2.2)
An exception occurs when equation (2.2) gives n > Na . This means that one type of passenger is exhausted before the assumption (2.1) could be satisfied. This exception is handled by setting n = Na . To test how well a method would yield an OD matrix that fits the reality, two approaches can be taken. The first is to compare the predicted OD matrix with the actual OD matrix. However, this requires that an actual OD matrix is available–then there is really no need to estimate the OD matrix. Alternatively, we can use only the boarding and alighting data. To do so, we realize that we have multiple runs on the same route during, for example, the AM peak. Data for all bus trips6 are used to obtain the OD matrix. Dividing each row of the OD matrix by the row total, we obtain the alighting probability matrix P .7 Using P and boarding data for each individual bus trip, we can predict alighting counts, and compare them to the actual alighting counts at the stops. The alighting counts predicted by different methods would yield different values for AOC.8 Therefore, the closeness of predicted AOC and actual AOC serves as a good measure of the comparative validity of a method under a specific situation.
2.4 2.4.1
Analysis of Low-Performance Lines Line 232
For illustration purpose, we tested the generalized single-pass algorithm under varying α between 0.1 and 0.5 with a increment of 0.05, for line 232 southbound during the AM peak. An α = 0.1 corresponds to the case when minor-to-minor travel is very unlikely, and 6
Apparent outliers may be excluded. It is possible that the row total equals zero. This means that no passenger boards at the stop corresponding to the row. We devised a procedure to handle this situation. 8 The value of ABC is determined only by boardings. 7
11
passengers
passengers
5 0
20
5
10 15 Alighting with α=0.2
10 5 0
20
5
10 15 Alighting with α=0.4
passengers
10 5 5
10 miles
0
15
10 15 Alighting with α=0.3
20
15 10 5 0
5
10 15 Alighting with α=0.5
20
ABC=0.80 pax/mile AOC=5.34 pax
15 10 5 0
20
5
ABC=0.80 pax/mile AOC=5.82 pax
20
ABC=0.80 pax/mile AOC=5.58 pax
0
5
0
20
15
0
10
20
ABC=0.80 pax/mile AOC=6.07 pax
15
0
ABC=0.80 pax/mile AOC=6.30 pax
15
0
20
passengers
passengers
20
10
0
passengers
Alighting with α=0.1
Verification Run #5 Actual Boarding/Alighting 20 ABC=0.80 pax/mile AOC=6.01 pax 15
0
5
10 miles
15
20
Figure 2.4: Alighting Estimation for Line 232 Southbound, AM Peak
an α = 0.5 corresponds to Tsygalnitsky’s algorithm. Figure 2.4 shows the result for one bus trip. The overall result from the 6 verification bus trips suggests that for line 232 southbound, AM peak, an α = 0.25 produces the best match between the predicted AOC and the actual AOC. This means that the likelihood of alighting a minor stop for an onboard passenger who boarded at a major stop is three times of that for an onboard passenger who boarded at a minor stop. With the OD matrix derived by using α = 14 , we can now predict the impact of cutting the segment of line 232 between Newpark Mall and Ohlone College (i.e. after mile 12.5). As shown in Figure 2.5, the performance measures of the remaining southbound segment would be worse than those of the previous full piece during the AM peak! In addition to the AM southbound piece, there are other pieces of line 231. Cutting the segment was probably justified on the basis of improving the performance for the southbound PM peak and northbound AM peak pieces, as shown in Figure A.11 in Appendix A. 12
Line 232−0 Southbound AM Peak Full 20
ABC=0.72 pax/mile AOC=4.58 pax
passengers
15
10
5
0
0
2
4
6
8
10 miles
12
14
16
18
20
16
18
20
Line 232−0 Southbound AM Peak Reduced 20
ABC=0.67 pax/mile AOC=3.29 pax
passengers
15
10
5
0
0
2
4
6
8
10 miles
12
14
Figure 2.5: Impact of Eliminating a Portion of Line 232 Southbound, AM Peak
13
Line 215−0 Southbound AM Peak Full 20
ABC=0.78 pax/mile AOC=3.61 pax
passengers
15
10
5
0
0
2
4
6
8
10 miles
12
14
16
18
20
16
18
20
Line 215−0 Southbound AM Peak Reduced 20
ABC=0.63 pax/mile AOC=1.65 pax
passengers
15
10
5
0
0
2
4
6
8
10 miles
12
14
Figure 2.6: Segmentation of Line 232 Southbound, AM Peak
Line 258 (see Figure A.15 in Appendix A) mainly carried passengers from Union City BART to Ardenwood during the AM peak and brought them back to Union City BART during the PM peak. AC Transit’s 2003 decision to integrate 258 into 232 thus seems a reasonable one.
2.4.2
Line 215
Line 215 clearly consisted of two separable segments connected at the Fremont BART station (see Figure A.6 in Appendix A). It is easily verifiable, that the north and south segments (i.e. before and after mile 6.4, see Figure 2.6) had about the same ABC, but the AOC of the south segment (i.e. Fremont BART to Warm Springs) was much better than the AOC on the north segment (i.e. Newpark Mall to Fremont BART). During the restructuring of 2003 and 2004, the headway on line 215 increased from 30 minutes to 60 minutes. The two portions were decoupled. The north segment became part of 14
Line 218−0 Southbound AM Peak Full 20
ABC=1.71 pax/mile AOC=6.07 pax
passengers
15
10
5
0
0
1
2
3
4
5 miles
6
7
8
9
10
8
9
10
Line 218−0 Southbound AM Peak Reduced 20
ABC=2.26 pax/mile AOC=7.05 pax
passengers
15
10
5
0
0
1
2
3
4
5 miles
6
7
Figure 2.7: Segmentation of Line 218 Southbound, AM Peak
line 232, then part of line 216. However, the performance of this segment strongly suggests it is a good candidate for elimination.
2.4.3
Line 218
Figure A.8 in Appendix A indicates that the southbound AM piece of line 218 performed well, while other pieces did not. After the restructuring of 2003, the headway on line 218 increased from 30 minutes to 60 minutes. The south segment between Grimmer/Fremont and Ohlone College saw significantly lower ridership compared to the north segment of the line. As shown in Figure 2.7, elimination of this segment would cut the route length in half, and improve the performance of the remaining segment. Thus the south segment of line 218 is a good candidate for elimination.
15
2.4.4
Line 219
Figure A.9 in Appendix A indicates that line 219 mainly carried passengers along the route to Fremont BART during the AM peak and took them back from Fremont BART during the PM peak. The performance measures were rather weak. Increasing the headway from 30 minutes to 60 minutes, as implemented in the restructuring of 2003, was appropriate.9 In addition, there were very few boardings or alightings between Fremont/Thornton and Fremont BART along line 219. Therefore, line 219 could be diverted to cover line 215’s portion between Fremont/Peralta and Fremont BART, if line 215 were to be eliminated.
2.4.5
Line 231
Figure A.10 in Appendix A indicates that line 231 mainly carried passengers along the route to Union City BART during the AM peak and took them back from Union City BART during the PM peak. There was little demand for northbound PM peak service. A large percentage of passengers boarding southbound during the AM peak alighted at Blacow/Grimmer (see Figure 2.8). The restructuring of 2003 led to the following changes to line 231: the segment between Union City BART and Blacow/Sundale runs on reduced frequency, and the segment between Blacow/Sundale and Irvington is replaced by a new segment between Blacow/Sundale and Fremont BART along Sundale Ave. In Figure 2.8, the old line 231 is shown in blue, and the updated is shown in red. Consequently, line 231 no longer run through Blacow/Grimmer. This would most likely lead to significant deterioration in performance for the southbound AM peak piece. The performance of the southbound PM peak piece and the northbound AM peak piece would also be negatively affected. From the perspective of performance measures, eliminating the whole line makes sense. The problem is, doing so would lead to the situation that, for many residents living in the area enclosed by I880/Decoto/Fremont/Thornton, there would be no bus line within walking distance. Since the data provided by AC Transit describes the system of 2001 and cannot be used to determine the performance of the updated line 231, we conducted field observations by riding the bus in weekday peak hours. On each direction, ABC < 1. Thus the performance of the updated line 231 is also weak. Our proposed solution is to increase the headway on line 232 from 30 minutes to 60 minutes, and use the freed-up bus to run a new line that combines the Union City BARTThornton segment of line 232 and the Thornton-Union City BART portion of line 231. During the morning peak this new line would run counter-clockwise, and during the evening peak this line would run clockwise. This new line would take advantage of the directional travel patterns that exist on lines 231 and 258.
2.4.6
Other Lines
The restructuring in 2004 brought into existence a new line, 216. it combines the Newpark Mall-Fremont BART portion of old line 215 and the Fremont BART-Union City BART 9 Line 219 is now joined to line 218 at Fremont BART to form the new line 218. This name change does not make much difference in line performance.
16
Figure 2.8: Map of Line 231
17
portion of old line 213. The headway on line 216 is 60 minutes. The headway on the Newpark Mall-Fremont BART portion of old line 213 was 15 minutes. For the updated 213, the headway on that portion is 30 minutes. The updated line 213 includes the Lido Faire- Newpark Mall portion of the old 233 and the Newpark Mall-Fremont BART portion of the old 213. These portions are served with the same 30 minutes headway. However, the ridership on the Lido Faire- Newpark Mall portion seems much lighter than that on the Newpark Mall-Fremont BART portion. Since the data provided by AC Transit describe the system of 2001 and cannot be used to determine how many passengers would travel from one portion to the other, we conducted field observations by riding the bus in weekday peak hours. On a northbound bus trip, of the 15 passengers who boarded between Fremont BART and Newpark Mall, only one continued to the Newpark Mall-Lido Faire segment. On a southbound bus trip, of the four passengers who boarded between Lido Faire and Newpark Mall, two continued to the Newpark Mall-Fremont BART segment. This suggests that the two portions are indeed separable. Since the Newpark Mall-Lido Faire segment carries a much lighter load, we recommend that the headway on this segment increase to 60 minutes. This could be accomplished by running a Lido FaireNewpark Mall-Fremont BART line (i.e. updated 213) with a 60-minute headway and running a Newpark Mall-Fremont BART-Union City BART (i.e. old 213) with a 60-minute headway.
2.5
Summary and Impacts of Proposed Changes
We analyzed AC Transit ridership data for 2001 and found that the service cuts and route changes implemented by AC Transit district 2 after 2001 largely concur with our conclusions on line performances. In addition, we propose the following additional changes, in terms of the route numbers present in Spring, 2005: 1. Combine lines 213 and 216, such that a line (the black one in Figure 2.9) runs from Lido Faire to Newpark Mall to Fremont BART with a 60-minute headway, and a line (the red one in Figure 2.9) runs from Newpark Mall to Fremont BART to Union City BART with a 60-minute headway; 2. Cut line 231. Increase the headway on line 232 from 30 minutes to 60 minutes, then use the freed-up bus to run a new line (the blue one in Figure 2.9) that combines the Union City BART-Thornton segment of line 232 and the Thornton-Union City BART portion of line 231. During the morning peak this new line would run counter-clockwise. It would run clockwise during the evening peak. 3. Reroute line 218 to cover line 216’s portion between Fremont/Peralta and Fremont BART, and eliminate line 218’s segment between Grimmer/Fremont and Ohlone College. Item 1 would free up the two buses currently running line 216. Item 2 would free up an additional two buses currently running line 231. Three buses are estimated to be currently running on line 218. Item 3 will not save a full bus, but can reduce the running time of each bus by 20%. This extra capacity could be used elsewhere through interlining. 18
Figure 2.9: Proposed Additional Changes to Fixed Routes
19
Implementing items 1 and 2 would leave a large area in central Fremont, a 2 mile by 1.5 mile rectangle shown in Figure 3.1 and confined by I880/Thornton/Fremont/Stevenson, served only by line 213 on Mowry Avenue. We propose that an experimental DRT service be launched to serve this area. This proposal is described in the next chapter.
20
Chapter 3 DRT Service Design A demand-responsive transit (DRT) service is an alternative to a fixed route system that operates a vehicle along a prescribed route according to a fixed schedule.1 With DRT, client requests affect the dispatch schedule and/or the routing of a vehicle. DRT encompasses a wide spectrum of services. In some cases (not proposed here), vehicles go to passenger doorsteps. In other cases, vehicles run on a prescribed route without a fixed schedule. In this latter case, vehicles may only visit a subset of prescribed checkpoints, based on passenger requests. Public provision of DRT service typically arises in the following situations: 1. ADA-complementary service: Title II of the Americans with Disabilities Act (ADA) of 1990 mandates that public transit systems that provide fixed-route services must furnish both accessible fixed-route services and complementary paratransit service for disabled persons who cannot use fixed-route transit. Persons qualifying for ADAcomplementary services must meet eligibility requirements, and ADA-complementary paratransit services need only be offered to those living in corridors 34 mile on each side of existing fixed-routes. 2. Voluntary DRT service for the elderly and the disabled: This type of service is usually provided by the local government to enhance the mobility of the elderly and the disabled persons in its jurisdiction. The clients may not fit into the tightly defined ADA eligibility categories, and the service may reach areas beyond what is mandated by ADA. 3. DRT service for the general public: In areas where, or during periods when, the travel demand density is low, DRT may be a lower-cost alternative to fixed-route transit service for the general public. The primary purpose for offering DRT in the first two situations is to achieve the social objective of equal and adequate access to public transit for disadvantaged individuals, in areas where a fixed-route system is more economical than DRT. As such, door-to-door service is often required to meet the needs of target clients. Typically the unit cost of serving a 1
While a fixed-route bus could run behind schedule because of heavier than expected passenger boarding and alighting, it is not actively responding to a client request to reach that individual.
21
passenger trip in this way far exceeds the fare revenue. For example, in 2003 the DRT service for AC Transit averages $24.8 in operating expense and $1.5 in fare revenue per passenger trip2 . Because population density in district 2 (2700/square mile) is far below that of the overall AT Transit system (3900/square mile), the operating expense per DRT trip in district 2 is probably a bit higher than the system average. The objective of this research is to investigate the feasibility of offering demand-responsive transit (DRT) service to the general public in situations of low demand density. It is unlikely that a door-to-door DRT service for the general public in district 2 is financially feasible. In addition, unlike fixed-route service, door-to-door service usually requires a large pickup time window (30 minutes for East Bay Paratransit that currently operates DRT for AC Transit), and reservation well in advance (at least the previous day for East Bay Paratransit). Such service characteristics may not appeal to the general public. Instead, we look for DRT operating strategies other than door-to-door service. While it is the hope of many transit operators to find a DRT alternative to door-to-door service to curb the high cost of ADA-complementary service, such alternatives rarely exist, because section 224 of the ADA governs the public entity operating a demand responsive system: “If a public entity operates a demand responsive system, it shall be considered discrimination, ..., for such entity to purchase or lease a new vehicle for use on such system,..., that is not readily accessible to and usable by individuals with disabilities, including individuals who use wheelchairs, unless such system, when viewed in its entirety, provides a level of service to such individuals equivalent to the level of service such system provides to individuals without disabilities.” Therefore, if non-door-to-door DRT service is provided to the general public, most likely door-to-door paratransit service is required to cover the same service region to provide disabled individuals with comparable service. This is in addition to the requirement that, complementary paratransit service shall be provided to origins and destinations within corridors with a width of three-fourths of a mile on each side of each fixed route, if fixed route service is also provided. Because AC Transit mainly provides fixed-route service, and line spacing is usually much less than 1.5 miles, door-to-door complementary paratransit service shall be provided, no matter if any DRT service is provided to the general public. Thus we do not look for a DRT alternative to complementary paratransit service. That being said, if a DRT service to the general public is deemed more convenient by some ADA-eligible individuals that would otherwise require door-to-door service, there could be savings from their voluntary switching to the non-door-to-door DRT service.
3.1
Performance Models of Fixed-route and DRT Services
DRT service currently provided by AC Transit is predominantly door-to-door type. Table 3.1 gives select modal characteristics3 of the fixed-route and DRT operations by AC Transit in 2003. On average, a DRT trips costs $24.2 in operating expenses, compared to $3.9 for a 2 3
Calculated with data from the 2003 National Transit Database. Source: 2003 National Transit Database
22
Mode Fixed-route DRT
Operating Annual expenses pax miles $245, 967, 835 172,496,283 $16, 636, 020 5,498,669
Annual veh. revenue miles 23,532,658 5,777,922
Annual unlinked trips 62,292,979 670,094
Table 3.1: Select modal characteristics for AC Transit, 2003
fixed-route trip. The AOC is 7.3 for fixed-route and 0.95 for DRT. The average passenger trip length is 8.2 miles for DRT and 2.8 miles for DRT. Figure 2.2 showed that the performance on fixed lines vary greatly. For fixed-route lines that serve areas with low demand densities, the operating expense for a passenger trip is likely to be much higher than the system average. We have modelled fixed-route operations over an idealized grid network, taking several cost components into consideration. The cost to passengers included the cost for walking to and from stops, on-bus travel time, bus stopping time, and transfers. From the perspective of minimizing a linear combination of passenger cost and agency cost by selecting appropriate line spacing, headway, and stop spacing, we reached the following conclusion: the optimal 1 line spacing, optimal headway, and optimal cost per user are all proportional to δ − 3 , where δ is demand density (in number of passengers per hour per square mile. Performance models for door-to-door DRT service have been in development since the early 1970s (see [10], [11] and [3]). Measures for waiting time and riding time typically depend on demand density but also on the operating strategy. The validity of these models in situations of low demand density, remains to be seen. However, it is generally agreed that above a certain threshold for demand density, fixed-route buses are cost-effective. Below that threshold, door-to-door service can be offered at lower cost. With the data in Table 3.1, we calculate that the AOC for the DRT service in the AC Transit system is 0.95. For many of the low performance lines we analyzed in the last chapter, the AOC is lower. This strongly suggests that the fixed-route vs DRT decision deserves careful consideration.
3.2
Checkpoint DRT Service
In a checkpoint DRT system, passengers are picked up and dropped off on demand at predetermined checkpoints near their trip ends. They must walk to and from the checkpoints to complete their trip. It resembles door-to-door service if the checkpoints are extremely dense but the the demand at any checkpoint is light. If there are only a few checkpoints but the demand is heavy at all checkpoints, it resembles fixed-route service. Checkpoint systems have not received much attention, either in practice or in academic studies. The likely reason is, as summarized in [4]: “For high demand levels, the total cost per passenger for fixed route and checkpoint systems is very close...fixed route systems should be preferred as they can be operated on a schedule and require less dispatching effort. As the demand level decreases, ..., by the time demand responsive systems are significantly better than fixed-route systems, door-to-door service can be provided at an even lower cost.” 23
What is missing from this description is that, when the demand level is on the threshold, changing from fixed-route to door-to-door service would greatly alter the distribution of the cost burden on users and the operator, although the sum changes little. When the demand density is low, fixed route buses must be run on large line spacing and headway. Door-to-door service is much more attractive to the passengers but also much costlier for the operator. As a result, the demand level may jump, such that the operator is no longer capable of serving all the requests. This is exactly the reason that some door-to-door service to the general public fail– they are too successful in attracting passengers! Therefore, the window of demand levels that makes checkpoint service attractive is much larger than predicted in [4]. However, since checkpoint service is demand-responsive, we must address the issues of punctuality and scheduling complexity. In the following section, we propose a hybrid checkpoint DRT service for field test in the region proposed at the end of last Chapter.
3.3
Checkpoint DRT Service Pilot Porgram
Figure 3.1 shows the proposed focus area (within a black rectangle). It is a low demanddensity area in central Fremont. If our recommendations on restructuring lines 216 and 231 are adopted, this area would be left with only line 213 on Mowry Avenue, which is not within 1 mile of walking distance for many people in the area. 4 The proposed hybrid checkpoint DRT service runs between Fremont BART station and Newpark Mall, as shown with the green line in Figure 3.1. It is unique in the following aspects: • It alternates between a checkpoint mode and a fix-route mode. A complete cycle for a bus includes four bus trips: BART to Mall, checkpoint; Mall to BART, fixed-route; BART to Mall, fixed-route; Mall to BART, checkpoint. • A large number of checkpoints are located within the area along the fixed-route. During a fixed-route bus trip, the bus visits all checkpoints along the route. • During a checkpoint bus trip, the bus visits a checkpoint only when necessary. It may skip checkpoints when there is no demand, and take a shortcut to the next requested checkpoint. However, the checkpoints are visited in fixed sequence. For example, during a Mall-to-BART bus trip, checkpoint 15 cannot be visited prior to checkpoint 5. • The bus leaves BART and the Mall at scheduled times. The trip time for a fixed-route bus trip is fixed. The trip time for a checkpoint bus trip is capped. • Walkup (i.e. no reservation) passengers are accommodated on fixed-route bus trips. • Rides on checkpoint bus trips must be reserved, and the number of reservations on a bus trip is limited to ensure the trip time for the bus trip does not exceed the predetermined upper limit. Those not accommodated are pushed to earlier or later fixed-route runs. 24
Figure 3.1: Map of Proposed Checkpoint DRT Service
25
A reservation and scheduling system and process are described in the next Chapter. The fixed-route is constructed so that any location within the focus area is within 14 mile of the route. A fixed-route bus trip takes 45 minutes, and the route length is 8.2 miles. It takes 4 minutes to travel 0.7 miles from Newpark Mall (checkpoint 1) to Blacow/Mowry (checkpoint 2), and 6 minutes to travel 1 mile from Fremont/Mowry (checkpoint 27) to Fremont BART. These end segments must be travelled on any bus trip. There are 24 skip-able checkpoints (i.e. checkpoints 3-26) in the focus area along the route. Theoretically, more checkpoints could be located to reduce walking distance to the checkpoints. However, above a certain number, the cost associated with setting up more checkpoints would outweigh the savings in walking distance. On a checkpoint bus trip, if the bus visits randomly-selected N out of the all checkpoints in the area, the travel distance d between point 2 and point 27 can be estimated by the following formulae: √ d = min(k AN , L)
(3.1)
where A is the size of the focus area (3 square miles). k√ is a constant depending on the road geometry of the area. Typically k ∈ (0.7, 1). The term k AN is a well-known approximation of the length of shortest path to visit N random points in area A (see [8]). For the rectangular grid in the focus area, we take k = 0.85. L is the length of the route segment, between checkpoint 2 and checkpoint 27. Bounding d by L is necessary because the checkpoints are not randomly located, and d should be bounded by the minimum length required to visit all of them along the fixed route. L = 6.5 miles. Thus we have, in miles, √ d = min(1.5 N , 6.5) (3.2) Using Equation (3.2), we see that once N > 15, there is no point to run a checkpoint service because the travel time savings over fixed-route service would be very minor (< 10%). When N = 9, the checkpoint travel distances in the area is approximately 4.5 miles. This would cut the expected total route travel time from 45 minutes to 34 minutes. When N = 6, the checkpoint travel distances in the area is approximately 3.7 miles, and the expected total route travel time is 30 minutes. We recommend capping the running time to 35 minutes, if 10 minutes of driver layover and recovery time for every 80 minutes of trip time is sufficient. Then a cycle containing 4 bus trips (1 checkpoint and 1 fixed-route in each direction) can be completed in 3 hours. Depending on desired the headway, AC transit could allocate 1 or 2 buses to run the route. The relationship between the bounded route length (or trip time) and the number of customers M that can be accommodated on a checkpoint bus trip is complex. It depends on how likely people want to board or alight at the same stop. So is the relationship between N and M. A simulation program was written to determine these relationships and predict the performance of the checkpoint DRT service. The simulation program takes any assumption about customer OD patterns, and generates customer requests accordingly. Customer requests are evaluated sequentially. If accommodating a request does push the route length over the bound, it is accepted. Otherwise it is rejected. A rejection means that the customer is advised to take a earlier
26
or later fixed-route bus, or to check the availability of another checkpoint run. The process stops after 10 requests are rejected, and the values of M and N are obtained. For example, for an eastbound trip, we assume that 31 of all customers want to travel from Newpark Mall to the focus area, 13 want to travel within the area, and 13 want to travel from the focus area to Fremont BART/Washington Hospital. The bus trip time is capped at 34 minutes. The results are: E(M ) = 12.4, σ(M ) = 4.8, E(N ) = 8.7, σ(N ) = 2.2. There are great advantages of the hybrid (or alternating) checkpoint DRT service in terms of passenger access, reliability and service cost. Specifically, • Every bus trip starts at a predetermined time, and the trip time for a checkpoint trip is bounded. Therefore, it is not difficult to give DRT customers accurate estimates of pickup and dropoff time. This is a major advantage over other DRT services. • The alternating strategy guarantees service to a customer within a reasonable time window. If a customer cannot be accommodated during a checkpoint trip, he can take the previous or the following fixed-route bus. Two buses on the route would furnish a headway of 45 minutes. • Unlike going from a fixed-route service to door-to-door service, the cost to AC Transit will not suddenly jump up. • Dense bus stops are located within the focus area to reduce customers’ walking cost. The operating cost to AC Transit depends only on customer demand density, not on the checkpoint density. • Stop-skipping on the checkpoint run reduces both the riding time for customers and bus running time. • Customers who do not like making reservations still can use the fixed-route trips. Depending on the level of demand incurred in the field during the operational phase of the hybrid checkpoint service, we propose the following follow-up strategy: 1. If the number of passenger requests for each checkpoint bus trip is consistently greater than 12, the service could be converted to fixed-route on all bus trips. This fixed-route would perform well because ABC > 1.5, and the route is easily accessible. 2. If the number of passenger requests for each checkpoint bus trip is consistently less than 6, the service should be converted to checkpoint DRT on all bus trips to reduce travel distance and travel time. This would be closer to a door-to-door service, but sudden increases in passenger demand and agency cost would be avoided. 3. Otherwise, continue the hybrid DRT service that alternates between checkpoint and fixed-route trips.
27
Chapter 4 Schema of Automated Reservation and Dispatching System AC Transit has expressed strong interest in the development of an automated reservation and dispatching system that could be used to deploy the proposed DRT service. In this chapter, we describe the schema of such an information system. The proposed DRT service strategy is designed to enhance the mobility of passengers in the service region and to reduce the AC Transit operating cost. We must minimize the complexity of interactions between passengers and the information system, and between the information system and bus drivers. As such, the service strategy and the associated information system have the following characteristics: • The strategy can accommodate both reservation and walkup passengers; service for anyone is guaranteed to be available during a cycle that contains two bus trips on each direction. • Passengers are picked up and dropped off at designated checkpoints; Bus drivers may skip checkpoints but will always visit them in fixed order. • The reservation and dispatching system is fully automated; no human operators are needed. • Both telephone and web interfaces for scheduling are available; no callback is needed.
4.1
System Components
As shown in Figure 4.1, the reservation and dispatching system consists of five modules, and the communication links between them. The five modules are: telephone interface, web interface, database, scheduling system, and driver interface. The basic reservation and dispatching process is as follows: 1. A customer calls in, or goes to the web site, to make a request. The request specifies a pickup location ID, a dropoff location ID, and desired pickup or dropoff time. 28
Figure 4.1: Components of the Reservation and Dispatching System
29
2. The information system examines the database, runs the scheduling program, and selects bus trips that could fulfill the request at times close to what was requested. This selection is presented to the customer. 3. The customer either picks one bus trip, quits, or makes a new request. If the customer picks a bus trip, the pickup and dropoff locations are recorded in the database. 4. At specified times before each bus trip, the information system communicates the checkpoints to be visited and other relevant information to the driver interface. A reservation system with no cost to customers may be subjected to abuse, e.g. someone may make many reservations without showing up eventually. One solution is, customers are required to purchase tickets with a unique number on each. This purchase can be made at physical locations, or online. An unused ticket number is required to finalize a reservation, and a ticket is only valid for its associated reservation.
4.2
Hardware and Software Requirements
The telephone interface, the web interface, the database, and the scheduling system can be hosted on the same computer, or on different computers. Cost, data security, and ease of communications between different modules need to be considered. The telephone interface allows customers without internet access to make reservations. It requires multiple modem cards on the host computer to handle incoming calls. Commercial call center software can be customized to provide the required functionality. Realtime communication between the call center software and the database is critical. The web interface is easier to use than the telephone interface, and the unit usage cost should be lower as well. Because the functionality of a database is usually standard, and the proposed system is not data-intensive, free open-source database programs such as mySQL can be used. The scheduling system evaluates whether a request could be accommodated by a bus trip. If the answer is yes, it develops tentative routing and furnished estimated pickup and dropoff times. We already implemented a scheduling system in our simulation program. The driver interface can be anything that clearly shows the checkpoints that need to be visited, the routing, and other relevant information (e.g. ticket numbers if a prepaid ticket is required for reservation). The driver interface can be the onboard display that is already installed, or other display units. Information can be exchanged between the database and the driver interface via the onboard communications system, e.g. Orbital, or alternative means such as wireless data service from major cell carriers. Because information needs to be exchanged only once for a bus trip, wireless coverage over the whole service region is not required. Coverage at the trip origins (i.e. Fremont BART and Newpark Mall) is sufficient.
4.3
Supplemental Requirements
The efficient operation of the reservation and dispatching system requires supplemental efforts. Pamphlets need to be distributed to publicize the service, and checkpoints needs 30
to be clearly identified with numbers to facilitate the reservation process. Selling prepaid tickets and requiring them for reservations could thwart reservation abuse. Adopting these measures affects the detailed configuration of the reservation and dispatching system, and launching the new service should be a carefully orchestrated campaign.
4.4
Next Steps
In the coming months, we will evaluate the capabilities and constraints of the information systems previously installed on AC Transit buses, conduct a search of available commercial products that may serve as modules of the reservation and scheduling system, develop detailed specifications of the system, and estimate the system’s cost. We will present the results of our investigations in the final report, as well as to interested agencies. If AC Transit decides to proceed with the DRT pilot program, the Berkeley team will work with them to refine the service strategy, develop a detailed operational plan, deploy the automated reservation and scheduling system, and field measure DRT performance.
31
Bibliography [1] M. Ben-Akiva, P. Macke, and P.S. Hsu. Alternative methods to estimate route level trip tables and expand on-board surveys. Transportation Research Record, 1037:1–11, 1985. [2] L. Bregman. The relaxation method of finding the common point of convex sets and its application to the solution of problems in convex programming. U.S.S.R. Computational Mathematics and Mathematical Physics, 7:200–217, 1967. [3] Carlos Daganzo. An approximate analytic model of many-to-many demand-responsive transportation systems. Transportation Research, 12(4):325–333, 1977. Checkpoint dial-a-ride systems. [4] Carlos Daganzo. 18B(4/5):315–327, 1984.
Transportation Research,
[5] Peter G. Furth and David S. Navick. Bus route o-d matrix generation: Relationship between biproportional and recursive methods. Transportation Research Record, 1338:14–21, 1992. [6] B. Lamond and N.F. Stewart. Bregman’s balancing method. Transportation Research, 15B(4):239–248, 1981. [7] J. Simon and P.G. Furth. Generating a bus route o-d matrix from on-off data. ASCE Journal of Transportion Engineering, 111(6):583–593, 1985. [8] D. M. Stein. An asymptotic, probabilistic analysis of a routing problem. Mathematics of Operations Research, 3(2):89–101, 1978. [9] S. Tsygalnitsky. Simplfied Methods for Transportation Planning. M.S. Thesis, Department of Civil Engineering, Massachusetts Institute of Technology, Cambridge, 1977. [10] N. Wilson, J. Sussman, H. Wong, and B. Higonnet. Scheduling algorithms for a dial-aride system. MIT Urban Systems Laboratory Rep., TR-70-13, 1971. Performance models of flexibly routed [11] Nigel Wilson and Chris Hendrickson. transportation services. Transportation Research, 14B(1):67–78, 1980.
32
Appendix A Characteristic Plots To calculate AOC and ABC for a line, we need boarding and alighting counts at each stop, as well as the distance between adjacent stops. Using these data, we can plot cumulative boardings and alightings along the route. We call this a Characteristic Plot. The horizontal axis is the distance along the line from the line’s origin. The vertical axis is the number of passengers. The upper curve shows cumulative boardings along the line, and the lower curve shows cumulative alightings. At any location along the line, the vertical distance between the two curves is the number of passengers onboard. Dividing the area between the two curves by the length of the line, we obtain AOC. ABC is simply the cumulative number of boardings along the line divided by the length of the line. It is typical that for each line, the ridership patterns in different directions, and during AM and PM peaks, are distinct. We call a time-direction combination a “piece” of a line. Therefore, for a line that runs in two directions (denoted 0 and 1), we produce a Characteristic Plot for each of 4 pieces: AM Direction 0, PM Direction 0, AM Direction 1, and PM Direction 1. For a line that runs circularly without change in direction, we produce a Characteristic Plot for an AM and a PM piece. The plots for all lines that have weekday peak service are included here.
33
Line 210−0 Southbound AM Peak 50
ABC=2.24 pax/mile AOC=8.84 pax
30 20 10 0
ABC=1.13 pax/mile AOC=3.53 pax
40 passengers
40 passengers
Line 210−1 Northbound AM Peak 50
30 20 10
0
5
10 miles
15
0
20
0
Line 210−0 Southbound PM Peak 50
passengers
passengers
15
20
ABC=2.84 pax/mile AOC=10.30 pax
40
30 20 10 0
10 miles
Line 210−1 Northbound PM Peak 50
ABC=1.47 pax/mile AOC=5.24 pax
40
5
30 20 10
0
5
10 miles
15
0
20
0
5
Figure A.1: Characteristic Plots for Line 210
34
10 miles
15
20
Line 211−0 Southbound AM Peak 20
Line 211−1 Northbound AM Peak 20
ABC=2.58 pax/mile AOC=7.09 pax
15 passengers
passengers
15
10
5
0
ABC=1.97 pax/mile AOC=5.21 pax
10
5
0
2
4 miles
6
0
8
0
Line 211−0 Southbound PM Peak 20
ABC=2.67 pax/mile AOC=6.37 pax
6
8
ABC=2.57 pax/mile AOC=7.30 pax
15 passengers
passengers
4 miles
Line 211−1 Northbound PM Peak 20
15
10
5
0
2
10
5
0
2
4 miles
6
0
8
0
2
Figure A.2: Characteristic Plots for Line 211
35
4 miles
6
8
Line 212−0 Southbound AM Peak 30
ABC=1.97 pax/mile AOC=10.66 pax
25 20 15 10 5 0
ABC=1.79 pax/mile AOC=4.02 pax
25 passengers
passengers
Line 212−1 Northbound AM Peak 30
20 15 10 5
0
5
10
0
15
0
5
miles Line 212−0 Southbound PM Peak 30
passengers
passengers
ABC=1.71 pax/mile AOC=8.46 pax
25
20 15 10 5 0
15
Line 212−1 Northbound PM Peak 30
ABC=3.23 pax/mile AOC=7.38 pax
25
10 miles
20 15 10 5
0
5
10
0
15
0
5
miles
10 miles
Figure A.3: Characteristic Plots for Line 212
36
15
Line 213−0 Southbound AM Peak 25
ABC=1.43 pax/mile AOC=4.88 pax
15 10 5 0
ABC=1.15 pax/mile AOC=2.87 pax
20 passengers
20 passengers
Line 213−1 Northbound AM Peak 25
15 10 5
0
2
4
6
8
0
10
0
2
4
miles Line 213−0 Southbound PM Peak 25
passengers
passengers
10
ABC=2.94 pax/mile AOC=8.89 pax
20
15 10 5 0
8
Line 213−1 Northbound PM Peak 25
ABC=1.67 pax/mile AOC=4.76 pax
20
6 miles
15 10 5
0
2
4
6
8
0
10
0
2
4
miles
6 miles
Figure A.4: Characteristic Plots for Line 213
37
8
10
Line 214−0 Northbound AM Peak 25
ABC=1.67 pax/mile AOC=7.44 pax
15 10 5 0
ABC=1.50 pax/mile AOC=6.94 pax
20 passengers
20 passengers
Line 214−1 Southbound AM Peak 25
15 10 5
0
5
10
0
15
0
5
miles Line 214−0 Northbound PM Peak 25
passengers
passengers
ABC=0.90 pax/mile AOC=3.20 pax
20
15 10 5 0
15
Line 214−1 Southbound PM Peak 25
ABC=1.47 pax/mile AOC=5.64 pax
20
10 miles
15 10 5
0
5
10
0
15
0
5
miles
10 miles
Figure A.5: Characteristic Plots for Line 214
38
15
Line 215−0 Southbound AM Peak 20
Line 215−1 Northbound AM Peak 20
ABC=0.78 pax/mile AOC=3.61 pax
15 passengers
passengers
15
10
5
0
ABC=0.60 pax/mile AOC=1.93 pax
10
5
0
5
10 miles
15
0
20
0
Line 215−0 Southbound PM Peak 20
ABC=0.61 pax/mile AOC=2.05 pax
15
20
ABC=1.03 pax/mile AOC=4.69 pax
15 passengers
passengers
10 miles
Line 215−1 Northbound PM Peak 20
15
10
5
0
5
10
5
0
5
10 miles
15
0
20
0
5
Figure A.6: Characteristic Plots for Line 215
39
10 miles
15
20
Line 217−0 Southbound AM Peak 30
ABC=1.60 pax/mile AOC=9.16 pax
25 20 15 10 5 0
ABC=0.99 pax/mile AOC=5.47 pax
25 passengers
passengers
Line 217−1 Northbound AM Peak 30
20 15 10 5
0
5
10 miles
15
0
20
0
Line 217−0 Southbound PM Peak 30
passengers
passengers
15
20
ABC=1.16 pax/mile AOC=6.68 pax
25
20 15 10 5 0
10 miles
Line 217−1 Northbound PM Peak 30
ABC=1.26 pax/mile AOC=5.77 pax
25
5
20 15 10 5
0
5
10 miles
15
0
20
0
5
Figure A.7: Characteristic Plots for Line 217
40
10 miles
15
20
Line 218−0 Southbound AM Peak 20
Line 218−1 Northbound AM Peak 20
ABC=1.71 pax/mile AOC=6.07 pax
15 passengers
passengers
15
10
5
0
ABC=0.72 pax/mile AOC=2.69 pax
10
5
0
2
4
6
8
0
10
0
2
4
miles Line 218−0 Southbound PM Peak 20
ABC=0.60 pax/mile AOC=2.10 pax
10
ABC=0.56 pax/mile AOC=1.92 pax
15 passengers
passengers
8
Line 218−1 Northbound PM Peak 20
15
10
5
0
6 miles
10
5
0
2
4
6
8
0
10
0
2
4
miles
6 miles
Figure A.8: Characteristic Plots for Line 218
41
8
10
Line 219−0 Northbound AM Peak 20
Line 219−1 Southbound AM Peak 20
ABC=0.84 pax/mile AOC=3.53 pax
15 passengers
passengers
15
10
5
0
ABC=1.15 pax/mile AOC=4.29 pax
10
5
0
2
4
6
8
0
10
0
2
4
miles Line 219−0 Northbound PM Peak 20
ABC=1.88 pax/mile AOC=6.61 pax
10
ABC=1.00 pax/mile AOC=3.52 pax
15 passengers
passengers
8
Line 219−1 Southbound PM Peak 20
15
10
5
0
6 miles
10
5
0
2
4
6
8
0
10
0
2
4
miles
6 miles
Figure A.9: Characteristic Plots for Line 219
42
8
10
Line 231−0 Southbound AM Peak 10
ABC=0.85 pax/mile AOC=3.12 pax
6 4 2 0
ABC=0.97 pax/mile AOC=2.88 pax
8 passengers
8 passengers
Line 231−1 Northbound AM Peak 10
6 4 2
0
2
4
6
8
0
10
0
2
4
miles Line 231−0 Southbound PM Peak 10
passengers
passengers
10
ABC=0.33 pax/mile AOC=0.94 pax
8
6 4 2 0
8
Line 231−1 Northbound PM Peak 10
ABC=0.68 pax/mile AOC=2.22 pax
8
6 miles
6 4 2
0
2
4
6
8
0
10
0
2
4
miles
6 miles
Figure A.10: Characteristic Plots for Line 231
43
8
10
Line 232−0 Southbound AM Peak 20
Line 232−1 Northbound AM Peak 20
ABC=0.92 pax/mile AOC=4.81 pax
15 passengers
passengers
15
10
5
0
ABC=0.70 pax/mile AOC=2.40 pax
10
5
0
5
10 miles
15
0
20
0
Line 232−0 Southbound PM Peak 20
ABC=0.96 pax/mile AOC=3.38 pax
15
20
ABC=0.54 pax/mile AOC=3.30 pax
15 passengers
passengers
10 miles
Line 232−1 Northbound PM Peak 20
15
10
5
0
5
10
5
0
5
10 miles
15
0
20
0
5
Figure A.11: Characteristic Plots for Line 232
44
10 miles
15
20
Line 233−0 Northbound AM Peak 10
ABC=0.80 pax/mile AOC=3.21 pax
6 4 2 0
ABC=1.14 pax/mile AOC=4.15 pax
8 passengers
8 passengers
Line 233−1 Southbound AM Peak 10
6 4 2
0
2
4
6
8
0
10
0
2
4
miles Line 233−0 Northbound PM Peak 10
passengers
passengers
10
ABC=1.03 pax/mile AOC=3.70 pax
8
6 4 2 0
8
Line 233−1 Southbound PM Peak 10
ABC=1.08 pax/mile AOC=4.67 pax
8
6 miles
6 4 2
0
2
4
6
8
0
10
0
2
4
miles
6 miles
Figure A.12: Characteristic Plots for Line 233
45
8
10
Line 234−0 Southbound AM Peak
Line 234−1 Northbound AM Peak 15
ABC=0.54 pax/mile AOC=3.84 pax
10
passengers
passengers
15
5
0
0
5
10 miles
15
10
5
0
20
ABC=0.56 pax/mile AOC=2.92 pax
0
Line 234−0 Southbound PM Peak ABC=0.39 pax/mile AOC=1.89 pax
10
5
0
0
5
10 miles
15
10 miles
15
20
Line 234−1 Northbound PM Peak 15
passengers
passengers
15
5
10
5
0
20
ABC=0.68 pax/mile AOC=4.20 pax
0
5
Figure A.13: Characteristic Plots for Line 234
46
10 miles
15
20
Line 235−0001 counter−clockwise AM Peak
Line 235−0001 counter−clockwise PM Peak
20
20 ABC=1.51 pax/mile
ABC=0.92 pax/mile
18
18 AOC=3.27 pax
16
16
14
14
12
12 passengers
passengers
AOC=6.17 pax
10
10
8
8
6
6
4
4
2
2
0
0
2
4
6 miles
8
10
0
12
0
2
4
Figure A.14: Characteristic Plots for Line 235
47
6 miles
8
10
12
Line 258−0001 AM Peak
Line 258−0001 PM Peak
15
15 ABC=0.59 pax/mile
ABC=0.73 pax/mile
AOC=3.04 pax
AOC=3.50 pax
passengers
10
passengers
10
5
0
5
0
5
10 miles
15
0
20
0
5
Figure A.15: Characteristic Plots for Line 258
48
10 miles
15
20


![Transit System Map - Metro [PDF]](https://m.moam.info/img/260x300/transit-system-map-metro-pdf_64799759098a9e9f088b459c.jpg)