Federal Aviation Administration. Atlantic City, New Jersey. Weather displays play an important role in the strategic planning of air traffic flows in the National.
PROCEEDINGS of the MINI-CONFERENCE ON HUMAN FACTORS IN COMPLEX SOCIOTECHNICAL SYSTEMS - 2005
17-1
DESIGN OF A WEATHER DISPLAY FOR TRAFFIC FLOW MANAGEMENT Tanya Yuditsky and Kenneth Allendoerfer Federal Aviation Administration Atlantic City, New Jersey Weather displays play an important role in the strategic planning of air traffic flows in the National Airspace System (NAS). The displays represent complex patterns of data and must be easily interpreted without interfering with other displayed information. This paper describes the evolution of a display for the Collaborative Convective Forecast Product (CCFP). We describe the design challenges, considerations, and constraints that had to be addressed in the final design.
INTRODUCTION Traffic Management Specialists have to integrate different types of information to make smart decisions about the flow of air traffic through the National Airspace System (NAS). The information includes traffic volume and characteristics, airspace and airport capacity, and weather. Because the Specialists work in a very dynamic environment where they have to quickly respond to changes, this information has to be readily accessible and presented in a way that is intuitive. Making complex information easily accessible and intuitive presents various design challenges. There are information requirements that drive the design and factors that constrain it. For example, it may be desirable to have weather, traffic, and airport arrival rates displayed at the same time. Designing a display that presents all of that information unambiguously without increasing the risk of misinterpretation is a challenge. This paper describes the evolution of the display of the Collaborative Convective Forecast Product (CCFP) the Traffic Situation Display (TSD) of the Enhanced Traffic
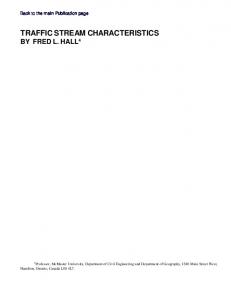
Figure 1. Initial CCFP design and display legend.
Management System. The CCFP presents meteorologists’ predictions of where convective weather might occur. The predictions include level of thunderstorm coverage, rate of growth, height of clouds in the area, and the level of confidence in the forecast. The CCFP is one of the many tools that are displayed on the TSD. INTERFACE DESIGN Initial design CCFP was originally designed for use by meteorologists on screens displaying only weather information and that provide fewer user options. However, as the product matured, CCFP data were added to the TSD. The TSD contains many different types of information, including traffic flows and warnings of high volume areas. In addition, user of the TSD have many options regarding what information is displayed and the colors used to display it. Figure 1 illustrates the initial design of the CCFP on the TSD.
PROCEEDINGS of the MINI-CONFERENCE ON HUMAN FACTORS IN COMPLEX SOCIOTECHNICAL SYSTEMS - 2005
The initial design represented areas of convective weather as colored polygons with color used to indicate the level of coverage. All other data were presented as text in an associated data block. This design had several shortfalls that drove the decision to redesign the display. The biggest problem with the initial design was that the Specialists did not find it to be intuitive. The data that were most useful to the Specialists were level of coverage and level of confidence. Level of coverage was coded with color and should have been available by just viewing the colored polygons. However, the Specialists reported that the color coding was not effective at relaying the information it was designed to represent. There was a concern that depicting a low coverage area as a filled-in, yellow polygon was soliciting an inappropriately conservative response from the Specialists. It is unclear whether this was due to the use of yellow (commonly used to display warning information), the use of a solid fill pattern, or a combination of these factors. Misinterpretation of CCFP data was especially problematic for distinguishing confidence levels. Because the level of confidence information was only available in the text data block, the depiction of the CCFP polygon was the same regardless of confidence, making it less likely that the Specialists would differentiate between confidence levels. The Specialists’ response to a low coverage, low confidence area should not be the same as the response to a low coverage, high confidence area. It was therefore important to use effective coding of level of coverage and to make level of confidence data more available in the display redesign.
17-2
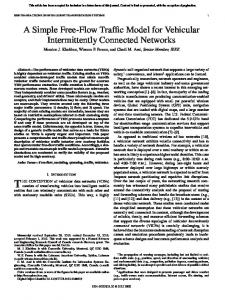
Redesign: Part I The first challenge of the redesign was to display the levels of coverage and confidence graphically. The display had to be intuitive, making it easy for the Specialists to accurately evaluate the impact of the identified areas, and distinct from other elements on the TSD. It was also important to keep the CCFP data from overwhelming the display and distracting the Specialists from other, more critical data. We developed a display that coded levels of coverage with levels of fill and levels of confidence with color. The different combinations of levels of coverage and confidence are presented in Figure 2. We associated level of thunderstorm coverage with level of fill rather than color to provide a more direct relationship between the display and what it represents. Unless using shades of the same color, colors are not typically associated with more, or less of something. Fill patterns, on the other hand, are frequently associated with quantity or density. For example, a sparse fill pattern is perceived as having less (weather, thunderstorms, or coverage) than a solid fill pattern. One important factor to consider when applying any coding strategy is the user’s ability to distinguish between the different levels of the attribute. In the case of fill patterns, we wanted to ensure that the patterns were distinguishable from each other not only when several levels are displayed simultaneously, but, more importantly, when any one level of fill is displayed independently. Without a higher, or lower level of fill available for comparison, will the user be able to accurately identify the level of fill displayed? .
Figure 2. Redesign for a combined display representing two levels of confidence and three levels of coverage.
PROCEEDINGS of the MINI-CONFERENCE ON HUMAN FACTORS IN COMPLEX SOCIOTECHNICAL SYSTEMS - 2005
17-3
Figure 3. A coarse stipple pattern that is effective in large polygons disappears in small polygons. We used three fill patterns to represent the three levels of thunderstorm coverage: an empty polygon for low coverage, a stippled fill pattern for medium coverage, and a solid fill for high coverage. These fill patterns were distinct and very unlikely to be mistaken for each other. The empty polygon was drawn with dashed rather than solid lines to distinguish it from other empty polygons that may be drawn on the TSD. The stippled pattern for medium coverage was designed to meet several important criteria. We used a fine stipple to ensure that the pattern was visible even in a small CCFP area. As Figure 3 illustrates, though a coarse stipple may be perfectly visible in a large polygon, the pattern virtually disappears, or appears like a solid fill if the CCFP polygon is small. We used the colors yellow and orange to represent low and medium levels of confidence because they were already associated with CCFP data in the field, they were distinguishable from each other, and the stereotypical use of yellow to represent a warning and orange to represent a more critical situation was consistent with the meanings of low and medium confidence in the prediction. Section 8.6.2.4.3 of the Human Factors Design Standard (Ahlstrom & Longo, 2003) provides examples of reserved and common meanings for colors. Design Review We developed prototypes of the proposed CCFP design. The prototypes included displays of CCFP polygons representing all possible combinations of coverage and confidence. We used displays that depicted complex convective weather patterns as well as displays that contained only one CCFP polygon to ensure that the Specialists will be able to accurately identify the levels of coverage and confidence when no other levels are displayed for comparison. Finally, we displayed the CCFP polygons against background colors that are commonly used in the field. Specialists have the capability to select map
background colors from a palette of 16 but most often choose black or light tan. We evaluated the redesigned CCFP display with two groups of users. The first group was composed of weather specialists. They found the coding schemes to be intuitive and were able to easily identify the levels of coverage and confidence. Though knowledgeable about weather displays and the interpretation of weather data, this group did not represent the target users. The second group was comprised of Traffic Management Specialists from the field. They reported that the application of color coding to confidence rather than coverage was intuitive but they identified an issue with our choice of colors. Yellow is already used on the TSD to warn the Specialists that a sector may be overloaded. The two different meanings of yellow were inconsistent in the information they represented and in the responses they required from the Specialists. Furthermore, they reported that the colors made the CCFP polygons dominate the TSD and distracted them from other, more critical information. The next challenge of the redesign was to select two colors that met the following criteria: • they should be distinguishable from each other so that the Specialists can easily determine the level of confidence, • they should not be already associated with a particular meaning on the TSD, • they should not be so attention-getting that they distract the Specialists from other, more critical information on the display, and • they should be visible against the commonly used background colors of black and light tan. In addition, it was desirable to have the colors relay an association to higher and lower levels of confidence. Because the CCFP is a weather display, we looked into colors that were already used to draw weather in other systems. The colors we ultimately chose were blue and gray to represent high and medium levels of confidence respectively.
PROCEEDINGS of the MINI-CONFERENCE ON HUMAN FACTORS IN COMPLEX SOCIOTECHNICAL SYSTEMS - 2005
Another problem with the redesign emerged after testing the proposed colors and fill patterns with real, rather than prototyped, convective weather data. When viewing the TSD at range levels that are common in the field, the
17-4
Specialists may be viewing pieces of CCFP polygons. As illustrated in Figure 4, it may become difficult to determine which areas are inside the empty polygons and which areas are outside the polygons.
Figure 4. A sample TSD with CCFP low coverage polygons. To address this potential problem we adjusted the fill patterns to sparse stipple for low coverage, dense stipple for medium coverage, and solid for high coverage. These fill patterns maintained the logical association to levels of coverage and provided an unambiguous representation of the area within a CCFP polygon. We also ensured that the patterns were distinguishable from each other by maximizing the difference between the sparse and dense fill stipple patterns. The dashed line that was needed to differentiate the low coverage areas from other empty polygons on the TSD was no longer needed because there are no objects represented as stipple-filled polygons.
Figure 5. Final redesign of the CCFP.
One design feature that became particularly important with the introduction of the sparse stipple is the polygon border. The sparse stipple presents so little color that there was a concern that the Specialists would have difficulty distinguishing between the blue and gray low coverage polygons. A thick, colored border around the polygon greatly enhanced the perception of the polygon’s color. The resulting combinations of colors and levels of fill are illustrated in Figure 5. As can be seen in this figure, the text data blocks were maintained in the design, and contained all of the available information about the CCFP areas.
PROCEEDINGS of the MINI-CONFERENCE ON HUMAN FACTORS IN COMPLEX SOCIOTECHNICAL SYSTEMS - 2005
DISCUSSION This paper described the evolution of a graphical display for the CCFP. The challenges in the design were due in part to the complex nature of the information being represented, and in part to the already information-rich environment of the TSD. The final CCFP design was deployed to the field in March of 2005 just prior to the severe thunderstorm season.
17-5
REFERENCES Ahlstrom, V. & Longo, K. (2003). Human Factors Design Standard (HF-STD-001). Atlantic City International Airport: Federal Aviation Administration William J. Hughes Technical Center.