Available online at www.sciencedirect.com
ScienceDirect Procedia CIRP 41 (2016) 902 – 907
48th CIRP Conference on MANUFACTURING SYSTEMS - CIRP CMS 2015
Design of acoustical optimized bevel gears using manufacturing simulation Christian Brechera, Christoph Löpenhausa, Peter Knechta,* a
Laboratory for Machine Tools and Production Engineering, Steinbachstraße 19, 52074 Aachen, Germany
* Corresponding author. Tel.: +49-241-80-27969; fax: +49-241-80-22293. E-mail address:
[email protected]
Abstract
The transmission error (TE) is a criterion in the design process for gears, as, beside a sufficient load-carrying capacity and good efficiency, noise performance is an important customer demand. For the micro geometry design, the tooth contact analysis (TCA) including the simulation of the manufacturing process for the flank topography is necessary. The objective of this paper is to show potential for the optimization of face-milled bevel gears. Therefore, the FEbased TCA program ZaKo3D was developed. The potential for the acoustic optimization of ground bevel gears in terms of tonality reduction is discussed. Hence, the TCA is performed with a complete tooth hunting, in order to consider all individual flanks of the gear set. Finally, the different topography distributions for a ground design will be discussed in order to understand the optimization potential for a tonality reduction by imitating the lapped topography characteristic. © 2015 2015 The The Authors. Authors. Published Published by by Elsevier © Elsevier B.V. B.V. This is an open access article under the CC BY-NC-ND license Peer-review under responsibility of the Scientific Committee of 48th CIRP Conference on MANUFACTURING SYSTEMS - CIRP CMS (http://creativecommons.org/licenses/by-nc-nd/4.0/). 2015. Peer-review under responsibility of the scientific committee of 48th CIRP Conference on MANUFACTURING SYSTEMS - CIRP CMS 2015 Keywords: Machining; Bevel gear; Tooth contact analysis; Noise; Simulation; Performance optimization
1. Introduction Due to an increasing competition in global markets, production costs need to be decreased constantly at an earlier stage in the design process. The bevel gear is the main functional component in a rear axle. Therefore, a good functionality in terms of excitation behavior and load carrying capacity is required. In the design process, one major criterion for the evaluation of the contact conditions of a gear set regarding the excitation behavior is the TE. The excitation behavior of gears is decisively influenced by the modifications of the micro geometry. In particular, higher modification amounts are stated for bevel gears in order to prevent a shift of the contact zone towards the edges of the active flank area due to load dependent displacements of the gear set. The selection of the desired micro geometry for optimized behavior for a torque range is the challenge in the bevel gear design.
Generally, the TE is dominated by the first gear mesh order in the frequency spectrum distribution. Ground bevel gears, however, show in general a tonal order distribution, with pronounced tooth mesh frequencies with their higher harmonics and side bands phenomena. This is mainly due to the high reproducibility of the grinding process. In contrast, the material removal in the lapping process is of a small amount. Therefore, good qualities in the soft machining process combined with low distortions in the heat treatment process are necessary. The frequency spectrum of a lapped gear set show a lower tonality in comparison to ground gears and in general a higher basic noise emission level. The finite element (FE) based tooth contact analysis is a program for the design and analysis of gears. Therefore, a precise knowledge of the gear geometry is necessary. For the determination of the complex bevel gear geometry, manufacturing simulations are used.
2212-8271 © 2015 The Authors. Published by Elsevier B.V. This is an open access article under the CC BY-NC-ND license (http://creativecommons.org/licenses/by-nc-nd/4.0/). Peer-review under responsibility of the scientific committee of 48th CIRP Conference on MANUFACTURING SYSTEMS - CIRP CMS 2015 doi:10.1016/j.procir.2015.12.103
903
Christian Brecher et al. / Procedia CIRP 41 (2016) 902 – 907 Manufacturing of blanks
Nomenclature
Machining of the basic body
φ a a0 cα cβ cv d2,e fz fHα fHβ fsample F mn M n p ptp TE z
rotation angle hypoid offset reference value acceleration profile crowning lead crowning flank twist outer gear diameter gear mesh frequency profile angle deviation lead angle deviation sample frequency force normal module torque rotational speed pitch peak-to-peak transmission error number of teeth
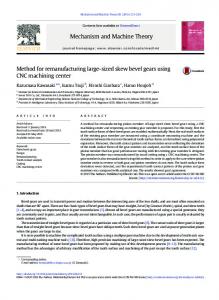
2. State of art 2.1. Bevel gear manufacturing The geometry of the teeth of spiral bevel gears is mainly influenced by the choice of the soft-machining process. Thereby, restrictions for the following hard finishing process are given. The main manufacturing process for spiral bevel gears are the cutter head processes. The differentiation of the two processes, face milling and face hobbing, is justified by different process kinematics and defines as well the succeeding hard finishing process. In Fig. 1 the manufacturing chains for cut spiral bevel gears is shown. The major manufacturing steps are the machining of the blanks, the rough machining, the heat treatment and the hard finishing process. The face milling process is a single indexing process in which the work piece is standing still and the rotating cutter head mills a circular arc shaped tooth slot. The circular arc allows a grinding process with a cup grinding wheel as the hard finishing process. The tooth height is conical and the tooth gap is constant. The continuous face hobbing process provides a coupled rotational movement between work piece and cutter head. The coupling of the relative movement ensures that one group of cutting blades is lead through the tooth gap. The indexing is performed continuously for all gaps in the same time. The resulting tooth form in lead direction is a section of an extended epicycloid. The generation parameters of the epicycloid are determined by the ratio of number of teeth to the number of threads which corresponds to the ratio of base circle to roll circle of the epicycloid. The resulting lead form of the flanks makes a lapping process for the hard fine machining necessary. [1].
Rough machining
Rough machining
Face hobbing
Face milling
(Continuous indexing)
(Single indexing)
Heat treatment Thermal hardening process
Thermochemical methods
Hard fine machining
Hard fine machining
Lapping
Grinding
(Hard shaping)
(Lapping)
Finished gear set Picture source: Klingelnberg
Fig. 1. Manufacturing chain for bevel gears
The grinding process for bevel gears provides a high reproducibility of the flank form and distortions of the heat treatment process can get compensated accordingly. The lapping process, however, allows only a small removal amount and may lead to a higher scatter in the topography of the gears. 2.2. Simulation of bevel gears The tooth contact analysis is a tool not only for the design of gears but also for the analysis of the contact conditions. In Fig. 2 is the general approach for the simulation of the operational behavior as basis for the optimization of gears shown. The approach is divided in three steps; manufacturing simulation, gear set modelling and tooth contact analysis. For both, the gear set design and analysis, a precise gear geometry is necessary. Therefore, the kinematics of the tool machine are programed in the manufacturing simulation. Additionally, the set-up of the cutter head including the shape of the cutting blades and the geometry of the blank of the work piece are considered [2]. The tooth gap geometry is derived by a penetration calculation or by solving the law of gearing for generated gears. As a result of the manufacturing simulation, the gap geometry is given by a point cloud with a discrete resolution. For the simulation of the gear set at loaded conditions, a meshed FE-model needs to get generated. At the WZL, a generator for various gear geometries got developed and is used for the modeling. Instead of a complete gear, only a segment with a few teeth is considered. The cut surfaces of the gear segment are constraint. As a last step of the gear modeling for the FE-based tooth contact analysis, influence matrices are calculated. Hereby, unit forces of 1 N are applied in all three dimensions on each node of the active flank area and the resulting displacements of the nodes of the FE-model are saved in the influence matrices. The resulting deformation of the gear model is derived by superposition of various deformation shares. The influence matrices are determined for one macro geometry but are also valid for micro geometry variants as long as the geometrical deviations are small compared to the macro geometry [3].
Christian Brecher et al. / Procedia CIRP 41 (2016) 902 – 907
Virtual tool machine
Gear set model
Tooth contact analysis
FE-Modeling
Tolerance fields
M2 = 20 Nm (Drive) n1 = 60 min-1 Nominal position Simulation parameter
Tooth gap geometry
Variation of tooth flank
hexahedron elements
shape, gear set position
Influence matrix calc.
Analysis of operat. Beh.
Data Data Data ..
Tooth flanks with root
geometry
Flank resolution 101x39 90 positions per pitch Contact Pattern SFT
and tool geometry
FE-Meshing with
ZaKo3D
Displacement values for
Noise, load-carrying
loading with unit load
capacity, efficiency
TCA
Kinematics, work piece
60
Test parameter Transmission error (ptp) [µrad]
Manufacturing simulation
Single flank test
Averag. topography
50
1. fz
40 30
2. fz
20 10 0 60
Averag. topography with pitch deviation
Transmission error (ptp) [µrad]
904
All-teeth topography with pitch deviation
50 40 30 20 10 0
1
2 3 4 5 6 Gear mesh order [ ]
7
1
2 3 4 5 6 Gear mesh order [ ]
7
Fig. 2. Manufacturing simulation and tooth contact analysis
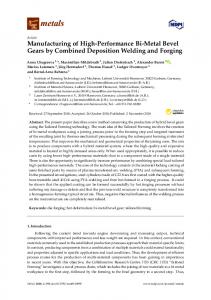
Fig. 4. Comparison of measured and simulated transmission errors
Finally, the analysis of the gear set in the tooth contact analysis can be performed. Especially, bevel gears are sensitive to position deviations [4]. As tolerances occur in the manufacturing processes and as well in the assembly process, it is necessary to consider the position and flank tolerance fields in the tooth contact analysis. Thereby, it is possible to generate a robust gear design [5].
Subsequently, the pitch error and the topography of all the teeth of the gear set were measured with a grid resolution of 101x39 on a topography measurement machine as input data for the simulation in ZaKo3D. For the verification of the gear set position, the contact pattern from the bevel gear tester is compared with the simulated contact pattern and show a good agreement (Fig. 4 bottom left). In the following, the tooth contact analysis is performed. At first, the averaged topography of the gear set is simulated. As each pitch is identical, the spectrum in the top right diagram shows only the gear mesh order and their higher harmonics. Furthermore, the amplitudes have higher values than in the measurement. The amplitudes get reduced by the consideration of the pitch error and the background noise of the spectrum rises, but especially the amplitudes of the gear mesh orders are still too high. Only with consideration of the topography of all teeth a good correlation for the amplitude of the first and second gear mesh order is derived. The background noise is increased again and the gear mesh amplitudes are lowered. In particular, the amplitude of the first gear mesh order is meeting at the point. The results of the study show, on the one hand, that if the gear set show a topography scatter, it is necessary to consider the topography of all teeth, in order to receive a good agreement with the measurement. On the other hand, the results can be interpreted as an optimization potential for the optimization of the excitation behavior. By applying an intentional scatter of the topography a reduction of the amplitudes of the gear mesh orders can be achieved.
3. Analysis of excitation behavior of bevel gears For the analysis of the excitation and load-carrying capacity of gear, numerical methods based on the FE are applied. At the WZL, since several years, the tooth contact analysis ZaKo3D is developed and validated in various tests [6]. ZaKo3D allows the detailed investigation of gear sets not only for one pitch, but for a complete tooth hunt. Thereby, the measured topographies of all teeth and the influence of pitch errors can be simulated. The output data consists of ease-off, contact pattern, TE graphs and frequency distributions, flank pressure and tooth root stresses [3]. Fig. 3 displays various input parameters and the output data. Fig. 4 shows the measured TE and the simulation of the TE at different levels of detail. In the study, at first, a bevel gear set with no hypoid offset was investigated on a bevel gear tester at low torque of 20 Nm at 60 min-1. The results in the upper left diagram show the order spectra of the measured TE. Here, a pronounced first (1. fz) and second gear mesh order (2. fz) can be identified. Furthermore, frequency shares in between the gear mesh orders can be noticed, with the highest amplitudes up to the first gear mesh order.
4. Design of bevel gear set with topography scatter Input
Flank topography
Flankentopografie Pitch variation
Axial position variation
Fp
fa
fSb Pitch
fSs
e
ZaKo3D Output
Ease-off
Contact pattern, Transmission error single and multiple graphs tooth mesh
Contact geometries
Fourier spectrum
NVH properties
Fig. 3. Topography and measurements of an ideal gear
Flank pressure, tooth root stresses
Load capacity
Hence, the optimization is applied on an exemplary automotive gear set with a hypoid offset (Fig. 5). The gear set is milled in the single indexing process and ground afterwards. The TE is investigated in ZaKo3D and is simulated with 30 positions per pitch. The load-free TE of the ideal ease-off geometry is shown in Fig. 5 (bottom).
905
Simulation parameter
z1/z2
= 11/46
Mesh resolution 25x39
a
= 35 mm
Pitch position 30
d2,e
= 215 mm
Pitches
mn
= 3.61 mm
Output torque 50…850 Nm
I=1,Pe0 I=1,Pe40 I=1,Pe80 I=5,Pe10 I=5,Pe40 I=5,Pe80 Erwatungse
1 0 0 1 0 1 0 352 1
0.1 0.01
0 5 10 15 20 25
Gear mesh orders [μrad] 6 5 4 3 2 1
0.39 0.48 0.57 1.09 2.44 9.88
Pinion
Ring gear
Cα
±1μm
0
Cβ
±1μm
0
FHα
±0.01°
±0.01°
FHβ
±0.01°
±0.01°
Cv
±0.01°
0
Stochastic distribution
Fig. 5. Presentation of gear set
10
TE (ptp)[μrad]
Flank resolution 25x39
Transmission error [μrad]
Micro geometry dev.
30 pitch position
1
Micro geometry deviation
Calculation parameters Quasi-static FE-based tooth contact analysis
506
10
TE (ptp) [μrad]
EaseOff
Gear set parameters
Reference variant
Christian Brecher et al. / Procedia CIRP 41 (2016) 902 – 907
1 0.1
1
2 3 Gear mesh order [ ]
4
0.01 5
Fig. 7. Frequency spectra of the quasistatic loaded TE
Mesh resolution 25x39 Pitch position 30 Erwatungse
I=5,Pe80
I=5,Pe40
I=5,Pe10
I=1,Pe80
I=1,Pe40
I=1,Pe0
506 1 0 0 1 0 1 0 352 1
Pitches
Output torque 50…850 Nm
20 16
TE (ptp) [μrad]
Simulation parameter
Reference variant
For the calculation study, two gear variants are analyzed; the reference variant (Fig. 5) and one variant where the ideal geometry is superimposed with a micro geometry scatter. The topography deviations are stochastically distributed and shown in Fig. 6 right bottom. The values are derived from deviations that occur in lapping processes, but can also be manufactured in a grinding process. In order to analyze the effect of the topography it is necessary to simulate 506 pitches for one tooth hunt. The diagrams on the right side of Fig. 6 show that the amplitudes of the gear mesh order are decreased for the complete torque range. Thereby, the effect that was observed in the simulation of Fig. 4 can be confirmed. In order to understand the frequency distribution and the effect of the topography scatter of the background noise the logarithmic diagram of the TE is shown in Fig. 7. It is clearly noticeable that the amplitude reduction is accompanied by the increase of the background noise. Especially, the frequency range until the first gear mesh frequency is emphasized with amplitudes higher than 1 µrad. For higher frequencies, the background noise is constantly decreasing with values lower 0.1 µrad. From the evaluation of the quasistatic TE, it can be stated that the variant with the micro geometry scatter has decreased amplitudes of the gear mesh order and the higher harmonics with an increased background noise.
12 8
4 0 20
Ring gear
Cα
±1μm
0
Cβ
±1μm
0
FHα
±0.01°
±0.01°
FHβ
±0.01°
±0.01°
Cv
±0.01°
0
Stochastic distribution
Legend M2 = 50 Nm M2 = 200 Nm M2 = 425 Nm M2 = 850 Nm
TE (ptp)[μrad]
Pinion
Micro geometry dev.
Micro geometry deviation
16
12 8 4
46
92 138 Order reg. Output [ ]
184
Fig. 6. Amplitudes of the tooth mesh frequencies for the quasistatic TE
0
5. Simulation of the dynamic excitation behavior For the further analysis, the impact of the decreased gear mesh excitation and the increased background noise is analyzed in a dynamic simulation. The noise emission of a gear set depends on the interaction between tooth mesh and structure behavior of the drive train. The eigenfrequencies of a structure are constant while the excitation frequencies of the gear set are rising with increasing speed. When the gear mesh frequency meets the eigenfrequencies it may lead to a dynamic elevation of the load. For the simulation of the dynamic excitation behavior, a procedure for considering the exciting gear mesh forces in the dynamic simulation got developed at WZL. The method is implemented in a data field based force coupling element [7, 8]. The basis is given by the manufacturing simulation and the definition of the gear set macro and micro geometry. In the next step, the TE of the gear set under changing operational conditions for one tooth hunt is determined. The results of the simulation are saved in the three dimensional data field depending on the torque respectively the tooth normal force and the pitch position. Subsequently, a torsional oscillator model of a test fixture set-up for input and output of the drive train is modeled and connected via the data field based force coupling element. Hereby, only the rotational degree of freedom is focused. The force coupling element uses afterwards the kinematic state variables angular position and rotational speed of the gears and calculates with the data fields the reaction forces at the pinion and the gear. They are subdivided according to the equations of motion in the tooth spring force and the damping force. Fig. 8 shows the mechanical model of the tooth mesh of a bevel gear set. Firstly, the summed TE is determined. With the angular position of the gears, the corresponding load-free TE can be subtracted from the summed TE. The result is the load depending TE share which is caused by the load depending deformation of the gear set. Finally, by use of the data field from the tooth contact analysis, the tooth normal force can be calculated.
= 35 mm
d2,e
= 215 mm
mn
= 3,61 mm
FZf = (Fx, Fy, Fz) MZf = (Mx, My, Mz) Spring behavior φP
Pinion
i
+ FR + MR
damping
. p-Position Unloaded φP TE i
= 215 mm
mn
= 3,61 mm
I=1,Pe40 I=1,Pe80 I=5,Pe10 I=5,Pe40 I=5,Pe80 Erwatungse
1 0 0 1 0 1 0 352 1
2,0
1,5 1,0 0,5 0 2,5
n. 1
= 0 … 5000 min-1
n1
= 100
min-1/s
fsample = 48 kHz
a0
= 10-5 m/s2
Legend 80 L/dB(A) [m/s²]160
Frequency [kHz]
= 425 Nm
Micro geometry dev.
Simulation parameter M2
= 100 min-1/s
fsample
= 48 kHz =
10-5
m/s2
2,0 1,5
1,0 0,5
0
1000
2000 3000 Input RPM [min-1]
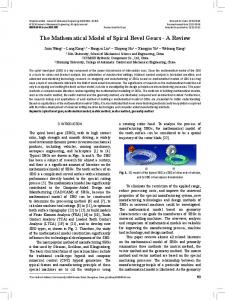
Fig. 9. Frequency spectrum of the angular acceleration^
110
90 70 50 150 130 110 90 70 50 1
2
3
4
5
6
7
8
9
10
Fig. 10. Averaged order spectrum
Frequency [kHz]
d2,e
Reference variant
= 35 mm I=1,Pe0
a
= 0 … 5000 min-1
n1
130
Tooth meshing order [ ]
2,5
= 11/46
n1
FD = (Fx, Fy, Fz) MD = (Mx, My, Mz)
In the following, a speed ramp on a virtual test rig is performed with a constant output torque of 425 Nm and a speed gradient of 100 min-1/s from 0 to 5000 rpm. The evaluation of the excitation behavior is accomplished with the rotary differential acceleration. Fig. 9 shows the results of the speed ramps for both micro geometry variants. It is noticeable that the upper diagram of the reference ground variant shows a tonal noise spectrum with a pronounced tooth mesh frequency and their higher harmonics. Furthermore, it can be stated that even if amplitudes in the TE spectrum are below 0.1 µrad, they are clearly seen in the dynamic spectrum. The bottom diagram with the micro geometry deviation provides a different picture. The spectrum of the dynamic differential acceleration provides a higher background noise level which is caused by the higher noise level of the TE spectrum. But, nevertheless, the amplitudes of the gear mesh frequencies are reduced and, by that, the tonality as well. Fig. 10 confirms the tonal excitation of the reference gear set and the noise reduction for the variant with the micro geometry scatter by presenting the averaged order spectra. The reference gear set show the pronounced gear mesh orders in contrast to the background noise. The level values for the first three gear mesh orders are above 130 dB(A) and are then decreasing constantly down to 110 dB(A) for the 10th order. The averaged spectrum of the second variant with the micro geometry scatter, however, shows a less distinctive characteristic of the gear mesh orders which is affected by the increased background noise. Nevertheless, especially starting from the 3rd gear mesh order the level values are decreased in comparison to the reference variant by 10 dB(A). z1/z2
= 425 Nm
a0
Fig. 8. Mechanical model for the tooth meshing
Gear set data
M2
.
Forces and torques
– +
Simulation parameter Micro geometry deviation
Nominal pos.
I=1,Pe40
Pitch and concentric deviation
Diff. rot. acc. [dB(A)]
a
150
Diff. rot. acc. [dB(A)]
Topography of all teeth
I=1,Pe0
= 11/46
I=1,Pe80
+ –
z1/z2
I=5,Pe10
Current pos.
Loaded TE + –
Gear set data
Load depended displacement
I=5,Pe40
Ring gear
Total TE
Influence factors
I=5,Pe80
φG
Erwatungse
. φG
Reference variant
Christian Brecher et al. / Procedia CIRP 41 (2016) 902 – 907
1 0 0 1 0 1 0 352 1
906
4000
5000
0
6. Summary The excitation behavior of a gear set is a fundamental quality criterion which needs to be considered in the design process. Therefore, manufacturing simulation programs and tooth contact analysis programs are used for the evaluation of the operational behavior. Usually, different micro geometry designs are simulated within the tooth contact analysis in order to define the compromise between a sufficient loadcarrying capacity and an acceptable noise behavior. The key value for the excitation behavior is the TE of a gear set. The comparison of the measured and the simulated TE showed that the FE-based tooth contact analysis ZaKo3D is capable of giving a good agreement between simulations and testing. The requirement is that the scatter of the topography is known and, if necessary, considered in the simulation. The comparison of the simulation with the averaged topography and the simulation with the consideration of all teeth showed difference of more than 50 %. Additionally, the results lead to the concept that by applying a targeted topography scatter, it is possible to reduce the TE respectively the excitation level. Therefore, the method is applied for an exemplary gear set. Two variants are investigated; a ground target topography is calculated and as well a variant with a scatter in the topography deviations. The topography scatter is derived from a possible lapping process, but can be also applied on purpose in the grinding process. By applying the micro geometry scatter from tooth to tooth, the results of the TE calculation show that the amplitudes of the tooth mesh frequencies decrease. In parallel, the amplitudes of the frequencies in between the tooth mesh frequencies are rising. The TE of the ground reference shows a tonal distribution. Furthermore, the dynamic excitation behavior is analyzed. For the simulation of the dynamic excitation behavior, a method is being developed that considers the exciting forces that are caused by the tooth mesh. This method is realized in the data field based force coupling element. Therefore, stiffness data fields based on the TE simulations are calculated. In the next step, speed ramp simulations are performed. Here, the tonal characteristic of the ground variant is even more amplified, where the tooth mesh up to the tenth order are dominant in the averaged order spectrum while there is almost no background noise level. On the contrary, the
Christian Brecher et al. / Procedia CIRP 41 (2016) 902 – 907
averaged order spectrum of the variant with the topography scatter shows a increased background noise but the tooth mesh orders are clearly reduced. The results of the speed ramp simulations show that by applying a scatter of the topography on the flank, the amplitudes of the TE can be reduced. Acknowledgements The investigations described in the present paper were conducted as a part of the project sponsored by the WZL Gear Research Circle. References [1] Stadtfeld HJ: Gleason Kegelradtechnologie – Ingenieurwissenschaftliche Grundlagen und modernste Herstellungsverfahren für Winkelgetriebe. expert Verlag, Renningen, 2013 [2] Klingelnberg J (Hrsg.): Kegelräder. Grundlagen und Anwendungen. Springer-Verlag, Berlin, Heidelberg, 2008
[3] Hemmelmann J: Simulation des lastfreien und belasteten Zahneingriffs zur Analyse der Drehübertragung von Zahnradgetrieben. Diss. RWTH Aachen, 2007 [4] Simon V: Influence of tooth errors and misalignments on tooth contact in spiral bevel gears. In: Mechanism and Machine Theory. Volume 43, 2008, page 1253–1267 [5] Brecher C, Brumm M, Knecht P: Improvement of the Excitation Behavior of Bevel Gears considering Tolerance Fields caused by Manufacturing and Assembly Processes. 1. International Gear Conference, Lyon (France), 2014. [6] Brecher C, Brumm M, Henser J, Knecht P: Validierung der allgemeinen, FE-basierten Zahnkontaktanalyse. 4. Kongress zu Einsatz und Validierung von Simulationsmethoden für die Antriebstechnik (SIMPEP), 2014 [7] Gacka A: Entwicklung einer Methode zur Abbildung der dynamischen Zahneingriffsverhältnisse von Stirn- und Kegelradsätzen. Diss. RWTH Aachen, 2013 [8] Carl C: Gehörbezogene Analyse und Synthese der vibroakustischen Geräuschanregung von Verzahnungen. Diss. RWTH Aachen, 2014
907