Relays and Protective Systems Using Advanced Testing Tools. Mladen Kezunovic ... given design, and potential application of novel protection principles would ...
Design Optimization and Performance Evaluation of the Relaying Algorithms, Relays and Protective Systems Using Advanced Testing Tools Mladen Kezunovic
Bogdan Kasztenny
Fellow, IEEE
Senior Member, IEEE Texas A&M University College Station, TX 77843-3128
Abstract—This paper defines underlying performance quality measures for designing, optimizing, setting and evaluating the protective relaying algorithms and equipment. The paper starts with evaluation of digital measuring algorithms, and gradually introduces the performance indices for the operating principles, relays and protection systems. Multi-objective formal ranking methods based on fuzzy set theory are used to combine diverse measures into composite performance indices enabling evaluating and optimizing various functions of protective equipment. Keywords: protective relaying, multi-objective evaluation, fuzzy sets and logic, testing.
I. INTRODUCTION Operation of modern power systems highly depends on the performance of installed protective devices. Important performance indicators include security (no false trippings), dependability (no missing operations) and availability (percentage operational time of the equipment in the considered time period). Those performance indices have been precisely defined [1,2]. They, however, evaluate the overall performance of a complete relay or a protection system without testing particular components (measuring algorithms, operating principles, internal settings, auxiliary functions such as transient monitors, etc.) because the information about the components is typically not available. Thus, the complete relay or protection system are evaluated in the combined manner. Such a global approach does not enable one to pinpoint the causes of relay malfunctioning, and consequently, optimize the design and settings. From the utility perspective, a variety of protective relays may be evaluated. This includes different operating principles and different designs within a given operating principle. In addition, modern digital protective relays enable the user to modify their logic and other functions extending significantly the meaning of the term "settings". All this calls for advanced methods for relay evaluating, setting and testing. From the vendor perspective, switching to the new hardware platforms, frequent modifications of the software of a given design, and potential application of novel protection principles would also require multi-objective evaluation and
optimization tools. Nowadays, optimization from the vendor perspective is usually performed using heuristic methods and preferences of a development team since the choices are limited by the applied front-end Digital Signal Processor (DSP) and its software, solutions adopted in the previous versions of the same relay or similar relays, etc. The primary goal of this paper is to indicate the mean for formal multi-criteria performance evaluation of protection systems. This paper is organized as follows. Section II introduces different levels of evaluation and optimization; section III defines performance indices for digital measuring algorithms (both dynamics and filtering properties); section VI addresses evaluation of operating principles; section V proposes formal measures to evaluate complete relays and protection systems. II. LEVELS OF EVALUATION AND OPTIMIZATION Commonly, the term "evaluation" is taken to mean exclusively "testing". The results of testing assume the form of numerous characteristics that define the response of the tested relay under variety of conditions. There are no commonly accepted methods for aggregating diverse performance characteristics nor performance measures. This paper presents several algorithms for quantitative evaluation of protection systems, individual relays, and functions of the relays. The evaluation is performed in such a way that the compared devices or design alternatives are graded by numerical weights on a formal scale. Three evaluation and optimization levels are distinguished in the paper: · Function level evaluates and optimizes measuring algorithms and simple relaying functions i.e. elements of a relay that do not assert directly the tripping signal but provide certain information to support the tripping decision. They include such functions as harmonic restraint, directional element, power swing blocking element, etc. · Relay level evaluates and optimizes complete relays such as differential relay, impedance relay, or overcurrent relay, i.e. elements that are capable of asserting the tripping command. · System level evaluates and optimizes complete protection systems consisting of several relays such as the relaying schemes for transmission lines. Evaluation proposed in this paper relies on two steps. First, for each of the aforementioned levels, a number of performance indices have been proposed that define - in a numerical way - the "goodness" of a given element. In the presented approach, a protection device or design is segmented for the purpose of evaluation. Each level is evaluated individually enabling optimizing the design or evaluating the product. In evaluating complex systems such as protective relays one faces two problems. Firstly, the evaluation has many di-
mensions. For example, a measuring algorithm will be evaluated paying attention to its speed, overshoots, steady state errors, gain for the d.c. component, etc. Those dimensions, if reflected by numerical indices, have different meaning, different units and are not equally important. This calls for methods of multi-objective analysis. Secondly, certain uncertainty is inherent in the evaluation process. The performance indices as dependent upon the used collection of testing cases are to certain extent random. The evaluation terms such as "fast algorithm", "small overshoot" or "reliable principle" are imprecise or fuzzy. In order to deal with both randomness of certain performance indices and fuzziness of evaluation terms one has a choice of using fuzzy set theory [3] and/or statistical methods such as Markov models [4] for evaluating various elements of a protection system. Taking the above into account, multi-objective decisionmaking procedures based on the fuzzy set theory are adapted in this paper to assign weights for different quality indices of a given function, relay, and eventually, protection system; while probability density functions are proposed for numerical indices that display certain randomness. III. EVALUATING MEASURING ALGORITHMS A. Evaluating the Time Response
y ymax ya y oo
y0
t t1max
t2%
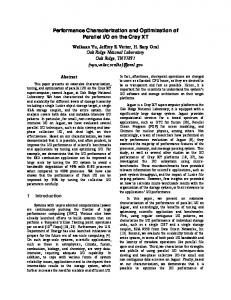
Fig.1. Parameters of the generalized time response.
The above characteristics are defined for a measuring algorithm of a scalar criteria signal. For vector criteria signals (the impedance, primarily), similar definitions may be stated in a multi-dimensional space. Or, each component of the vector criteria signal (resistance and reactance, for example) may be evaluated separately. Another way of evaluating the time response of a measuring algorithm, useful for both scalar and vector criteria signals, is to use the mean error between the measured quantity and the ideal time response. This way allows aggregation of the indices such as the overshoot and the settling time into a single value. The sample indices of this kind follow (Fig.2): · Normalized mean-square-error index:
A measuring algorithm for protective relaying purposes should trace a given feature of a signal (such as magnitude, for example) and should reflect the current value of this feature regardless of the changes and various components present in the signal. Typically, the feature of the signal measured 2 by the algorithm and serving as a criteria signal for certain L+ M 1 operating principle changes rapidly due to faults in the power emse = y( k ) - y a (3) M × � y¥ - y0 � k = L system as illustrated in Fig.1. Due to the well known trade-off between the speed and accuracy of measurement, the time responses of the ideal and a practical measuring algorithms dif- where: M is a considered number of post-fault samples, fer (Fig.2). The latter can be characterized for the evaluation ya is the ideal (accurate) time response, and optimization purposes using the following concepts: L is a sample number as explained below. · Settling time, t2% (or t5% ), is a time in which the meas- The index (3) is computed in the window of M samples startured value reaches its steady state value with the accuracy ing from the L-th sample [5]. The value of L should be seof 2% (or 5%, respectively). This time reflects the reac- lected to reflect the fact that some relaying algorithms use tion time of a relaying function which uses a given criteria transient monitors to postpone tripping. In such a case, the accuracy of measurement in the period before the transient signal with the setting closed to the measured value. monitor unlocks the relay, is not important. However, in order · Time to the first maximum, t1max, reflects the reaction time of a relaying function which uses a given criteria sig- to evaluate a measuring algorithm without the transient monitor, one should assume L = 1. nal with the setting much lower than the measured value. · Normalized absolute error index: · Overshoot, Dy%, defined as (Fig.1):
å�
y%
D
=
ymax - y¥ × 100% y¥
(1)
eabs
reflects, to certain extent, the security of the related relaying function (false trippings due to overestimation of the criteria signal). · Steady-state percentage error, De% defined as (Fig.1):
·
=
1 M × � y¥
�
L+ M -
å y( k )
y0 � k = L
-
ya
(4)
Normalized logarithmic error index: y
actual response ideal response
ya
e%
D
=
ya
-
y¥
y¥
×
100%
(2)
where ya is the actual (accurate) steady-state value of the estimated quantity. The shorter the settling time and the time to the first maximum, the smaller the overshoot and the steady state error, the better the measuring algorithm.
accumulated differences
k M
Fig.2. Illustration of the aggregated indices.
elog
=
1 M × � y¥
L+M
-
å � y � =
log y( k )
0
-
ya
k L
�
(5)
The logarithmic error is adequate for signals that change significantly between the pre-fault and fault conditions (such as the impedance). The indices (3)-(5) suit well the vector-type signals. For example, the index (5) can be re-written for impedance as follows: elog
=
L+M
1 M × Z¥
-
Z0
å log�Z (k )
k =L
-
Za
�
F
=
� f2
1 -
f2
f1 �
ò FRideal ( f )
-
FRactual ( f ) df
(7)
f1
where: FR stands for the frequency response, while f2 and f1 specify the considered frequency interval. For a given measuring algorithm, the integral (7) can be computed numerically. Certainly, the smaller F, the better the algorithm in terms of its filtering properties. C. Aggregating Diverse Performance Indices
(6)
where | | stands for the magnitude of a complex number. In the control theory, from which the above definitions originate, the characteristics (1)-(6) are determined under the step change of an input signal. In protective relaying, there are various patterns possible for a given input signal in a given application. In order to evaluate the time response of a given algorithm under variety of operating conditions one needs to use a collection of input signals reflecting typical waveforms of an input signal. Those waveforms can be called exposures after [1] and may be determined by assuming particular analytical signal model and distributing parameters of this model. Those signals may also be obtained by means of digital simulation using a model of a certain portion of the power system. The problem of adequate input signals for testing of a given algorithm, relaying function, relay or protection system is a separate issue and will be addressed in section IV.A. We will assume here that one has the set of adequate signals collected. All those signals can be applied to the measuring algorithm being tested and the selected indices can be collected for each exposure. The values can be then processed statistically delivering useful information about the maximum, minimum and average values as well as the statistical distribution of a given index. Fig.3 presents a sample probability density function for the 2% settling time of the fullcycle Fourier algorithm. The considered input signals were corrupted with the noise, decaying high frequency nonharmonic components, harmonics and the decaying d.c. component. The average settling time is about 19 ms, the minimum value is certainly 16.6 ms while the maximum value statistically does not exceed about 25 ms.
When using several performance indices for evaluating a given algorithm, one often obtains contradictory recommendations from particular indices. This results from natural trade-offs inherent in the measuring algorithms. For example, an algorithm having short settling time will probably display large overshoots and poor frequency response. In addition, different indices assume different values (percentages, time, etc.) resulting in difficulties in the overall evaluation of the algorithm. Multi-objective ranking methods using the fuzzy sets theory provide a number of formal tools for calculating the composite index for ranking various alternatives using a number of objectives [3]. Typically, the steps to be followed in the multi-objective ranking are as follows [3]: 1. Select the objectives, i.e. the ranking criteria. In the case presented in this paper, the example criteria are "short settling time", "short time to the first maximum", "small overshooting", "small steady state error", "small sensitivity to the dc component", "good frequency response", etc. The selected linguistic terms are next formalized by drawing the fuzzy sets with the membership function reflecting the level of satisfaction for a given argument to be „short”, „small”, etc. This process is typically arbitrary and reflects the preferences of the evaluating party. Examples are given in Fig.5. 2. Rank the objectives by associating the relative weights of the objectives. This step is usually accomplished by speciprobability density function
B. Evaluating the Frequency Response Typically, a measuring algorithm for protective relaying is expected to estimate a given feature of a sinusoidal signal under specified frequency. This means that the signal components of all the frequencies but the frequency, f0, to which the algorithm is tuned, should be suppressed during the measurement. This results in the ideal frequency response shown in Fig.4(a). However, the system frequency may change. That would cause the estimators having such ideal frequency response to deteriorate. Therefore, one should consider an ideal frequency response shown in Fig.4(b). Sample indices that define the filtering quality of a real measuring algorithm are as follows: · gain for the dc component, · maximum gain for frequencies other than f0. · aggregated index, F, assessing the difference between the ideal and actual frequency responses:
t2 % 16.6 18.6 20.6 22.6 24.6 26.6
[ms]
Fig.3. Sample probability density function (histogram) for the 2% settling time of the full-cycle Fourier algorithm. (a)
gain 1.0
f
0.0 0.0
f0 (b)
gain ideal
1.0
real 0.0 0.0
f f0
Fig.4. Ideal frequency response assuming fixed signal frequency (a). Ideal frequency response assuming frequency deviations (b).
fying the weighting factors directly or by comparing the objectives' weights on the pair-by-pair basis. The ranking is arbitrary and reflects the purpose of evaluation, experience of an evaluator, etc. There are formal methods enabling approximate (fuzzy) rankings [3]. Also, a number of formal algorithms are available to facilitate the ranking procedure [3]. Examples are: iterative consensus ranking by a group of experts, comparing the objectives to each other rather than giving the absolute rank, etc. Nonetheless this step is arbitrary to a great extent. 3. Compute the level of satisfaction of each objective and each alternative. 4. Aggregate the choices of all the criteria into the composite ranking. The above process will be illustrated using a simple weighting factor approach. Assume one considers: · the settling time (objective O1), · the overshoot (objective O2), · the steady state error (objective O3) as objectives for evaluating the time response of measuring algorithms, and: · the gain for the dc component (objective O4) · the frequency response index - eq. (7) (objective O5) as objectives for evaluating the filtering properties of measuring algorithms. Assume that for the considered application the design preferences in terms of weighting factors for the objectives are as gathered in Table I. The assumed weights specify, for example, that the speed of measurement is "three times" more important than the steady state error. Fig.5 shows the membership functions of the adopted linguistic terms "short settling time", "small overshoot", "small steady state error", etc. Table II gathers the values of the considered performance indices for three sample algorithms. Table III, in turn, presents the levels of satisfaction of the objectives resulting from applying the values from Table II to the functions shown in Fig.5. The aggregated rank of the alternative k (algorithm k) is a weighted sum of its satisfaction levels for all the objectives: rk
=
å wj
×
= kj
(8)
IV. EVALUATING THE OPERATING PRINCIPLES By an operating principle we mean in this paper a part of the relaying algorithm which does not assert the tripping decision directly but provides essential information for the tripping. The examples are: second harmonic restraint and bias characteristic for transformer protection, zone and directional elements, as well as power swing function for line distance protection, etc. Formally, an operating principle can be considered as consisting of certain criteria signal and appropriate operating characteristic (setting). It is worth noticing that evaluating the measuring algorithm that supplies a criteria signal for a given operating principle may not provide complete information about the quality of the operating principle itself. A protective relay is a complex decision-making device and the quality of the measurement, although important, does not determine the performance of the entire relay. Consider, for example, an overcurrent principle in the situation of a very low setting (comparing with fault currents). In such the situation, the principle will work very well even if very inaccurate algorithm is used for the measurement. This indicates that one cannot evaluate a relaying principle without taking into account the settings and anticipated system conditions. TABLE I. SAMPLE WEIGHTING FACTORS Objective
O1
Weight
0.30
O 0.15
short settling time 1.0
r3 = 0.70.
Thus, the algorithm 2 is the best one (in terms of the assumed design preferences), the algorithm 3 is the second choice, while the algorithm 1 is the least satisfactory alternative. The theory of multi-objective ranking (decision-making) provides the wide spectrum of different aggregating methods. This includes procedures for adjusting the relative weights of the objectives and evaluating the robustness of the resulting ranking.
O5 0.15 (b)
1.0
t 2 % [ms] 0.0
5
10
15
20
25
30
small steady state error
y% [%] 0.0
35
2
4
6
8
10
12
14
small gain for the dc component
(c)
1.0
(d)
1.0
e% [%] 0.0
-6
-4
-2
0
2
4
F R dc 0.0
6
.05
.1 .15
small frequency response index
where rk is the composite rank of the k-th alternative, wj is the weighting factor of the j-th objective, akj is the level of satisfaction of the j-th objective by the k-th alternative. For the considered sample data one computes: r2 = 0.79,
O4 0.30
small overshoot
(a)
j
r1 = 0.47,
O! 0.10
.2 .25
.3 .35
(e)
1.0
F 0.0
.05
.1 .15
.2 .25
.3 .35
Fig.5. Membership functions for the considered objectives. TABLE II. PERFORMANCE INDICES OF THE CONSIDERED ALGORITHMS. Algorithm 1 Algorithm 2 Algorithm 3
t2%
Dy%
De%
FRdc
F
12.5 15.0 22.5
11.2 8.0 2.5
2.1 0.5 4.5
0.25 0.12 0.12
0.3 0.21 0.16
TABLE III. SATISFACTION LEVELS. Algorithm 1 Algorithm 2 Algorithm 3
O1
O
O!
O4
O5
0.85 0.75 0.40
0.20 0.50 1.00
0.95 1.00 0.05
0.25 0.95 0.95
0.10 0.70 0.95
A. Collecting Exposures As in the case of evaluating a measuring algorithm, one needs a set of input signals in order to evaluate an operating principle. The input signals from a given disturbance constitute a single exposure [1]. By the exposure we mean a disturbance which triggers a relay or a protection system to perform certain operations and to issue the tripping command or other signals if called upon. Certainly, the data base of exposures may built by collecting the recordings from the actual system or using modeling and digital simulators. Since large numbers of exposures are desirable, the latter approach is more practical. In the case of an operating principle, the set of exposures should be divided into three categories: 1. Disturbances for which the principle should assert its output logic signal (for example, the 2nd harmonic restraint should assert the trip permission for all internal faults in a protected transformer; the directional element of a distance protection should assert its output for all forward faults, etc.). 2. Disturbances for which the principle must not assert the output signal (for example, the 2nd harmonic restraint during magnetizing inrush currents). 3. Irrelevant disturbances for which the principle may behave either way (for example, the 2nd harmonic restraint in transformer protection during external faults). For proper evaluation of an operating principle only the first two categories, say E1 and E0, respectively, should be considered. B. Evaluating an Operating Principle If a considered principle is perfect in terms of asserting the trip permission when needed (i.e. for the category E1 of exposures), the following sum assumes the value of 1: S1( n )
1 N1
=
å p( n )
(9)
E1
N1 is a number of exposures in the class E1, n is the time index, p is the output signal (trip permit): p = 1 — trip permitted, p = 0 — trip blocked. If the principle is not perfect, it fails to assert the trip permit in some cases from E1, and consequently, the sum S1 gets lower. Generally, S1 is a function of time assuming the values from the interval 0 (the principle is useless) to 1 (the principle is perfect). The higher the sum, the better the principle. On the other hand, if the considered principle is perfect in terms of blocking (i.e. for the category E0 of exposures), the following sum assumes the value of 1: where
where D is an arbitrary factor adjusting the relative importance of the tripping inclination over the blocking inclination of the evaluated principle (0 < D < 1). Fig.6 presents a practical example of the proposed evaluation algorithm applied to three selected relaying principles used to restrain the transformer differential relay under magnetizing inrush conditions [6]. The exposures have been collected by digital simulation of a two-winding 140/10.52kV, 5.86MVA, 50Hz, wye-delta connected transformer. Approximately one thousand inrush cases (E0) and another thousand of internal fault cases (E1) have been generated using ATP. Numerous factors have been assumed to be random for both the inrush (residual magnetism, switching-in incidence angle, system conditions, etc.) as well as for internal faults (fault resistance, location, type, system conditions, etc.). The results of using the set of exposures according to the described procedure are as follows. The overcurrent principle (a) is initially weak but gains its recognition ability to approximately 0.65 after about one cycle. This means that in 65% of cases this principle blocks the relay perfectly under inrush conditions and allows tripping for internal faults without any extra checking. The wave recognition principle [6] (b) is also weak during the first cycle of relay operation but gains significantly after that time. The classical 2nd harmonic principle (c) behaves in a similar way, although it is slightly less powerful than the wave recognition principle. The result of evaluation of an operating principle depends on both the applied measuring algorithm and the applied setting. One may, however, treat those as parameters, and maximize the recognition ability defined by (11). In this way the optimal setting and measuring algorithm can be found. This illustrates how evaluation may be used for optimization. The evaluation algorithm (9)-(11) enables one to compare different principles, deliver information on the dynamics of recognition and facilitates setting optimization. Certainly, this kind of evaluation is possible during the designing process and for existing relays but only if the appropriate information is revealed by the vendor. V. EVALUATING RELAYS AND PROTECTION SYSTEMS Evaluation of complete relays and protection systems can be done similarly to the evaluation of operating principles. The important difference is that a relay or a protection system asserts the tripping signal which is relayed to the Circuit Breakers (CBs). Thus, instead of considering time functions such as (9) and (10) one may build a performance index com1
Sa 0
S 0( n )
=
1 N0
å �1
-
p( n )
�
1
(10)
E0
The higher the sum, the better the principle. A good operating principle both permits tripping when called upon and blocks tripping when needed. Thus, the following function can be used to reflect numerically the performance of a given operating principle:
S( n )
=
D × S1( n )
+
�1
-
D � × S 0( n )
(11)
Sb 0 1
Sc 0 0
1
2
3
time [cycles]
Fig.6. Results of evaluation of the overcurrent principle (a), the direct wave recognition (b) and the 2nd harmonic principle (c) for magnetizing inrush cases in power transformers (settings optimized, D = 0.5).
bining the percentage of false and missing operations and the average reaction time. The definitions developed in [1-2] are the good starting point. Extending those definitions we propose the following compact performance index: J
=
C × P0
+
�1
-
C � × P1 + A × tTRIP
(12)
where C is an arbitrary factor defining the relative importance of the missing operations and false trippings, A is an arbitrary scaling factor defining the importance of fast reaction time, P0 and P1 are percentages of false trippings and missing operations, respectively [1-2], tTRIP is the average tripping time. The lower the index J, the better the relay. While design variants can be evaluated by means of simulation, actual equipment requires real-time testing. The advancements in the field of digital simulators provide the adequate testing tools [7]. The difference between a relay and a protection system is in exposures to which a relay or a system should respond. In the case of a relay evaluated using the index (12), one should consider only disturbances for which the relay is expected to operate when calculating the percentage of missing operations and the average tripping time. All the other disturbances except internal faults should be considered when calculating the percentage of false trippings. In the case of a protection system evaluated using the index (12), one should consider all internal faults when calculating the percentage of missing operations, while all the remaining disturbances should be considered when counting false trippings. VI. EVALUATION VS. OPTIMIZATION Evaluation is certainly the first step in optimization. The presented evaluation techniques enable for measuring the "goodness" of a given measuring algorithm, principle, relay or protection system. The next step of optimization is to decide how to modify an existing design in order to obtain a better alternative. As in the vast majority of engineering activities of this kind, the step of searching for a better design is heuristic. The evaluation methods enable one to rank the alternative designs while the search has be driven by the engineering knowledge and experience. The issue of settings is the key factor in design optimization. On one hand, a relay leaving a factory is not set (except certain "hidden" factory parameters). On the other hand evaluation of the relay performance requires settings (from the relaying principle level and up to relays and systems). To resolve this dilemma one may apply one of the following: · assume "average" settings for a given application resulting from the existing guides, practices or recommendations, · treat settings as unknowns in the course of evaluation and optimize the settings with the objective to maximize the performance (while evaluating always consider the relay optimally set). In either case the design optimization/evaluation would be arbitrary to certain extent. This, however, is obvious and unavoidable when realizing the role of settings in a controller such as a protective relay.
VII. CONCLUSIONS This paper defines a number of performance indices for evaluation, design and setting optimization for measuring algorithms, operating principles, complete relays and protective systems. The paper proposes to use multi-objective decision-making and ranking procedures based on fuzzy sets and logic to obtain aggregated (composite) performance index for the evaluated (ranked) design alternatives or physical relays. The hierarchical structure of a protection system is proposed to be used for evaluation. The performance quality of the higher level can be approximated as the composite index of performance indices of its building blocks. VIII. REFERENCES [1] IEEE PSRC Working Group D5 (chaired by E.A.Udren), "Proposed Statistical Performance Measures for Microprocessor-Based Transmission-Line Protective Relays. Explanations of the Statistics", IEEE Transactions on Power Delivery, Vol.12, No.1, Jan. 1997, pp.134-143. [2] IEEE PSRC Working Group D5 (chaired by E.A.Udren), "Proposed Statistical Performance Measures for Microprocessor-Based Transmission-Line Protective Relays. Collection and Uses of Data", IEEE Transactions on Power Delivery, Vol.12, No.1, Jan. 1997, pp.144-156. [3] H.J.Zimmermann, Fuzzy Sets, Decision Making and Expert Systems, Kluver Academic Press, 1987. [4] O.E.Schweitzer III, J.J.Kumm, "Statistical Comparison and Evaluation of Pilot Protection Schemes", Proc. of the 23rd Western Protective Relay Conference, Spokane, WA, October 15-17, 1996. [5] M.Kezunovic, J.T.Cain, B.Perunicic, S.Kreso, "Digital Protective Relaying Algorithm Sensitivity Study and Evaluation," IEEE Transactions on Power Delivery, Vol.3, No.3, July, 1988, pp.912-922. [6] B.Kasztenny, E.Rosolowski, M.M.Saha and B.Hillstrom, "A Comparative Analysis Of Protection Principles For Multi-Criteria Power Transformer Relaying", Proc. of the 12th Power Systems Computation Conference, Dresden, Germany, Aug. 19-23, 1996, pp.107-113. [7] IEEE PSRC Working Group F8 (chaired by M.Kezunovic), "Digital Simulator Performance Requirements for Relay Testing" IEEE Transactions on Power Delivery, Vol.13, No.1, January 1998, pp.78-84.
BIOGRAPHIES Mladen Kezunovic (S’77, M’80, SM’85, F’99) received his Dipl. Ing. degree from the University of Sarajevo, the M.S. and Ph.D. degrees from the University of Kansas, all in electrical engineering, in 1974, 1977 and 1980, respectively. Dr.Kezunovic’s industrial experience is with Westinghouse Electric Corporation in the USA, and the Energoinvest Company in Sarajevo. He also worked at the University of Sarajevo. He was a Visiting Associate Professor at Washington State University in 1986-1987. He has been with Texas A&M University since 1987 where he is a Professor and Director of Electric Power and Power Electronics Institute. His main research interests are digital simulators and simulation methods for relay testing as well as application of intelligent methods to power system monitoring, control and protection. Dr.Kezunovic is a registered professional engineer in Texas. Bogdan Kasztenny (M'95, SM’98) received his M.Sc. (89) and Ph.D. (92) degrees (both with honors) from Wroclaw University of Technology, Poland, where he is a faculty member of the Department of Electrical Engineering since 1989. In 1994 he was with Southern Illinois University at Carbondale as a Visiting Assistant Professor. During the academic year 1997/98 Dr.Kasztenny was with Texas A&M University as a Senior Fulbright Fellow. His research interests include protective relaying, digital signal processing, real-time computer application in power systems and artificial intelligence methods in power system protection. Currently he is with Texas A&M University as a Visiting Assistant Professor.