FRONTIERS OF E-BUSINESS RESEARCH 2002
DESIGNING A PERFORMANCE MEASUREMENT SYSTEM: A CASE STUDY IN THE TELECOM BUSINESS Jarkko Tenhunen M.Sc. (Tech.), Researcher Lappeenranta University of Technology, Lahti Unit
[email protected] Juhani Ukko M.Sc. (Tech.), Project Manager Lappeenranta University of Technology, Lahti Unit
[email protected] Tapio Markus M.Sc. (Econ.), Development Manager Telekolmio Oy
[email protected] Hannu Rantanen D.Sc. (Tech.), Professor Lappeenranta University of Technology, Lahti Unit
[email protected] Abstract This paper presents a case study related to a two-year research project, the aim of which was to develop a performance measurement (PM) system for small- and medium-sized enterprises. During the research project a PM system was developed and tested in pilot companies. These pilot companies represented traditional industry. This case study is the first attempt to apply the system to service industries. The study was carried out using the action research approach. One of the researchers was working in the company during the research project and gathered empirical data from inside the case company. A construction – the PM system – was designed, although it is not possible to evaluate its final usefulness at this stage of the research. The objective of the case study was to find out how the company should measure its performance. Before this development project the case company did not apply any PM system. Another challenge was to clarify the operative targets that should be measured and the way these targets should be defined to support long-run strategic goals. In this research project the PM system was developed for one department of the company. The findings of this project will be crucial when adopting performance measurement in other departments and at the company level.
487
FRONTIERS OF E-BUSINESS RESEARCH 2002
The results of this study show that the design team should consist of motivated people. The resources must be assessed carefully and the assistance of an external designer may be needed. The paper presents tools and procedures on how the design and implementation could be conducted in a medium-sized company. Keywords Performance measurement, design, implementation, SME
INTRODUCTION A company heading for success needs timely information about its operations. To get timely information the operations have to be monitored and measured constantly. This kind of measurement is commonly known as performance measurement (PM). Performance measurement in small- and medium-sized enterprises (SMEs) is a topic of current interest. There are a number of different performance measurement and analysis systems available for companies. The Balanced Scorecard (Kaplan & Norton, 1996), the Performance Pyramid System (Lynch & Cross, 1995) and the Performance Prism (Neely & Adams, Cranfield University -homepage) are globally known. There are also numerous different implementation processes and practice examples for companies presented in the literature and scientific articles (e.g. Kaplan & Norton, 1996; Olve et al., 1998). These existing tools and methods have, however, been developed from the perspective of larger companies. The commercial applications have been found rather expensive and too ‘heavy’ for small- and medium-sized companies. In addition, the implementation processes presented in the literature focus to some extent on the design part of the process. The target of this paper is to show how a PM system can be designed and how the information about the PM system can be distributed through the company. The final adoption of the constructed system is excluded from this study. The study was carried out using the action research approach. One of the researchers was working in the company during the research project and gathered empirical data from inside the case company. The case company applied a public-funded free software, which is briefly described in this paper.
PM SYSTEM DESIGN In the turbulent environment of the 21st century change is the only permanent phenomenon. When facing changes companies have to adjust their actions to succeed. These changes set challenges also for management accounting, whose main function is to deliver information to support decision-making. Kaplan (1984, p. 586) argued that in the early 80’s companies were applying management accounting methods developed in the 20’s. Kaplan’s (& Norton’s) answer to this shortcoming was the balanced scorecard (BSC) in 1992. Ten years after that the BSC was the best known and most widely spread performance measurement system in Finland (see e.g. Lönnqvist, 2002). 488
FRONTIERS OF E-BUSINESS RESEARCH 2002
SME aspects Performance measurement has typically been approached from the perspective of larger companies. The existing methods have been criticized for their inappropriateness for smalland medium-sized companies (see e.g. Chow et al., 1997; Hudson et al., 2001). In small- and medium-sized companies the organization structure and managing culture are typically different, retention of knowledgeable and competent staff could be difficult (Barnes et al. 1998, p. 86), severe resource limitations and fire-fighting mentality occur (Hudson et al. 2000, p. 243), and in SMEs knowledge about performance measurement is often quite limited (see e.g. Rantanen & Holtari, 2000). The documentation of corporate vision and strategies are ignored in many SMEs. In a small company the corporate vision or strategy might be lacking totally or the owner-manager is the only person who knows what the vision and strategies are. Usually there are also fewer highly educated employees in SMEs compared to larger corporations. Hence, the initiation to the field of performance measurement is more difficult than in larger companies, and the implementation has to be uncomplicated. It has been recognized recently that in SMEs there is a need for systematic performance measurement. Most SMEs operate with a poor forecasting and planning system (Gunasekaran et al., 2000, p. 317), and small- and medium-sized enterprises are susceptible to business failure primarily due to poor risk management associated with inadequately informed decision-making (Barnes et al., 1998, p. 86). A comprehensive performance measurement system can deliver vital information to support the decision-making and ascertain the continuity of the enterprise. Design basis A performance measurement system can be built in many different ways. Kaplan and Norton have specified a ten-task model (see Kaplan & Norton 1996, p. 300-311). Olve et al. (1998) have specified a model that consists of eleven stages. Furthermore, numerous other ways to build a performance measurement system have been presented in the literature (e.g. Simons, 2000; Lynch & Cross, 1995; Tenhunen et al., 2001). Roughly, the presented measurement systems and their designing principles are built on the same base: companies’ visions and strategies are the starting points for the targets to be measured. Almost every PM system includes different dimensions to measure: the BSC is actually built on these dimensions. Also PM systems emphasize the need to tailor the PM system for each individual company. This paper does not consider the above mentioned design processes in detail – they have been promoted widely in many scientific articles and books (Kaplan & Norton, 1996; Olve et al., 1998; Tenhunen et al., 2001). Instead, we present tools and procedures distributing the information about the PM system throughout the company. The strategy map According to Kaplan & Norton (1996, p. 149) strategy is a set of hypothesis about cause and effect. A properly constructed scorecard should tell the business unit’s strategy through such a sequence of cause-and-effect relationships. “Every measure selected for a Balanced Scorecard should be an element of a chain of cause-and-effect relationships that communicates the
489
FRONTIERS OF E-BUSINESS RESEARCH 2002
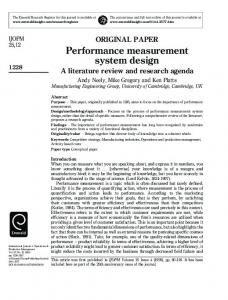
meaning of the business unit’s strategy to the organization.” Kaplan & Norton visualize this chain with the strategy map presented in figure 1.
LEARNING AND INNOVATIVENESS
Employee skills
PROCESSES Process quality
CUSTOMER
Process cycle time
On-time delivery Customer loyalty
FINANCIAL
ROCE
Figure 1. Strategy map (Kaplan & Norton, 1996, p. 31). This way of presenting causalities is rather self-explanatory and simplistic. One could argue that (good) process quality is caused by many other factors than just employee skills (e.g. processing machines, lay-out, production planning systems etc.). Similar examples could be presented for other steps in the strategy map. Why is this relatively simple and almost toowell-known figure presented here? Its usefulness increases when it is opened and tailored to present how the subject (company) is heading for good financial performance. Neely & Bourne (2000, p. 4) call this strategy map a success map, because the cause-and-effect chain is a kind of path to success. This strategy/success map is discussed more closely in chapter 4 from the perspective of the case company (the case company’s success map is presented in figure 3).
PM AND THE SAKE-SYSTEM The case company built the performance measurement system on the SAKE-application. The SAKE-application is the main part of the SAKE-system, which includes the actual application, detailed manual, measure examples and design and implementation guides. This package is distributed via an Internet homepage (www.lut.fi/lahti/sake) and cd-rom. The SAKE-application is composed of two-level matrixes. The main matrix is formed of performance dimensions, and the submatrixes include the measures. Maximum six dimensions can be inputted, and each dimension can contain six measures. So there can be maximum 36 measures in the SAKE-application. Every dimension has its own weight factor compared to other dimensions. The measures have weight factors inside their dimensions as well. The measures are calculated together to get the value of one dimension and after that the 490
FRONTIERS OF E-BUSINESS RESEARCH 2002
dimension values are calculated to get one aggregated PM indicator for the whole company (or department). The measures are scaled from 0 to 10 to get comparable values. The case company found it very easy to build the balanced scorecard –based PM system on the SAKE-application. The scorecard includes four (or five, see Olve, 1998) dimensions, which can be inputted to the SAKE. One factor speaking in favour of SAKE is that it has been developed with public funding and is completely free of charge.
CASE STUDY – TELEKOLMIO OY The case company The case company – Telekolmio Oy - is a medium-sized company delivering telecommunication services to other companies. The company’s turnover was about 18 million euros in 2001 and it employs 150 persons. The business activities are divided into four departments: mobile and information technology, voice systems, data services and security services. Before this development project Telekolmio did not apply any PM system. Management accounting was executed mainly on the basis of book-keeping. Even though the development in mobile and Internet technologies has brought new challenges to the companies, management accounting has been carried out with rather old methods. The lack of management accounting information has made internal guidance more difficult. The company is planning to build a measurement system that could measure operative targets derived from the strategic goals. The design process Before the actual measurement system building project the business processes were mapped in co-operation with a business consultancy company. The core processes and supporting processes were described. After that the business processes were opened and all the activities inside the process were listed. The process description was done by the key personnel from the department management, sales interface, material management, production design and marketing. The core processes were chained and the interface between core processes and supporting processes were identified. The process description was the starting point of the strategic planning in the case company. Before the case company could define its strategic goals or vision it had to define its present processes and activities – how things are done at the moment. The principles in the measurement in Telekolmio were drawn from the balanced scorecard. The long-term goals were determined at the company level and then for each department. The targets were grouped into four perspectives: financial, customer, internal processes, and learning & innovativeness. In addition, an action manual was developed to help the employees to grab a firm hold on the company’s working principles and common practices. The greatest challenge was to motivate the personnel to apply the new action procedures and ideas in day-to-day work. The performance measurement system was first built in the security 491
FRONTIERS OF E-BUSINESS RESEARCH 2002
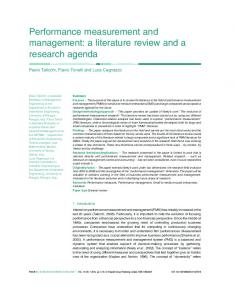
service department. It will serve as a pilot project, after which the PM is extended to cover the whole company as Kaplan & Norton (1996) have suggested. The chosen PM dimensions are financial, customer, internal processes, and learning & innovativeness; as in the target plan. The business activities have been observed through these perspectives for about a year. It was rather obvious to take these dimensions to the measurement system and it is possible to add a dimension or some dimensions to the system later if necessary. At the moment it is more important to consider the existing dimensions in a wide perspective than try to add new ones. Eventually the question is how a certain dimension of performance is described. For example the dimension ‘quality’ can include a broad range of measures if it is considered widely enough. In the future it will be interesting to explore whether it is possible to extend the measurement system backwards in the value chain. That would mean networking with subcontractors and measuring or evaluating them in the sense that they have an impact on the case company’s performance. Networking with local partners is mentioned in the target plan, although it is not measured yet. The first version of the developed PM system for the pilot department includes a total of 12 measures. Most of the measures are critical for decision-making, especially in the process perspective. The measures form a fairly brief and balanced package comprising both operative and strategic measures. The experiences in the pilot department will help to assess how large the measurement system should be for one department. Findings in the pilot project In this chapter we will discuss the most interesting findings during the pilot project – what is new from our point of view. The main targets for the PM were collected in the target plan (see Figure 2). This kind of presenting method gives a compact outlook of the company’s vision down to the key measures. The target plan includes the company’s success factors, strategic goals, action plan and key measures for each dimension – all in one sheet. In addition, building the target plan forces the project team to the state key issues relating to the PM system explicitly and briefly. The strategy map (or success map) introduced by Kaplan & Norton (1996, p. 31) was found helpful in determining the causalities between the dimensions of performance. The basic version of Kaplan & Norton was expanded (see Figure 3) to make it more practical and substantial for the case company. The success map helped to realize what kind of actions or events will lead to the desired goal. Its other function was to cut down excessive and overlapping measures. The success or strategy map forces the management team to consider the real action that will lead to the desired goal. In addition, it is a method to gain consensus about the company’s strategy and explaining its purposes. Before the measurement system is in full use a handbook will be created. The handbook will include the calculating formula for each measure, measurement frequency, target value, scaling and purpose – what a single measure is supposed to measure and why. The handbook will also include where the measurement information is gathered and what is the measure’s weight factor in the system. In other words, the handbook gives detailed information about the designed PM system. All employees will take part in training sessions where the handbook is thoroughly gone through. 492
FRONTIERS OF E-BUSINESS RESEARCH 2002
The implementation process, starting from the target planning is summarized in figure 4. It should be taken into account that the target plan includes vision and strategy statements – in the case company the strategic planning was done before the “actual” PM system design process.
A C
T I O N
Knowledge – what, why and how All personnel
Training Handbook PM system design
Management team
Overlapping in time and participation
Success map Target plan
Figure 4. The PM system implementation from targets to action. Figure 4 presents how the PM system implementation is to be done in the case company. The process, starting from the target planning and ending in to the training phase, should lead to the desired goal – knowledge about what to do, why and how. As can be seen in figure 4, the managers do the target planning and success/strategic map building, whereas the handbook and training are focused more on the employees. The PM system design is done by a design team, consisting mainly of managers. The phases are presented in chronological order even though some amount of overlapping takes place. This overlapping during the process is desirable rather than a defect. For future research it is interesting to try to conceptualise this process; to state precisely what these phases include and test the process in other companies. The PM system design is of course opened up to smaller sub phases (see e.g. Kaplan & Norton, 1996, p. 300-308; Olve et al., 1998, p. 50; Tenhunen et al., 2001). The time schedule made before the design process was rather tight but it was found suitable. From the start of the planning to the start of the trial run the process took three months excluding basic strategic planning, which was done beforehand. There were two basic issues which enabled the fast pace: there was one project worker concentrating entirely on the PM system development and secondly, the CEO was fully committed to the PM system design and implementation. The CEO was willing to work and release adequate resources for the design, which made things roll. In addition, the project team had a positive attitude on the performance measurement itself. Another matter that made rather fast proceeding possible was that the company utilized an existing application and did not develop their own, tailored application. The SAKE-system 493
FRONTIERS OF E-BUSINESS RESEARCH 2002
was ready and documented and it was free of charge. The strategic background work was done properly, and that made a good and solid starting point for the PM system development.
CONCLUSIONS This paper described how the case company designed a performance measurement system, what kind of tools they applied and how the final adoption will be conducted. The findings were as follows: A proper strategic planning forms a solid base on which the PM system is easy and quick to build. A pilot project (department) is a good starting point to begin performance measurement – the strategy should be, however, defined for the whole company even if the pilot is to be done in one department. The company’s strategy defines the departmental strategy in most cases. A small and effective team was found a better solution than employing the entire personnel of the department in the PM system planning. SMEs can benefit from using free software and PM systems when there is little or none former experience about PM. In the case company it was found easy and less risky to start the PM with a free and simple application. The strategic/success map was found a helpful tool to see what kind of activities should be taken to achieve the desired goal. In addition, it helps to cut out overlapping measures. A trade-off situation can be seen: the complexity and number of measures should be held down, but still an extensive enough description about the activities and the processes in the firm should be received. In a nutshell: not only large companies, but also SMEs need information to support their decision-making. This paper has presented one way of implementing a performance measurement which will deliver this information. In addition, the paper has presented tools that may benefit companies during the design and implementation of a PM system. This paper is based on empirical evidence from one company, which was studied with the action research approach. For further research, a longitudinal study with multiple cases is needed to test and conceptualise the presented design and implementation process.
494
FRONTIERS OF E-BUSINESS RESEARCH 2002
Vision
Values
The pilot department is a market leader in its market area
Customers trust us
Financial perspective
Playing for the team Profitable operations
Customer perspective
Process perspective
Everyone is an entrepreneur
Learning and innovativeness perspective
1. Profitable operations Concentrating on essential actions
Management of customer interface
Network knowledge
Interaction knowledge
Continuous improvement
Technical knowledge
All-inclusive management of customer projects 2. 2 Concentrating on profitable customers and product areas Improving profit
Utilizing the new innovations and possibilities quicly
Personal consulting of the customer Service contracts with key customers
Efficient and a highquality standard process
Concentrating on core competence and demanding applications
Well-managed projects Networking with local partners
Profitable growth
3. 3. Documented project management with all large projects Personal development planning Organizing the stakeholder co-operation Observing new innovations
4. 4 Documented project costing
New customer contracts per month or year
Step-by-step payment in large projects
Product and dealer specific volumes
Stakeholder responsibilities assigned and action plans done
Personal development planning done (once a year?)
Material cycle time
Personal development discussions annually
Turnover > x euros New applications for key product annually
1) Success factors 2) Strategic goals 3) Action plan 4) Key measures
Figure 2. The target plan for the pilot department. 495
496 Continual buying
Gaining market share
Turnover increases
Satisfied customer
Profit increases
Speedy and timely service
Effective process and controlled project working
High quality process
Buying more
Intensify project planning
Core competence is ensured
Less mistakes made
Professional skills developped
Encourage and increase training
Figure 3. Causalities between the dimensions of performance.
FINANCIAL
CUSTOMER
PROCESSES
LEARNING AND INNOVATIVE NESS
Finance expenses decrease
Concentrating on profitable actions
Invested capital in operations decrease
Intensify billing
FRONTIERS OF E-BUSINESS RESEARCH 2002
FRONTIERS OF E-BUSINESS RESEARCH 2002
REFERENCES Barnes, M., Dickinson, T., Coulton, L., Dransfield, S., Field, J., Fisher, N., Saunders, I. & Shaw, D. 1998. A New Approach to Performance Measurement for Small and Medium Enterprises. In: Neely, Andy (ed.). Performance Measurement – Theory and Practice, University of Cambridge, 14-17.7.1998. Cambridge, Centre for Business Performance. pp. 86-92. Chow, C.W. & Haddad, K.M. & Williamson, J.E. (1997). Applying the Balanced Scorecard to Small Companies. Management Accounting, Vol. LXXIX , No. 2, s. 21-27. Gunasekaran, A., Forker, L. & Kobu, B. 2000. Improving operations performance in a small company: a case study. International Journal of Operations & Production Management, Vol 20, No. 3, pp. 316-226. Hudson, M., Bourne, M., Lean, J. & Smart, P. 2000. Only just managing – No time to measure. In: Neely, Andy (ed.). Performance Measurement: Past, Present and Future, University of Cambridge, 19.-21.7.2000. Cranfield, Bedfordshire, Cranfield School of Management, pp. 243-250. Kaplan, R.S. & Norton, D.P. 1996. The Balanced Scorecard : Translating Strategy into Action. Boston, Harvard Business School Press. 322 p. Kaplan, R.S. (1984). The Evolution of Management Accounting. In: The Readings in Accounting for Management Control, eds. Otley, E. et al, Chapman & Hall 1992, s. 586-621. Lynch, R.L. & Cross K.F. 1995. Measure Up!: Yardsticks for Continuous Improvement. 2. ed. Cambridge, Blackwell Publishers Inc. 250 p. Lönnqvist, Antti. 2002. The use of performance measurement in finnish companies. Tampere, Tampere University of Technology. 143 p. A licentiate thesis. (In Finnish) Neely A. & Adams C. Perspective on Performance: The Performance Prism. Cranfield University. [Referred 8.4.2002]. Available: Neely, A & Bourne, M. 2000. Why measurement Initiatives Fail. Measuring Business Excellence, Vol 4, No. 4, p. 3-6. Olve, N.-G., Roy, J. & Wetter, M. 1998. Balanced Scorecard – Yrityksen strateginen ohjausmenetelmä. Porvoo, WSOY. 256 p. (in Finnish) Rantanen, H. & Holtari, J. 2000. Performance analysis in Finnish SMEs. Eleventh International Working Seminar on Production Economics. IGLS Austria, February 21-25.2000. Pre-prints, vol 2, pp. 311-321. Simons, R. 2000. Performance Measurement & Control systems for Implementing Strategy. Prentice Hall. Tenhunen, Jarkko, Rantanen, Hannu & Ukko, Juhani. 2001. SME-oriented implementation of a performance measurement system. In: Tuominen, Markku & Torkkeli, Marko (ed.). Challenges of Innovation and Technology Management for The New Millenium. The 13th International Society for Professional Innovation Management, 18-20.6.2001. Lappeenranta University of Technology, Lappeenranta, Finland. pp. 353-361.
497
FRONTIERS OF E-BUSINESS RESEARCH 2002
498