teaching and research activities but also in support services. These ser- .... The main difference between UK and Italian higher education reform measures.
Higher Education Quarterly, 0951–5224 DOI: 10.1111/j.1468-2273.2008.00415.x Volume 63, No. 3, July 2009, pp 237–263
Developing a Performance Measurement System for University Central Administrative Services Marika Arena, Michela Arnaboldi, Giovanni Azzone and Paola Carlucci, Department of Management, Economics and Industrial Engineering – Politecnico di Milano
Abstract Central administrative services have recently received increasing attention from practitioners and academics due to the challenging need to both manage scarce resources and provide high-quality services. In this context, performance measurement systems (PMSs) may assume a central role, although an unresolved debate remains on the claimed benefits of accountability and the difficulties that have emerged in defining and managing proper measures.This paper contributes to this debate by presenting the results of a study in which a PMS for central administrative services has been developed and tested through an action research approach drawing on actor network theory. The experiment was carried out in 15 Italian universities and five areas of services were dealt with: student support, research support, accounting, human resources, and logistics and procurement. The highly participative method resulted in a comparable system with a complete set of cost and quality indicators across the participating universities. These data proved to be useful at managerial and policy level, providing insights on the presence of scale effects and on the relative importance of quality dimensions for users of services. Participating in the project encouraged the university staff to use indicators in decision making.
Introduction During the last decade, there has been increasing pressure on higher education to use resources more effectively and efficiently, not only in teaching and research activities but also in support services. These services and their accountability have recently been acknowledged to be © 2008 The Authors. Journal compilation © 2008 Blackwell Publishing Ltd, 9600 Garsington Road, Oxford, OX4, 2DQ, UK and 350 Main Street, Malden, MA 02148, USA.
238
Higher Education Quarterly
crucial both as a budget line and as a contributor to primary activities (see Hill, 1995; Aldridge and Rowley, 1998; Casu and Thanassoulis, 2006; Brown and Brignall, 2007). This research was carried out in Italy, which has been characterised by a fundamental reform process in higher education. The first step in reforming the system was a law that was approved in 1993 (Law n.537/ 1993), which defined new principles to determine resources obtained from the central government. A second important step was made in 1999 (Ministerial Decree n.509/1999), when the central government increased the autonomy of universities to decide on their teaching offers and started to distribute monetary incentives to improve their services. This, added to a continuous trend to reduce funds from the central government, has also increased competition to acquire new and better students. Teaching performances and reputation have in fact remained central to attract students; however, support services are becoming increasingly important as facilitators in students’ careers and academic work. In this context, the paper presents a study of central administrative service accountability that endorses a participative approach, aimed at implementing and defining the significance of the measurement system for university members. The approach was developed in two distinct phases: system design and system application. The system includes three dimensions: the costs of services, the quality provided and the quality perceived. The first and the second dimensions required the elaboration and discussion of data, which were collected specifically by the participants (administrative managers and officers). The investigation of the quality perceived, however, required the involvement of the service clients, in particular students and teaching staff, with an overall participation of 12,044 students and 1,226 academics. The paper is divided into four sections: a reflection on performance measurement systems (PMSs) and the perspective adopted; a discussion of the specific context of Italian universities; the research approach adopted for the study; a description of the research model and a discussion of the results with some conclusions. Conceptual perspective: performance measurement and actor network theory Measuring performances in the public sector has been a central theme for researchers, practitioners and politicians for over two decades, with a number of contributions criticising the implemented and recommended © 2008 The Authors. Journal compilation © 2008 Blackwell Publishing Ltd.
PMS for University Central Administrative Services
239
systems. However, PMSs continue to be designed, tested, developed and sometimes abandoned. This contradiction has led many authors to consider that performance measurement is not an end in itself and to wonder ‘why measure performance?’ in the public sector (Hatry, 1999; Johnsen, 2005). Behn (2003) provided a literature review and identified eight reasons for measuring performances: to evaluate, to control, to budget, to motivate, to promote, to celebrate, to learn, to improve. Although the list may be contested or different, his review explains the still vivid interest that exists in attempting to define a PMS. This awareness of the opportunity of introducing higher accountability as an instrument for managers is counterbalanced by the difficulties involved in developing a measurement system. These difficulties may be related to three stages of defining a PMS: (1) the identification of a proper set of measures and target values; (2) the implementation of the operational system; and (3) the actual use of the system. Most of the failures encountered in literature appear to be related to the separation of these stages from the context in which they are implemented and the PMS distance from the managers who are supposed to act upon them. This complexity and the need to study the phenomenon as a whole has led actor network theory to be endorsed as a valuable framework; in this light, the research studied the development of a PMS, the creation of knowledge and the evolution of the social space surrounding the experiment. Reference was made to the initial contributions to actor– networks and the sociology of translation (Callon, 1986; Bijker, Hughes and Pinch, 1987; Latour, 1987) and their subsequent developments, which have been applied and translated into different fields of research (Lowe, 2001; Doolin and Lowe, 2002; Lodh and Gaffikin, 2003; Gendron, Cooper and Townley, 2007). From the perspective of actor network theory, society is seen as being constituted by diverse groups of people, who always interact with technology, machines and objects. This is a complex interplay among the heterogeneous elements of what is called technoscience, which constructs our society and organisations (Knorr-Cetina, 1997). This interpretation suggests that society and technology cannot be conceptualised as separate entities (Latour, 1994), but they need to be studied together in their mutually influencing evolution. In this light, the process of innovation (in this study the development of the PMS) is seen by actor network theory supporters as a process of translation in which scientists search for allies and consensus in society. In Latour’s (1987) words, translation is ‘the interpretation given by fact-builders of their interests and that of the people enrolled’ (p. 108). Translation is ‘the way to build technical or © 2008 The Authors. Journal compilation © 2008 Blackwell Publishing Ltd.
240
Higher Education Quarterly
scientific objects that is [ . . . ] the simplest means of transforming the juxtaposed set of allies into a whole that acts as one, to tie the assembled forces to one another, that is, to build a machine’ (Latour, 1987, p. 128, emphases as in the original). In studying the process of innovation, the distinction between technological and social innovation is blurred; humans and non-human actors are equally important and it is only through their interaction and the construction of a socio-technical network that innovations can propagate. This equality is a controversial issue of Latour’s (1987, 1994) philosophy, which has both supporters and opponents (Lowe, 2001; Harris, 2005). However, the symmetry between humans and nonhumans might not be intended as an equal status among them, but it suggests placing attention on the interaction between technologies and social actors and their reciprocal changes as an original idea progressively tries to become an innovation.This is the interpretation adopted in our study as it is only by studying the interaction between the university managers, researchers and technological devices (the PMS) that it is possible to understand the PMS that has been obtained and the general consensus that has been reached on the data. Italian universities and the reforming context An explanation of the general context in which Italian universities are set is important to understand the environment and the challenges of the project. The reform of the public sector has been pursued by governments in western countries since the early 1980s; actions have been undertaken at different levels and universities are a component part of this process. The Italian university system reform process was started in the mid-1990s, with the introduction of a new financing system, which represented a real break from the past. A law drawn up in 1993 (n. 537/93) defined new rules to determine the resources that could be obtained from the central government and this helped contribute to budgetary devolution. Previously, the Italian system was characterised by the centralised role of the Ministry of the University, which was in charge of defining the allocation of resources to each university; personnel and research funds were directly paid by the central government and then assigned locally to the faculties of each university. The previously mentioned 1993 reform introduced three main changes: (1) the definition of a single-line budget of financial resources, which included all the items previously assigned directly to specific cost centres (e.g. faculties); (2) the introduction of ‘re-balancing’ mechanisms, which assign an increas© 2008 The Authors. Journal compilation © 2008 Blackwell Publishing Ltd.
PMS for University Central Administrative Services
241
ing part of the resources on the basis of the standard costs per student; and (3) the introduction of incentive mechanisms, based on the achievement of results defined by the central government. Furthermore, the same law introduced two evaluation mechanisms for universities. First, at a local level, universities have to define an internal committee that determines the fairness of the management of the resources, research productivity and teaching results. Second, at a central level, the government created a national committee to evaluate the university system, which assesses the results of academic institutions and controls their development plans. These reforms have helped shape a more autonomous and competitive system in Italy and were inspired by pacesetters like the UK, although some differences still exist from the Anglo-Saxon model. The main differences between the two systems are related to three issues (Agasisti and Catalano, 2006): the autonomy of institutions, the role of the state as the main provider of funds and its role as regulator. Regarding autonomy, UK universities have almost complete autonomy in teaching and in recruiting staff; in Italy, however, staff recruitment is carried out through a public competition that must be approved by the central government. There are also some limits in teaching autonomy in Italy, where courses are again subject to approval from the central government. As far as the financing system is concerned, both Italy and the UK adopt a lump sum approach with a unique budget line; however, state financing in Italian universities is, on average, much higher (80 per cent) than in UK universities (OECD, 2005). As for the regulator role of the state, while the UK emphasises the quality of ex-post evaluation, the central government in Italy also carries out an ex-ante regulation of the programmes. Table 1 summarises the main differences between the UK and Italy. Although there are some limitations compared to the UK, the devolution of decisions has offered new opportunities to Italian universities, but at the same time it has led to challenges for their management and academic boards and has highlighted the many difficulties involved in overseeing their administration. In this context, the first requests were made by university managers and the Ministry of the University to carry out an experiment on a PMS in central support services, an area that had (systematically) been neglected by the internal evaluation committee. With the financial support of the Ministry of the University, a first project, involving 10 universities, was undertaken in 2000 to experiment a cost-accounting model.This first project was successful but at the same time highlighted the need to extend the system not only to cost but also to quality performance. © 2008 The Authors. Journal compilation © 2008 Blackwell Publishing Ltd.
242
Higher Education Quarterly
TABLE 1 The main difference between UK and Italian higher education reform measures Phase
UK
Italy
Recruitment
Free
Teaching autonomy
Free
Allocation
Lump sum Formula based Emphasis on ex post evaluation
Public competition, approval by the central government required Approval of programmes by the central government Lump sum Formula-based Ex post evaluation Ex ante evaluation of programmes and strategy
Regulating role of the state
The research approach The adopted research approach is a consequence of the need to implement and test a PMS for university support activities, and it reflects the conceptual perspective adopted in the study.The lack of available frameworks on this topic led to the choice of an action research method. Interest in action research first developed from the social sciences and underwent a new renovation impulse in the 1980s, also in higher education studies (Cohen and Manion, 1980; Suojanen, 1999). Since its origins, action research has witnessed growing recognition of its contribution to the understanding of practices and its provision of theoretical insights. The central issue of this approach is the interplay between science and practice, which simultaneously influence the theoretical conceptualisation and the practical rules of the studied phenomena (Argyris, Putnam and Smith, 1985). This method is appropriate for the scope of this study and to translate the key concepts of Latour’s (1987) work and actor network theory. The two central contributors to action research, Argyris and Kemmis, consider it a way of connecting the critical thinking of researchers to the emancipation to change processes (Argyris, Putnam and Smith, 1985; Kemmis, 1985). Furthermore, action research entails the participatory involvement of actors within a studied organisation in all of the research phases: it builds an exchange of information and knowledge and it enhances participants’ competencies, through their participation in building facts and acting with technologies (Greenwood and Levin, 1998). © 2008 The Authors. Journal compilation © 2008 Blackwell Publishing Ltd.
PMS for University Central Administrative Services
243
Considering performance measurement and accounting, the use of real data to explore these phenomena is not new. Lapsley and Llewellyn (1995) described a new approach to case-study research, which explores practitioners’ reactions to specific elements and actions. The authors suggest the use of this method for the reflection of conceptualising on embedded accounting information in organisational processes. The approach adopted here draws on this previous experience, and it was designed to define a measurement system that was agreed upon with the university managers. The model was designed with the suggestions and applied to 15 universities, the results were compared and the significance of the specific system for the university members was examined. The 15 universities have 35 per cent of the total number of students in the 61 Italian state universities. Accordingly, the approach was divided into four phases: (1) the design; (2) the implementation; (3) the discussion of data; and (4) the observation of the spread of ideas. The first phase was devoted to the definition of the network, which includes the participant infrastructure (humans) and the technical device (non-humans) (Latour, 1987). The second phase concerned the application of the PMS in the participant organisations. The third phase was aimed at presenting and discussing the data within the project arena. Finally, fourth phase was aimed at observing the use and effects of the experimented system, outside the project space. Here the data collection was carried out through interviews with managers and officers in two different periods, just after the closure of the project and then 10 months after that. Overall, the research was carried out over a two-year period from January 2004 to December 2006. The endorsed approach implied a continuous and close interaction between the research team and the organisations involved (Table 2). TABLE 2 The research phases No. Phase
Timing
1
From January 2005 Agent of change Involved in the to May 2005 design From June 2005 to Agent of change Involved in the December 2005 experiment January 2006 Observer Passive From October 2006 (interviewed) to December 2006
2 3
Creating the network Acting the network Observing the spread of ideas
Researcher’s role Participant’s role
© 2008 The Authors. Journal compilation © 2008 Blackwell Publishing Ltd.
244
Higher Education Quarterly
The results: from ideas to action The results of this study are reported in four sections: (1) the analysis of the incremental creation of the network, in which the actors (researchers and university managers) interact and design the PMS; (2) an examination of the problems of the PMS implementation; (3) a discussion of the obtained data, highlighting the benefits at managerial and policy level; and (4) the analysis of the use of data outside the boundaries of the network.
Creating the network: actors and the PMS Latour (1987) and actor network theorists have emphasised the importance of networks for the success of an innovation; in their view, a network is made by both human actors and the technology under development (non-human). This perspective is particularly appropriate for the implementation of a PMS in higher education, in which the distance between the system, its proponents and the users has been recognised to be one of the main reasons for PMS failure. In a simplified way, Figure 1
University A
Research group University N
PMS
University B
University …
Figure 1 A simplified representation of the network © 2008 The Authors. Journal compilation © 2008 Blackwell Publishing Ltd.
PMS for University Central Administrative Services
245
shows the network, in which the universities interact among each other, with the technology (the PMS) and with the research group, which acts as the translator.This infrastructure is at the basis of all the phases in the PMS construction, from its design to its use after the end of the study. To ensure a high level of interaction and commitment, participation in the project was voluntary and self-financed by the universities. The proposal was made at the end of 2003 and 15 universities agreed to participate in the experimentation; pseudonyms were given for reasons of confidentiality (Table 3). There were two main actors (or groups of actors) in the universities: the scientific referee and the technical support. The scientific referees were administrative directors or delegated top managers, and they were mainly involved in the design phase and in the discussion and revision of the results. The level of participation in the study was high right from the early stages. Discussions were held with top managers to decide not only on the type of performances that should be included in the system (e.g. cost or quality) but also on the areas of support services in which they were more interested. These preliminary discussions were useful for the research team to help design an initial model for the PMS, which was based on three dimensions, cost, objective quality and subjective quality, in five major central administrative service areas: student support services, research support services, accounting, human resources, and logistics and procurement. After this straightforward decision, some doubts were raised on the possibilities of comparing the support services of the 15 institutions as they are organised in different ways. To overcome this problem, and drawing on previous experiences (Arnaboldi and Azzone, 2006), the research group proposed an activity-based model (Kaplan, 1983; Johnson and Kaplan, 1987; Bhimani and Brimson, 1989; Mitchell, 1994, 1996). With this model, the measurement basis became the activity (e.g. payroll payments) instead of the organisational units in which each university is organised. This approach can be graphically clarified in Figure 2, which gives several calculation examples and shows not only the benefits but also the implications on the design and data collection. This early negotiation helped resolve the comparability issue, from the very first stages of the project, and also led to the managers and officers being more interested in actively participating in the design of the system and the protocol for the data collection, as the following comment shows: © 2008 The Authors. Journal compilation © 2008 Blackwell Publishing Ltd.
1 2 3 4 5 6 7 8 9 10 11 12 13 14 15
© 2008 The Authors. Journal compilation © 2008 Blackwell Publishing Ltd.
Total
University A University B University C University D University E University F University G University H University I University L University M University N University O University P University Q
Universities
597,239
94,416 30,061 66,796 65,581 10,675 36,489 28,770 38,610 60,271 63,526 21,555 25,420 14,510 17,703 22,856
Number of students (a.a. 2004–2005)
University dimension
12,983
1,870 570 989 1,427 291 1,072 937 834 1,503 1,287 520 580 457 302 344
Number of PhD students (a.a. 2004–2005)
18,773
2,999 641 1,606 2,290 236 1,407 684 1,137 2,195 1,961 1,098 867 465 543 644
Number of teachers (31.12.2004)
TABLE 3 The main attributes of the organisations
17,869
2,872 764 1,643 1,793 335 859 542 1,002 2,162 2,525 928 781 600 473 590
Number of workers (31.12.2004)
North South South South South South South North North South North North North North North
Geographic location
246 Higher Education Quarterly
PMS for University Central Administrative Services
247
Administrative director
Finance
Accounting
Human resources
Logistics
ACCOUNTING ACTIVITIES in the project space
Figure 2 The relationship between the project activities and the university organisational structure
At the beginning, we were worried about the possibility of comparing our universities, which we know are organised differently. The presentation of the activity approach convinced us that the comparison was possible but we also realised that we needed to define a detailed and shared protocol to collecting data. I asked my people to pay particular attention to the technical design in order to interact with the team; this was crucial to understand what the data meant. (Administrative director at University C)
Starting from this awareness, the process of translation of the PMS was based on a continuous interaction between the researchers and the university managers, and in this way it was possible to design the three dimensions of the system: costs, objective quality and subjective quality. The first measurement dimension, cost, required the definition of three elements: the cost pools, the activities and the drivers. The definition of the cost pool was straightforward, as it was possible to take advantage of previous projects in Italian universities (Arnaboldi and Azzone, 2006). The definition of the activities was instead a significant reason for discussion and translations in the project network; the interaction with the scientific and technical referees helped to better define the whole set of activities performed and to specify the collection protocol to guarantee comparability of data. Finally, the cost model introduced the drivers, which are the measures that are used to calculate a unit cost per output. The changes to the initial proposal made by the research team were marginal, but the interaction again served as a process of learning for the managers. The second and third measurement areas are related to effectiveness and adopt both objective and subjective measures. The first set of © 2008 The Authors. Journal compilation © 2008 Blackwell Publishing Ltd.
248
Higher Education Quarterly
indicators (objective effectiveness) has the aim of measuring the level of services actually offered by different universities (e.g. response time, service availability). The second set of indicators (subjective measures) has the aim of measuring the perception of the service quality by the users (e.g. satisfaction about the waiting time, service availability, information support). As far as objective effectiveness is concerned, a first proposal was circulated in the network and several comments were collected. The discussion was long and some managers proposed a much longer list of indicators; again the fact-building approach helped to show the possible results and the difficulties involved in carrying out an effective comparison among universities. The set of measures for objective effectiveness was significantly reduced after the discussion to include both quantitative and qualitative measures.The quantitative information refers mainly to the existence of specific services (e.g. ‘frequently asked questions’ for students, counselling, etc.). On the other hand, qualitative information ensures a better understanding of the actual services provided, although more subjective dimensions, such as different procedures to enrol new students are also included. The discussion on subjective quality was based on the formulation of a questionnaire aimed at investigating user satisfaction. This instrument included closed questions against a four-point scale.1 As in the previous steps, the first proposal, formulated by the research group, was discussed with the referees from the different universities and was revised according to their comments and suggestions. Again, the confrontation helped not only to tailor and refine the questionnaire but also to improve the managers’ competencies and awareness of measuring performances. A final question, investigating the overall service quality, was eventually included in the questionnaire to support the analysis of the relevance of each item on user satisfaction (see Appendix for translation of questionnaire). For subjective quality, the identification of the samples and the conducted survey were differentiated according to the users: the students or the teaching staff. A stratified sample was selected to monitor student satisfaction, which incorporated students of different ages (newly enrolled and graduating students) and from different faculties (scientific and humanistic faculties). The sample selection resulted in 14,300 questionnaires being distributed to the 15 universities. The survey of academic satisfaction targeted the whole teaching staff in each of the 15 universities who were asked to answer the questionnaire. © 2008 The Authors. Journal compilation © 2008 Blackwell Publishing Ltd.
PMS for University Central Administrative Services
249
Acting the network: the implementation of the system The model presented in the previous section was implemented in the 15 universities involved in the study; the results of the experiment are presented and the operational are difficulties discussed. The operational difficulties encountered in the application were different for the three areas (efficiency, objective and subjective performance). Considering the application of the cost model, the universities were facilitated by previous projects; however, there were still some difficulties in data collection. The most critical part of the activitybased exercise was the definition of the percentage of time devoted to the activities; first, the university staff who were not involved in the design had difficulties in placing their activities in the correct section and understanding the terminology defined in the project space; second, they tended to see the collection of time percentage as a control device, which could affect their position within the organisation. The role of the technical referees was crucial in this situation and showed how participation in the meetings, in the development of the model and in the implementation itself enhanced their understanding of the PMS. The main issue of the implementation of the objective quality model was the relevance of qualitative information within the PMS. Participants frequently asked for reassurance over the definition of the qualitative dimensions, for example, the description of procedures. Although caution was adopted in phase (1), in order to try to achieve a high standardisation of the possible answers, the analysis was difficult. Some dimensions were excluded from the analysis to guarantee a significant comparison. Finally, the main problems concerning the subjective measures were related to the data collection. For the student satisfaction survey, the resulting number of questionnaires that resulted was suitable for processing was influenced by contingent situations. In two universities (Universities H and P), some professors did not allow the questionnaires to be distributed during their lessons; this led to fewer questionnaires being collected than was initially agreed upon. In another two universities (Universities A and M), there were a high number of unacceptable questionnaires because of errors in filling them in; the average response rate was 84.2 per cent. The data collection for the teaching staff survey involved various difficulties. In several institutions, for example, some respondents decided not to take part in the research project because they feared a possible lack of anonymity; the average response rate was 6.5 per cent. © 2008 The Authors. Journal compilation © 2008 Blackwell Publishing Ltd.
250
Higher Education Quarterly
Discussing the data In this section, the obtained data are presented with reference to three areas: the costs, the quality (subjective and objective), and the overall map of costs and quality. In the discussion of the data, the implications both at a managerial and a policy level have been highlighted. The first result area concerns costs; the collected cost results were compared with three specific indicators: the total cost of the activities, the unit cost of the activities and the service unit cost (obtained by dividing the total cost of the activities for each service by a unique driver). Table 4 shows an example of the unit costs for human resource services. Examining the first activity in Table 4 (teaching staff competition2), university managers have the possibility of comparing their costs with other universities. For example, University G, with the highest costs, realised that a reduction of its cost on the average (1,825.6€ per competition) would lead to a significant saving, as the following comment shows: I knew that we spent too much on competitions but we did not have a reference value. Last year we organised 40 competitions. If we had been able to have a lower cost, let’s say the average value, we would have saved nearly 1,400€ per competition, that means a total potential saving of nearly 56,000€. We need to analyse the activities in depth but this is impressive. (Top manager at University G)
The lowest cost for each activity is usually obtained by different institutions (Table 4): there is no ‘best’ institution with the lowest cost in all activities. The adoption of the activity-based approach and the careful definition of the protocol also made it possible to define an overall efficiency measure for the five services. The calculation was made summing the total costs of the activities in the area (e.g. student support) divided by a unique driver (e.g. the number of students). Table 5 shows the unit costs, the difference from the minimum and the possible savings. A regression test on the university size was made, which highlighted the lack of scale effects. Examining these data, two implications emerge. These numbers offered the managers an overall comparison of the costs of the service, which may be used at the aggregate level to position the universities; second, at a more detailed level, the numbers indicate specifically which specific activities are particularly costly. Two results are relevant at the policy level. First, this comparison can offer target values for the unit cost of support activities, which may be © 2008 The Authors. Journal compilation © 2008 Blackwell Publishing Ltd.
99.7 44.8 149.0 156.7 131.3 93.8 138.0 106.9 65.0 94.4 114.2 114.7 81.8 79.4 130.5 106.7
2,534.9 1,882.0 1,862.7 1,955.6 1,792.9 1,408.6 3,273.5 1,076.0 1,890.7 1,135.6 2,470.9 1,158.0 1,414.9 1,974.2 1,554.3
Mean 1,825.6
A B C D E F G H I L M N O P Q
Administrative management for teaching staff
€/competition €/teaching staff
Staff competition
© 2008 The Authors. Journal compilation © 2008 Blackwell Publishing Ltd.
214.5
180.6 141.8 230.7 408.6 142.8 248.3 376.3 239.4 132.3 286.3 159.8 149.1 140.4 121.6 259.9
€/professional staff
Administrative management for professional staff
918.0
327.8 492.0 784.3 576.5 1062.5 1206.7 1895.9 1021.2 1931.0 1838.6 1045.8 180.7 881.2 263.7 263.0
€/file
24.0
15.3 8.8 24.4 22.3 27.5 20.3 37.9 31.9 11.4 27.1 28.1 32.3 34.0 19.2 20.0
€/person
84.7
26.4 14.5 52.8 163.4 15.4 60.7 60.6 18.4 12.0 24.9 29.3 51.5 688.2 42.1 11.4
€/contract
120.7
51.2 121.2 109.1 118.3 235.7 119.5 97.6 129.2 99.4 59.3 178.4 144.5 73.2 111.7 162.5
€/person
7.2
4.2 7.9 11.8 17.3 3.7 4.1 7.3 3.0 4.3 5.3 1.9 5.8 7.4 5.3 19.8
€/training hour
Pension External job Teaching Payroll Training for and Staff authorization contract management professionals leaving management indemnity
TABLE 4 The unit costs of the activities of the Human Resource Services
PMS for University Central Administrative Services 251
252
Higher Education Quarterly TABLE 5 The overall unit costs for the student support services
University A University B University C University D University E University F University G University H University I University L University M University N University O University P University Q Minimum Cost
Unit cost [€/student]
Unit cost Variance (actual cost minus minimum cost) [€/student]
Driver [n. of students]
Potential saving (variance*driver) [€]
65.58 107.38 85.00 98.15 88.83 94.46 59.78 108.62 83.97 79.89 73.29 126.22 183.70 95.91 162.23
5.80 47.60 25.22 38.36 29.05 34.67 0.00 48.83 24.18 20.10 13.51 66.43 123.92 36.13 102.44
94,416 30,061 66,796 65,581 10,675 36,489 28,770 38,610 60,271 63,526 21,555 25,420 14,510 17,703 22,856
547,379 1,430,886 1,684,394 2,515,918 310,058 1,265,227 0 1,885,420 1,457,578 1,277,107 291,142 1,688,714 1,798,017 639,534 2,341,435
59.78
Total saving = 19,132,810
used to steer a better use of government resources. Second, the results suggest that the size and the geographical position of the universities (northern against southern) are not related to higher or lower efficiency levels. The second area of data is the quality, which includes both the subjective (Table 6) and the objective measures (Table 7). The results of the student satisfaction survey provided a significant basis for comparing the performances of the universities. At the managerial level, each university not only had the possibility of seeing their position in relation to the overall satisfaction but also to understand what the most critical factors were for their students. Table 6 presents the scores of the survey; the universities are ranked in decreasing order with respect to the overall satisfaction. If we analyse university O, for instance, it can be seen that although it has a positive position in the overall ranking (first column), some parameters are below the average results: for example, front-end timetable and the waiting space. © 2008 The Authors. Journal compilation © 2008 Blackwell Publishing Ltd.
© 2008 The Authors. Journal compilation © 2008 Blackwell Publishing Ltd.
D2 3.13 2.42 2.23 2.15 2.17 2.16 2.10 2.17 2.07 2.04 1.95 1.86 1.86 1.84 1.45
D1 3.15 2.28 2.17 2.10 2.07 2.05 1.97 1.92 1.90 1.83 1.76 1.76 1.73 1.68 1.37
1.97
C O E N Q P A M H F D L I G B
Total
2.10
Staff competency
Overall satisfaction
2.10
D3 3.21 2.48 2.31 2.11 2.15 2.22 2.03 2.24 1.95 1.91 1.90 1.91 1.90 1.86 1.41
Staff helpfulness
1.72
D4 2.99 1.66 1.97 1.48 1.74 1.77 1.62 1.45 1.27 1.62 1.57 1.87 1.57 1.62 1.43
Front-end timetable
2.12
D5 3.06 2.31 2.05 2.50 2.03 2.18 2.26 2.10 2.62 1.94 2.08 1.67 2.05 1.81 1.72
Automatic tools
1.97
D6 2.72 2.12 2.58 2.20 2.32 2.07 1.78 1.52 1.74 1.93 1.81 1.89 1.57 1.92 1.38
Waiting time
1.70
D7 2.55 1.64 1.84 1.74 1.86 1.96 1.64 1.66 1.40 1.52 1.55 1.58 1.59 1.41 1.50
Waiting space
2.92
D8 3.53 3.26 3.01 3.04 2.94 3.12 3.15 3.12 3.01 2.88 2.97 2.58 2.76 2.59 2.12
Information reliability
2.55
D9 3.15 2.69 2.75 2.65 2.64 2.55 2.49 2.42 2.61 2.62 2.47 2.42 2.39 2.41 2.14
Simplicity of forms
TABLE 6 Subjective quality: descriptive statistics
2.54
D10 3.23 2.70 2.71 2.72 2.60 2.57 2.52 2.50 2.79 2.51 2.50 2.34 2.33 2.33 2.07
Accessibility of forms
1.93
D11 3.06 2.19 2.12 2.15 2.02 1.96 1.95 1.99 1.92 1.67 1.69 1.63 1.71 1.75 1.48
Timeliness
2.59
D12 3.46 2.84 2.66 2.69 2.66 2.58 2.67 2.66 2.64 2.64 2.59 2.33 2.34 2.31 1.95
Consistency of information
2.55
D13 3.34 2.79 2.55 2.76 2.59 2.58 2.63 2.64 2.72 2.57 2.57 2.24 2.33 2.24 1.97
Coherence of information
PMS for University Central Administrative Services 253
254
Higher Education Quarterly TABLE 7 Objective performance scoring system
Weight University
0.33 Response time
0.33 Automation
0.33 Informative support
OVERALL SCORE
University A University B University C University D University E University F University G University H University I University L University M University N University O University P University Q
0.50 0.00 0.83 0.17 0.54 0.13 0.27 0.67 0.38 0.00 0.33 0.88 0.42 0.58 0.29
0.79 0.50 0.59 0.48 0.82 0.41 0.41 0.95 0.55 0.12 0.91 0.47 1.00 0.97 0.82
0.67 0.54 0.65 0.62 0.58 0.56 0.31 0.70 0.74 0.55 0.48 0.67 0.76 0.76 0.47
0.65 0.35 0.69 0.42 0.65 0.37 0.33 0.77 0.56 0.22 0.57 0.67 0.73 0.77 0.53
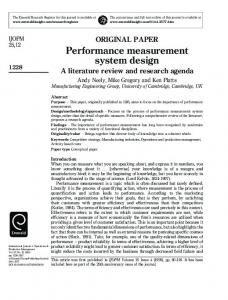
Examining the overall survey data, an interesting result emerges from a comparison of the scores given by the students to each factor and their relevance on the overall satisfaction.3 Figure 3 shows the graphical representation of these two variables. The x-axis indicates the attribute importance, measured by the standardised coefficients and the y-axis shows the performance (satisfaction about service quality). The performance and importance values divide the matrix into four quadrants.The position of each item in the matrix indicates whether student satisfaction attributes constitute major or minor strengths and weaknesses. Quadrant I contains factors with high performances and low importance. The resources directed here may be excessive and could be potentially employed more effectively elsewhere (consistency of information provided in different moments; coherence with information available elsewhere; simplicity of forms and documents; accessibility of forms). Quadrant II shows attributes considered very important by the students and where universities demonstrate high levels of performance. Figure 3 shows that no factor falls in this area. Quadrant III includes attributes considered very important for students but where the performance of the universities is fairly low.The factors positioned here are the most critical and include staff competency, staff aid, timeliness, waiting time and front-end timetable. Finally, quadrant IV shows the attributes © 2008 The Authors. Journal compilation © 2008 Blackwell Publishing Ltd.
PMS for University Central Administrative Services
255
3.00 Information reliability 2.80
Quadrant I
Perceived effectiveness score
Quadrant II
Consistency of information
2.60
Simplicity of forms Coherence of information Accessibility of forms
2.40
2.20 Automatic tools
Staff helpfulness Staff competency
2.00
Waiting time Timeliness
Quadrant IV
Quadrant III
1.80 Waiting space 1.60 0.00
0.05
Front-end timetable
0.10
0.15
0.20
0.25
0.30
0.35
0.40
Importance of factors
Figure 3 The importance – performance matrix
where universities perform badly but that students do not consider critical, such as the availability of automatic tool and the quality of waiting spaces (Harvey, 1994; Harvey et al., 1997). The analysis of the objective performance was based on the construction of a scoring system, which assigned predetermined scores, which were discussed within the project network, to each indicator. The indicators were then grouped into three main areas, namely response time, automation and informative support. A synthetic index was calculated for each area as an average of the different individual indicators. At the end, a single score was introduced to rank the objective performances of the universities. The results of the objective performance were also compared to those of the subjective performance, both at an aggregate level, considering the overall score and with respect to the single items (i.e. waiting time). This comparison helped the university managers identify areas with significant gaps between the level of service provided, given by the objective measure and the students’ perceptions. Such a situation could have been determined by faulty communication towards the students concerning the services actually offered by the administrative staff, which do not appear to be aligned with the students’ expectations. The final area of the results is dedicated to the overall picture of performances. A map was built for each of the five service areas, using © 2008 The Authors. Journal compilation © 2008 Blackwell Publishing Ltd.
256
Higher Education Quarterly 2.0
C O
P
H
N
D
Q
F
B
Quality score
E
1.8 1.6
I
A
1.4
L
1.2
M G
1.0 0.8 0.6 0.4 0.2 0.0
140.0
120.0
100.0
80.0
60.0
40.0
20.0
0.0
Variance from the minimun unit cost ( student)
Figure 4 Map of the overall performances
two items: the unit cost of the service (Table 4) and the sum of the subjective and objective quality scores. Figure 4 shows the performance map for student support services. The figure highlights an efficiency-effectiveness frontier formed by three ‘good practices’: university G has the lowest cost but also the lowest level of quality; university C has the highest quality score but a higher cost per student; finally, university A is in the middle with a good combination of quality and efficiency. This picture helped managers understand their position and to reflect on future investments, as this comment shows: Seeing our university [O] in the map was extremely helpful. We have invested significantly in the quality of services for students and I’m happy about the results: our students are satisfied, the automation level is high and the information support resulted to be one of the best within the network. But the variance of our actual cost from the benchmark is high and maybe what we need to do now is to just maintain the level of service without searching for more and more improvements. (Administrative director at University O)
Looking at the map from a policy point of view, the variety of positions is not surprising; it reflects a context of increased autonomy where universities may chose whether to support services at the minimum cost with an acceptable level of quality, or search for high-quality service but with higher costs. © 2008 The Authors. Journal compilation © 2008 Blackwell Publishing Ltd.
PMS for University Central Administrative Services
257
Observing the spread of ideas The use of the performance measures in the organisational routine was different for the 15 universities; in particular, there were differences in the range of information used, in the organisational role of the users and in the goals. Some universities used all the information provided during the laboratory experiments, while others tended to focus on specific areas or specific areas of measurement. For example, universities H, M and O used all the data provided and even asked for further analysis. Some universities tended to focus on costs and some others on the quality perceived. The actors who acted upon the measures were mainly the administrative directors and the top managers; however, in four universities, the data were also required and used by the academic bodies and an internal evaluation committee.4 The most interesting difference that emerged, however, concerns the goal pursued with the PMS. First, some universities used the data for internal reports to show the position of the university in comparison to other institutions; in these cases, no actions usually followed these publications. Two universities used the measures to analyse the organisational performance. University H in particular activated an internal participative analysis process, involving top managers in the administration; this process highlighted possible areas of improvement, which were inserted in the top managers’ evaluation system. Two universities used the results of the laboratory for external accountability; one published the results of the student satisfaction survey and this was followed by some focus groups with the students.The rector of University A used the data on costs during his public speech at the opening of the academic year. Finally, three universities made use not only of the collected data but also of the developed system. One university used this information to enlarge the exercise to decentralised structures (departments) while the other two used it to carry out a replication of the study. In these last cases, the universities tried to increase the involvement of lower levels of staff in the experimentation in order to enhance their understanding of the systems and to train them on the use of the model. Discussion and conclusions Higher education system reforms in Italy have drawn attention to the issue of accountability and performance measurement. Although the importance of accountability is uncontested, the debate on the use, © 2008 The Authors. Journal compilation © 2008 Blackwell Publishing Ltd.
258
Higher Education Quarterly
usefulness and possibility of measuring public-sector performances is still at the centre of research discussions. This paper contributes to this debate by presenting the results of a study that has developed a PMS for central administrative services in Italian universities. The initial idea of the study was set in a context of reform, to respond to the desire of both the university and the Ministry of the University5 to carry out an experiment on university support services. The study drew on Latour’s (1987, 1994) work and, more generally, on the actor network theory to develop the PMS. In particular, some key concepts that were appropriate to enhance the study were endorsed: the participative involvement of ‘humans’ in acting and revising technologies; the use of fact-building to enhance the project network; the observation of ideas in actions that are internal and external to the project space, after the end of the project. The results of the study concern three main features: (1) the developed PMS; (2) the utility of the data obtained; and (3) the method adopted to develop the systems. The first main result of this study is the developed PMS, which is novel from two points of view. First, the system is complete and covers both the costs and the quality of the services provided. Previous studies focused on one specific element, in particular cost, without providing a complete picture of CAS performances. The complete quality and cost map allows different (un)intended choices of universities to manage their services to be seen and the balance between higher costs and higher quality to be verified. Considerations on quality can also be drawn from two different points of view, measuring objective indicators on the services provided (e.g. waiting time) and measuring the satisfaction of the users. This dual perspective has not only highlighted differences among the universities in both dimensions but it has also shown differences among the universities in the users’ perception of the services for the same provided quality.The second novel aspect of the PMS developed in this study concerns the fact that it can offer comparable data. This is a major issue for benchmarking services in universities, which usually have different organisational structures. The problem has been overcome in this study by adopting an activity-based model; with this model, the fundamental unit for measuring performances and then comparing data became the activity. Each area (e.g. student support services) did not refer to the organisational structure present in each university but to a series of activities that were defined and specified in a protocol by the participant universities themselves. In this way, each university knew, for example, that data for the payroll payments were collected with reference to the same protocol and that efficiency and quality performance could © 2008 The Authors. Journal compilation © 2008 Blackwell Publishing Ltd.
PMS for University Central Administrative Services
259
be reliably compared. This advantage was possible because of the great effort that was made both in the design phase and in the data collection. In the design phase, the university managers, the officers and the research group prepared a detailed and shared protocol to prevent possible bias in the comparison. Data collection was then carried out with an ad hoc exercise in which the technical referees collected the data, regardless of their organisational structure. The second major result is the utility of data. Three main sets of data were obtained: the costs, the quality and the overall performance map. All of these analyses proved to be useful and meaningful to managers at an organisational level, but they could also be of benefit at a policy level. At a managerial level, the data on costs and quality, taken singularly, offered each university the possibility of seeing its position in comparison to other universities in the network. Furthermore, the entities with the minimum costs and the highest quality performance could become a target for further improvement. The details provided by the measures also made it possible to investigate which activities were particularly costly or which areas of quality were most critical. The comparison of the objective and the perceived quality also highlighted potential gaps between the level of services offered and students’ perceptions. Areas with higher gaps could perhaps benefit from an enhanced communication about the services provided. Finally, the overall picture of quality and costs created an interesting moment of self-reflection for the top managers: seeing their position in the map, they saw their strategy (or the absence of strategy) translated into performances. As testified by the administrative director of university O (with the highest quality but very high costs in student support services), seeing the position in comparison to other institutions helped him understand that they should stop investing in quality. In his words: ‘maybe what we need to do now is just maintain the level of service without searching for more and more improvements.’ The data could also be interesting at a policy level. Three main issues have emerged from the data. First, the cost data, for the five areas of services included in the study, showed differences in the efficiency levels and provided the possibility of simulating the possible savings for the systems if the ‘inefficient’ institutions were to reduce their costs. Furthermore, the regression analysis showed that there were no significant scale effects in any of the five mapped areas. A second interesting result emerged from the data on quality; the overall analysis of the importance performance matrix could offer indications to policy makers on the factors which are considered important by the students and in which © 2008 The Authors. Journal compilation © 2008 Blackwell Publishing Ltd.
260
Higher Education Quarterly
universities generally show poor performances (Harvey, 1997). Finally, the cost and quality map, which shows the overall position of the universities, is an interesting picture of the results of autonomy in managing support services, through which universities can choose different combinations of quality and costs. Again, policy makers could use performances and data to steer and control investments and results. The final main result of this study is the highly participative method, which was inspired by the actor network theory. The involvement of professional university figures (top managers and officers) right from the early stages of the study has proved to be crucial at several levels. First, the participative approach has increased the quality of the designed PMS; the high level of involvement of the technical referees has made possible a detailed protocol of both costs and quality, which guaranteed comparability of data among the universities. Second, the continuous interaction within the network has encouraged the university staff to interact with the technology under development, not only anticipating problems but also favouring PMS use, and to raise their awareness of what a PMS is and what it can offer. As highlighted by actor network theory supporters, the success of an innovation is in the hands of its users and too often PMSs are misused or not even used because they are developed by external actors (e.g. consultants), and they are seen as having little or nothing to do with reality. Third, the network became a source of legitimation: for the universities, which used the data to support their decisions; for the researchers, who exported the method to other research contexts; and for the performance calculated, which are now used by some institutions that are not involved in the project, as targets to measure their performance. In conclusion, some considerations on the limitations of the study should also be mentioned. The first problem refers to the number of universities that were included. Considering the number of students who attend state universities, the 15 universities involved in the study cover nearly 35 per cent of the entire Italian population; however, considerations on the effects of size (scale effects) and geographical localisation on the comparison of performances should be based on a wider sample. A second limit of this study was due to the great effort that was necessary both to design and implement the system: the network defined a new system, a new protocol and made an ad hoc data collection. This effort was counterbalanced by the meaningful and comparable data that were gathered but, as it was so time-consuming, this type of investigation could not be performed more than once a year. A final limit was due to the fact that the data were provided by technical referees, but they were © 2008 The Authors. Journal compilation © 2008 Blackwell Publishing Ltd.
PMS for University Central Administrative Services
261
subsequently controlled and analysed by the research group. This can be considered a benefit to increase staff participation in the use of the PMS, but it constitutes a limit as far as the controllability of data is concerned. Notes 1. A four-point scale was chosen according to the method used by the national committee to evaluate the university system for its investigations of customer satisfaction in universities that adopt a short scale based on pair points to avoid the problem of concentration of the answers in the mid point. 2. In Italy, both teaching and professional staff are hired through public competitions organised locally. 3. An analysis of variance regression model was used and R2 statistics was employed. The data indicate the good fit of the model, with high P-values and acceptable R2 statistics. 4. The legislative decree of 1997 requires universities to define an internal evaluation committee, which is in charge of controlling that the universities pursue their institutional actions effectively and efficiently. 5. The Italian central government has a specific Ministry, which is responsible for higher education policies and regulation, which is now named Ministero dell’Università e della Ricerca (Ministry of the University and Research).
References Agasisti, T. and Catalano, G. (2006) Governance Models of University Systems – Towards Quasi-Markets? Tendencies and Perspectives: a European Comparison. Journal of Higher Education Policy and Management, 28 (3), pp. 245–262. Aldridge, S. and Rowley, J. (1998) Measuring Customer Satisfaction in Higher Education. Quality Assurance in Education, 6 (4), pp. 197–204. Argyris, C., Putnam, R. and Smith, D. (1985) Action Science. San Francisco, CA: JosseyBass. Arnaboldi, M. and Azzone, G. (2006) Activity-Based Costing and Management in Budgetary Devolution and University Reforms. Accounting,Accountability & Performance, 12 (1), pp. 1–31. Behn, R. D. (2003) Why Measure Performance? Different Purposes Require Different Measures. Public Administration Review, 63 (5), pp. 586–606. Bhimani, A. and Brimson, J. (1989) Advanced manufacturing technology and strategic perspectives in management accounting. European Accounting News, January. Bijker, W. E., Hughes, T. P. and Pinch, T. J. (1987) The Social Construction of Technological Systems: New Directions in the Sociology and History of Technology. Cambridge, MA: MIT Press. Brown, R. and Brignall, S. (2007) Reflections on the Use of a Dual-Methodology Research Design to Evaluate Accounting and Management Practice in UK University Central Administrative Services. Management Accounting Research, 18 (1), pp. 32–48. Callon, M. (1986) The Sociology of an Actor–Network: the Case of the Electric Vehicle. In M. Callon, J. Law and A. Rip (eds.), Mapping the Dynamics of Science and Technology: Sociology of Science in the Real World. London: Macmillan, pp. 19–34. Casu, B. and Thanassoulis, B. (2006) Evaluating Cost Efficiency in Central Administrative Services in UK Universities. Omega, 34 (5), October 2006, pp. 417–426. Cohen, L. and Manion, L. (1980) Research Methods in Education. London: Croom, Helm. Doolin, B. and Lowe, A. (2002) To Reveal Is to Critique: Actor–Network Theory and Critical Information Systems Research. Journal of Information Technology, 17 (2), June 2002, pp. 69–78. © 2008 The Authors. Journal compilation © 2008 Blackwell Publishing Ltd.
262
Higher Education Quarterly
Gendron, Y., Cooper, D. and Townley, B. (2007) The Construction of Auditing Expertise in Measuring Government Performance. Accounting, Organizations and Society, 32 (1–2), Jan/Feb 2002, pp. 101–129. Greenwood, D. J. and Levin, M. (1998) Introduction to Action Research: Social Research for Social Change. Thousand Oaks, CA: Sage Publications. Harris, J. (2005) The Ordering of Things: Organization in Bruno Latour. The Sociological Review, 53 (1), pp. 163–177. Harvey, L. (1994) Employer Satisfaction. Birmingham: CRQ, University of Central England. Harvey, L., Plimmer, L., Moon, S. and Geall, V. (1997) Student Satisfaction Manual. Buckingham: Society for Research into Higher Education (SRHE) and Open University Press. Hatry, H. P. (1999) Performance Measurement: Getting Results. Washington, DC: Urban Institute. Hill, F. M. (1995) Managing Service Quality in Higher Education: the Role of the Student as Primary Consumer. Quality Assurance in Education, 3 (3), pp. 10–21. Johnsen, Å. (2005) What Does 25 Years of Experience Tell Us About the State of Performance Measurement in Public Policy and Management? Public Money and Management, 25 (1), pp. 9–17. Johnson, H. and Kaplan, R. (1987) Relevance Lost: the Rise and Fall of Management Accounting. Boston, MA: Harvard Business School Press. Kaplan, R. S. (1983) Measuring Manufacturing Performance: a New Challenge for Managerial Accounting Research. Accounting Review, 58 (4), pp. 686–705. Kemmis, S. (1985) Action Research and the Politics of Reflection. In D. Boud, R. Keogh and D. Walker (eds.), Reflection: Turning Experience into Learning. London: Kogan, pp. 139–163. Knorr-Cetina, K. (1997) Sociality with Objects: Social Relations in Postsocial Knowledge Societies. Theory, Culture and Society, 14 (4), pp. 1–30. Lapsley, I. and Llewellyn, S. (1995) Real Life Constructs: the Exploration of Organizational Processes in Case Studies. Management Accounting Research, 6 (3), pp. 223– 235. Latour, B. (1987) Science in Action: How to Follow Scientists and Engineers through Society. Cambridge, MA: Harvard University Press. Latour, B. (1994) On Technical Mediation – Philosophy, Sociology, Genealogy. Common Knowledge, 3 (2), pp. 29–64. Lodh, S. C. and Gaffikin, M. J. R. (2003) Implementation of an Integrated Accounting and Cost Management System Using the SAP System: a Field Study. European Accounting Review, 12 (1), pp. 85–121. Lowe, A. (2001) After ANT – an Illustrative Discussion of the Implications for Qualitative Accounting Case Research. Accounting, Auditing & Accountability Journal, 14 (3), pp. 327–351. Mitchell, F. (1994) A Commentary on the Applications of Activity-Based Costing. Management Accounting Research, 5 (3), pp. 261–277. Mitchell, M. (1996) Activity-Based Costing in UK Universities. Public Money and Management, 16 (1), pp. 51–57. OECD (2005). Education at a Glance. Paris: OECD. Suojanen, U. (1999) Action Research – a Strategy for Empowerment. In K. Turkki (ed.), New Approaches to the Study of Everyday Life, Part II. Proceedings of the International Household and Family Research Conference, Helsinki, Finland, Publications 4, Department of Home Economics and Craft Science.
© 2008 The Authors. Journal compilation © 2008 Blackwell Publishing Ltd.
PMS for University Central Administrative Services
263
Appendix Customer satisfaction questionnaire on student support services (scale 1: minimum to 4: maximum) Faculty Economics 1
Law
2
Engineering
Mathematics
3
Literary and Philosophy
How many years ago did you enrol at university? Political Science
Education Science
1
2
3
more
(specialist degree)
1
2
more
(degree) Architecture
D1.How do you evaluate the quality of the support services offered? 1 (Insufficient) 2 (Sufficient) 3 (Good) 4 (Optimum)
D8. How do you evaluate the reliability of the information received or the procedures dealt with? 1 (Insufficient) 2 (Sufficient) 3 (Good) 4 (Optimum)
D2. How do you evaluate the front-end staff competency? 1 (Insufficient) 2 (Sufficient) 3 (Good) 4 (Optimum)
D9. How do you evaluate the simplicity of the different forms (for application, for enrolling, for registration…)? 1 (Insufficient) 2 (Sufficient) 3 (Good) 4 (Optimum)
D3. How do you evaluate the front-end staff helpfulness? 1 (Insufficient) 2 (Sufficient) 3 (Good) 4 (Optimum) D4. How do you evaluate the front-end timetable extension? (evaluating the whole time and its distribution over the day) 1 (Insufficient) 2 (Sufficient) 3 (Good) 4 (Optimum) D5: How do you evaluate the availability and distribution of the automatic tools? (exam registration on-line, on-line certificates, box self-service for enrolling in courses…) 1 (Insufficient) 2 (Sufficient) 3 (Good) 4 (Optimum)
D6. How do you evaluate the waiting time at the front-end before your turn? 1 (Very long) 2 (Quite long) 3 (Quite short) 4 (Very short)
D10. How do you evaluate the accessibility of the different forms (for application, for enrolling, for registration…)? 1 (Insufficient) 2 (Sufficient) 3 (Good) 4 (Optimum) D11. How do you evaluate the time needed by the student support services staff to deal with cases? 1 (Very long) 2 (Quite long) 3 (Quite short) 4 (Very short) D12. How do you evaluate the consistency of information received by the student support services staff? 1 (Insufficient) 2 (Sufficient) 3 (Good) 4 (Optimum) D13. How do you evaluate the coherence of information received by other university staff compared to the information received by the staff of the student support services? (faculty, web site, student guide, posters…) 1 (Insufficient) 2 (Sufficient) 3 (Good) 4 (Optimum)
D7. How do you evaluate the availability of the waiting spaces and the possibility of using the waiting time? (availability of reading rooms, availability of internet, reservation of turns…) 1 (Insufficient) 2 (Sufficient) 3 (Good) 4 (Optimum)
© 2008 The Authors. Journal compilation © 2008 Blackwell Publishing Ltd.