arXiv:1507.07430v1 [cs.DC] 20 Jul 2015
Designing Computing System Architecture and Models for the HL-LHC era L Bauerdick1 , B Bockelman2 , P Elmer3 , S Gowdy1 , M Tadel4 and F W¨ urthwein4 1
Fermilab, Batavia, IL 60510, USA Computer Science & Engineering, University of Nebraska-Lincoln, Lincoln, NE 68588, USA 3 Department of Physics, Princeton University, Princeton, NJ 08540, USA 4 Department of Physics, UCSD, La Jolla, CA 92093, USA 2
E-mail:
[email protected] Abstract. This paper describes a programme to study the computing model in CMS after the next long shutdown near the end of the decade.
1. Introduction One of the recurring challenges for HEP computing in recent years has been data management, access and organisation when using distributed computing resources. The computing model chosen by CMS for the LHC startup used a distributed data management architecture [1] which placed datasets statically at sites. Dataset replicas in multiple sites were made manually as required, and jobs were sent to sites where their input data could be read from site-local storage. The wide area network (WAN) was underutilised as a resource, despite being significantly more robust than originally imagined. The reliability of all WLCG computer centres has greatly improved through the experience gained during LHC Run 1. More sophisticated data management and access models are thus possible. The use of “opportunistic” compute resources also becomes much easier, as they can be used without requiring local data storage. For LHC Run 2 CMS is deploying additional technologies to monitor dataset popularity and use PhEDEx [3] to remove unnecessary dataset replications. These evolutionary changes will allow effective data management and access through Run 2. 2. Data Management at the HL-LHC Planning is currently underway for a High Luminosity Large Hadron Collider (HL-LHC) [2] with an objective of accumulating 3000f b−1 by 2030. Taking into account the upcoming increase in energy for Run 2, and expectations for evolving pile-up and trigger rate through Run 3 and HL-LHC, the data volume increase over the next 15 years will be O(103 ). This may imply that HL-LHC (and perhaps Run 3) will require larger, potentially nonevolutionary, changes to the experiment’s computing model, data management, access and organisation. To that end, a number of ideas and research questions have arisen in the community: Can the architectures and algorithms used for caching and to reduce latencies
Site
Batch
name disk bandwidth network [[site, bandwidth, quality, latency] … ] batch
qjobs [ Job ] rjobs [ Job ] djobs [ Job ] cores bandwidth
Job site cpuTime inputData fractionRead start end runTime dataReadTime dataReadCPUHit theStore
EventStore catalogue {lfn:[site…]} files {lfn:size, …}
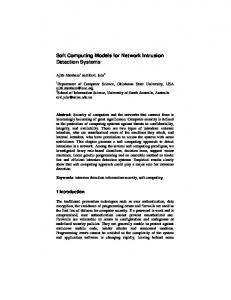
Figure 1: Software classes in the CMS Computing Model Simulation
in Content Delivery Networks be applied to building such a system? What can be learned from commercial/general purpose cloud storage systems (e.g. Google Drive, DropBox) to evolve the existing data federation into a cost-effective, high performance global storage cloud for physics? How can HEP best exploit a hierarchy of cache storage from client side memory, through SSD’s and disks to tape? As the importance of the WAN is increased, are there specific technologies (beyond simple bandwidth increases) that can help? 3. Computing Model Simulation To aid in deciding which type of model could produce the most efficient use of resources a simulation has been developed. The first results from that simulation under three different scenarios are described in this paper. 3.1. Description The simulation is a event driven discrete simulation. The events are merely time slices. In the results reported in this paper the time slices are every 100 seconds. In the simulation each site is defined. A site also contains a batch system, a disk storage system, and a set of network links to other sites. The relationship between the software defined components is shown in Figure 1. The batch system has a set of cores for running jobs. It also contains, but doesn’t currently use, a internal site bandwidth which could further constrain the speed of jobs running at that site. It maintains a list of jobs for each state, queued, running or done. The disk storage system is configured as an available resource. Files can be stored locally and use up this space. There is no tertiary data storage system defined. The network links to other sites are defined with information on the bandwidth of the link, the latency implicit in that link and the quality of the link. This information is used to determine how fast data will flow over the links. In addition there is also an Event Store that is used to define information about files used in the system. It contains the Logical File Name (LFN) and the size of each file. It also has knowledge of which sites have the files stored. The information defined for a job is the CPU time required to carry it out, the site it will run at, which LFNs it will read and what fraction of that data it will read (currently defined to be 100%). It also remembers the original wall clock time required to run the job.
Site Purdue UCSD Nebraska Wisconsin Vanderbilt Caltech Florida MIT FNAL
Purdue 0 100 70 40 40 100 40 40 40
UCSD 100 0 60 70 100 20 100 100 100
Nebraska 100 70 0 40 70 60 70 100 40
Wisconsin 60 100 40 0 70 100 60 70 20
Vanderbilt 40 100 70 60 0 100 40 40 70
Caltech 100 20 40 100 100 0 100 100 100
Florida 40 100 70 70 40 100 0 40 70
MIT 40 100 70 40 20 100 60 0 60
FNAL 70 100 40 20 60 100 70 70 0
Table 1: Link latency (ms) from (horizontal) site to (vertical) site Latency (ms) 0 (ie same site) >=1ms >=50ms
CPU Efficiency Penalty (%) 0 5 20
Table 2: CPU Efficiency Penalty as a function of link latency
3.2. Information Sources The simulation uses current system information to setup a complex and realistic experiment wide computing system. Site information can be extracted from the CMS SiteDB service. This provides information on the resources pledged to the experiment for disk space and CPU power (defined in HEPSpec06). There is an automated tool to extract this information (which was the most recent 2014 pledges) and format it as input for the simulation. In addition, when only considering the CMS infrastructure in the US these numbers were extracted from REBUS. Once the sites are setup the links between them get setup then using information extracted by a script from PhEDEx. This provides a list of links between the sites. Each of those links can have a quality associated with it. This provides information on how often file transfers need to be retried. In addition information on the actual transfer rate is available. However, this information is only available as an aggregated number. It used as an indication of the bandwidth available on the link. This number is constrained to be between 1GB/s and 10GB/s. The other information associated with a link is the latency of the link. Currently this number is estimated based on the distance between sites (see Table 1 for the values used). In a future update to the simulation this should be an relatively easy number to measure. Once sites and the links between them are setup the file size and location information are loaded. These have also been extracted from PhEDEx. The list of files required is found from the list of jobs to be run. When considering only US locations, files that are needed but not present in the US are artificially given a location at Fermilab, the US Tier-1 site. 3.3. Simulation Parameters There are a few distributions used as parameters of the simulation. These are also read from flat files but the information is from different sources. The first of these is the drop in CPU efficiency seen when running jobs that access data from a remote storage element. For example a job reading data at Fermilab while running at UCSD could drop from a 95% efficiency to 75% CPU efficiency. The numbers used currently are merely an estimate till more accurate information can be gathered. These are tabulated in Table 2. Another parameter is the maximum single file transfer rate of a given link. This is again
Latency (ms) 0 (ie same site) >=1ms >=50ms >=100ms
Maximum Single File Transfer Speed (MB/s) 10000 1000 100 50
Table 3: CPU Efficiency Penalty as a function of link latency
FNAL has; 17690TB disk 10400 cores
Each Tier-2 has; 1000TB disk 1224 cores
Figure 2: Sites used in the simulation
based on the link latency. The standard values are shown in Table 3. The last set of parameters used is to Monte-Carlo the CPU efficiency of jobs. A set of jobs run in September of last year is used as the sample set. A distribution is derived from them, which is also binned by CPU time as it is observed that shorter jobs can have a much worse CPU efficiency than longer jobs. There are 100 CPU efficiency bins and 10 CPU time bins in the distribution. 4. Scenarios In each case the CMS computing system in the US is used. This consists of one Tier-1 site (FNAL) and eight Tier-2 sites. Figure 2 shows the location of these sites together with the resources available there today according to REBUS. 4.1. Data preplaced at sites In this scenario data is already mostly preplaced at the site where the job will execute. This is the situation today where bulk data transfers are done using PhEDEx and in the vast majority of cases data is already at a site before the job starts running. In the simulation there are some jobs which do access remote data. In addition there were some jobs where the data read wasn’t present anywhere in the US. In this latter case a copy of the data was placed at FNAL to allow them to run.
Half Max Speed Normal Max Speed Double Max Speed
Half CPU Hit Preplaced Copy Remote 2.77 3.32 3.78 2.77 3.32 3.78 2.77 3.32 3.78
Normal CPU Hit Preplaced Copy Remote 2.77 3.32 3.94 2.77 3.32 3.94 2.77 3.32 3.94
Double CPU Hit Preplaced Copy Remote 2.77 3.32 4.25 2.77 3.32 4.25 2.77 3.32 4.25
Table 4: Total wall clock time of all jobs in billions of seconds
4.2. Data Replication With this scenario data is replicated to sites as the job starts. This introduces a small inefficiency, depending on how long the job would run. In this case all data is placed at FNAL and every job run outside FNAL would copy the data it requires, except in the case where an earlier job had already used the data in question. Copies are cached at sites in this scenario. 4.3. Remote Reading In this scenario all data is located at FNAL and nowhere else. Each job must read over the network to access its data. In this scenario there is no disk space required at the Tier-2s. 5. Execution When execution begins all jobs are read in. For the results presented 56949 jobs were extracted from the dashboard, as run during a week in February 2015. To provide a more even distribution of jobs across the infrastructure each job was duplicated and for the Tier-2 based jobs, ran at another site. For the first scenario described in Section 4.1 the data was also duplicated with the job. The jobs are added to the queue at the sites they are to be run at. Each site is then polled to start any jobs it has capacity to start. Then data transfers are constrained for those jobs, this is needed to determine the run time of the job. Jobs are also checked to see if they’ve finished since the last poll. This may allow some transfers to complete sooner, and hence the jobs that depend on them. Each job has the CPU efficiency Monte-Carlo run for it to determine a first order wall clock time. This can be further extended if data movement is required for the job. A site to site transfer would add a fixed amount of time. A remote read will add a CPU Efficiency penalty while that file is being read. The CPU time of the job is shared between the files based on the size of the file. The simulation takes account of bad quality links while transferring files and has a mechanism to generate retries, and will eventually give up if too many retries occur. It would then locate another copy of the file to use. Once the job does complete there is a total wall clock time recorded for the job. 6. Results 6.1. Total Wall Clock Time We can use the total wall clock time required to run all the jobs in each of the scenarios to make a comparison. Table 4 shows these total wall clock time for the three scenarios. It also shows the results if we vary the simulation parameters by a factor of two in each direction. There is a very small difference in the Transfer File time with the change in maximum single file transfer speed. This isn’t evident as it is only apparent beyond the first three significant figures. You can see that in each set of parameters that not preplacing the data costs almost 20% more wall clock time to be used. The penalty for doing remote reads varies from 36% up to 53%, depending on the actual set of remote read parameters used. The simulation is more sensitive to this parameter.
(a) Preplaced Data
(b) Copy: Half Rate
(c) Copy: Normal Rate
(d) Copy: Double Rate
(e) Remote: Half Penalty
(f) Remote: Normal Penalty
(g) Remote: Double Penalty
Figure 3: Distribution of CPU Efficiency across all jobs
6.2. CPU Efficiency The latencies and penalties that jobs are exposed to cause their CPU efficiency to drop. In the different scenarios we can see a slightly different behaviour. We can see various CPU Efficiency distributions in Figure 3. The distribution in Figure 3a shows the case where data is preplaced at sites. There is very little change if the remote read penalty or the maximum file transfer speed is varied. The average CPU efficiency in this case is 84.5%. In Figures 3b-3d you can see the effect on the CPU efficiency when the maximum file transfer rate is first halved, normal and then doubled. The effect is small, and the average number varies from 76.1% up to 76.4%. In the case of reading the data remotely there is a much larger variation. This can be seen in Figures 3e-3g. Here the average varies from 68.3% down to 61.6%. You can also see the artificial nature of the imposed penalty producing a two peak structure. As the penalty increases it moves the set of jobs with a lower penalty out of those jobs run at FNAL, which have no penalty, producing three peaks.
(a) Half CPU/Half Tran
(b) Normal CPU/Half Tran
(c) Double CPU/Half Tran
(d) Half CPU/Normal Tran
(e) Normal CPU/Normal Tran (f) Double CPU/Normal Tran
(g) Half CPU/Double Tran
(h) Normal CPU/Double Tran (i) Double CPU/Double Tran
Figure 4: Sum of job queues at all sites
6.3. Job Queues During Simulation While the simulation is running the state of each of the job lists at the sites is monitored. We can graph these to see the progression of jobs through the system. Figure 4 shows these queues for each of the nine sets of input parameters. 6.4. Network Usage Another observation from the simulation is the network bandwidth used in each case. Each of the scenarios has been studied with varying the input parameters. The variation is in line with expectations and only the “normal” parameter set will be shown for each of the scenarios. In Figure 5 you are able to see the network out of FNAL to each of the Tier-2 sites. As expected when data is preplaced (Figure 5a) at the Tier-2 sites the network used is very minimal. If data is copied (Figure 5b) the network usage is more uneven as the transfers happen as quickly as possible. Whereas when data is read remotely (Figure 5c) data is only consumed at the speed of the job on the Tier-2 site. The network load between the Tier-2 sites was also examined. The total Tier-2 to Tier-2 bandwidth used is show in figure 6, again only the “normal” parameter set is shown. For the case when the majority of the data is preplaced (Figure 6a) at the job execution site there is very little Tier-2 to Tier-2 activity. The small amount of data transferred will be for those jobs
(a) Preplaced Data
(b) Data Copied
(c) Remote Read
Figure 5: Bandwidth used out of FNAL
(a) Preplaced Data
(b) Data Copied
(c) Remote Read
Figure 6: Bandwidth used between Tier-2 sites
which ran at a site which didn’t have the data locally but was available from another Tier-2 which was “nearer” than FNAL. For the case when the data was copied from FNAL (Figure 6b) the larger proportion at the end will be data duplicated from FNAL to the Tier-2 sites, which then represented a better replica that the original copy at FNAL for a later job ran at another Tier-2 site. For the case when data is always read from FNAL (Figure 6c) there are no replicas made at Tier-2s, so there is no Tier-2 to Tier-2 data transfers. 7. Conclusions The simulation can show us what can happen in different scenarios. As is shown with the situations studied in this paper alternative strategies don’t produce results quicker, however, there could be significant savings in cost and maintenance of disk space at Tier-2 sites, which could allow purchase of more CPU resources to offset the extra wall clock time required. Once a more accurate set of simulation parameters has been determines quantitative comparisons can be made. References [1] Bayatyan G L et al, CMS Computing Technical Design Report, CERN Report CERN-LHCC-2005-023 (2005). [2] Rossi L and Bruning O 2012 High Luminosity Large Hadron Collider - A description for the European Strategy Preparatory Group, CERN report CERN-ATS-2012-236 [3] Rehn J et al 2006 PhEDEx high-throughput data transfer management system Proceedings of Computing in High Energy Physics (CHEP 2006), Mumbai